Operations | Monitoring | ITSM | DevOps | Cloud
July 2022
Introduction to reliability management
How to monitor Apache Flink with OpenTelemetry
3 Pros and Cons of Amazon CloudWatch
BindPlane OP Build Process - Using Goreleaser
3 ways to prevent mapping explosion in Elasticsearch
4 Killer Coralogix Tracing Features
Tracing is often the last thought in any observability strategy. While engineers prioritize logs and metrics, tracing is truly the hallmark of a mature observability platform, but it is also the most difficult to implement. Once tracing is in place, engineers typically discover something else – many tracing solutions aren’t particularly feature-rich.
The Papertrail SaaS Add-On in DigitalOcean Centralizes Everything You Need for Log Management
Monitorama 2022: the good, the bad and the beautiful (Part 1)
solr-reindexer: Quick Way to Reindex to a New Collection
If you’re using Solr, for sure there are times when you change the schema and need to reindex. Quite often the source of truth is a database, so you can use streaming expressions via the JDBC source to reindex. But sometimes that’s not possible or adds too much load to the DB. So how can we use Solr itself as a source?
Welcome to the Future of Data Search & Exploration
You have more data coming at you than ever before. Over the next five years, the total amount of digital data is going to be more than twice the amount of data created since the advent of digital storage. With the success of your company often determined by how you anticipate and respond to threats – and leverage meaningful insights – you need the ability to quickly search and find insights in your data, despite this increasing deluge of information.
New in Grafana Loki 2.6: multi-tenant queries and targeted log line deletion
Grafana Loki 2.6 is here! In addition to improvements in query performance, we are excited to introduce two key features in Grafana Loki: cross-tenant query federation and targeted deletes.
Network as Code Explained: How Ansible & Automation Support Agile Infrastructure
When considering application source code, the way you maintain consistency throughout environments is mostly straightforward. You write application code, commit it to source control, and then build, test and deploy via a CI/CD pipeline. Since the application is defined by the source code living in source control, the build will be identical in all environments to which it’s deployed. But what about the infrastructure on which an application runs?
Exporting Splunk Data at Scale: See a Need, Fill a Need
The Core Splunk platform is rightfully recognized as having sparked the log analytics revolution when viewed through the lenses of ingest, search speed, scale, and usability. Their original approach leveraged a MapReduce approach, and it still stores the ingested data on disk in a collection of flat files organized as “buckets.” These immutable buckets are not human-readable and largely consist of the original raw data, indexes (.tsidx files), and a bit of metadata.
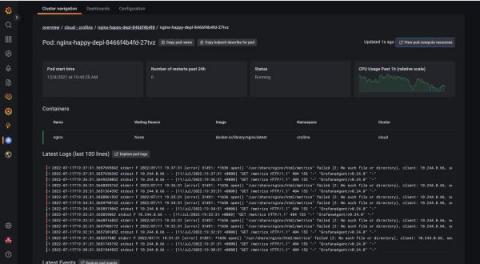
Introducing instant Kubernetes logging with Kubernetes Monitoring in Grafana Cloud
Kubernetes, Prometheus, and Grafana are a trio of technologies that have transformed cloud native development. However, despite how powerful these three technologies are, developers still face gaps in the process of implementing a mature Kubernetes environment.
Driving Innovation Aligned with the AWS Security Competency Re-launch
Logz.io recently obtained the Amazon Web Services (AWS) Security Competency for our Cloud SIEM. We are thrilled to support the re-launch of the AWS Security Competency, as clearly the only way to combat today’s cybersecurity challenges is to modernize your analytics platform to respond to today’s evolving threat landscape.
Flow Alerts Overview
How to monitor Jetty using OpenTelemetry
Masking PII: Minimize Your Risk and Stay Out of Trouble
Consumers expect their personal information to be safe in your hands as they use your apps, services, and stores. Even in-person retailers collect customer data for loyalty programs, shopping history, and more. In addition, regulators and auditors — and while we’re at it, let’s add investors, board members, and partners to the list of people who expect all customer data to be secure at all times.
Black Friday log management (with the Elastic Stack) checklist
For this Black Friday, Sematext wishes you: Now seriously, applications tend to generate a lot more logs on Black Friday, and they also tend to break down more – making those logs even more precious. If you’re using the Elastic Stack for log management, in this post we’ll share some tips and tricks to prepare you for this extra traffic.
Full-Stack Observability Guide
Like cloud-native and DevOps, full-stack observability is one of those software development terms that can sound like an empty buzzword. Look past the jargon, and you’ll find considerable value to be unlocked from building observability into each layer of your software stack. Before we get into the details of observability, let’s take a moment to discuss the context.
Masking Data with Cribl Stream
Serverless Monitoring In The Cloud With The observIQ Distro for OpenTelemetry
Executive Lookout: Observing Observability
Splunk Observability is incredibly good at details! Many of us use it as a metaphorical microscope through which we observe our software. But how do you observe the long-term trends and usage of that microscope? There are numerous organization-level metrics provided in Splunk Observability that can be used to chart organization-level concerns. These can be leveraged in various ways to understand things like uptake, billing and just how much value Observability is providing.
No Startup Is a Startup Forever - How to Navigate Scaling Your Company
In the last five years, Cribl has gone from 3 employees to more than 400 employees — it’s been an incredible, crazy, difficult, tiring, fucking awesome ride. It’s also been an emotional roller coaster with all the ups and downs, but despite all the challenges, things have been trending upwards.
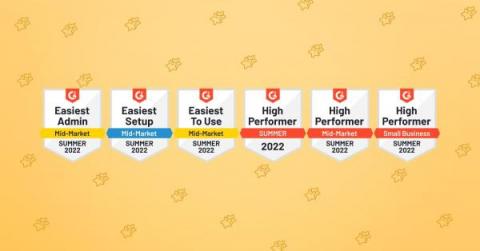
Logz.io Cloud SIEM Honored with 6 Summer 2022 G2 Badges!
For Summer 2022, Logz.io is thrilled to have earned six G2 Research Badges for our Cloud SIEM offering. These honors highlighted the ease of setup, ease of use, and high performance that we provide our customers through Cloud SIEM. G2 Research is a tech marketplace where people can discover, review, and manage the software they need to reach their potential.
The Papertrail SaaS Add-On in DigitalOcean Centralizes Everything You Need for Log Management
How to Monitor Docker Metrics | Container Performance Monitoring Explained - Sematext
TransUnion's Steve Koelpin shares his solution to automate log onboarding
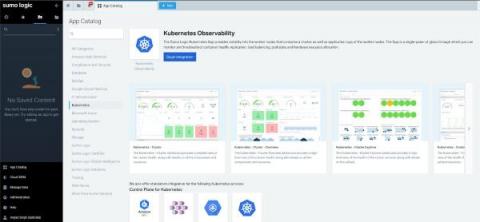
How to gain Kubernetes visibility in just a few clicks
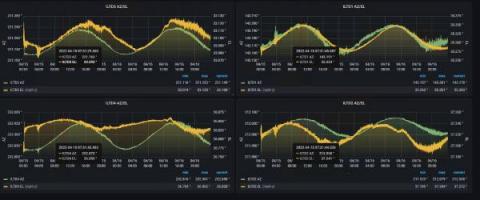
How to improve uptime with real-time monitoring, Grafana dashboards, and Grafana Loki: Inside Dish Network's observability stack
Dish Network is on a mission to connect people and things by changing the way the world communicates. With products ranging from Dish and Sling TV to retail wireless services and 5G networks, monitoring their satellite communications equipment is mission critical to maintaining extreme uptime for Dish’s 20 million customers across the United States.
Status Pages: The Ultimate Guide
Status pages have become the end-users window into your team’s operations. Companies with status pages are doing the right thing for their users — building in some transparency while mitigating frustration and support contact. For the benefits of status pages to pay off, organizations need to treat them as something more than active wiki-pages run by support.
The Next Frontier for Observability: Data Ownership with OpenTelemetry
Observability is a mindset that lets you use data to answer questions about business processes. In short, collecting as much data as possible from the components of your business — including applications and key business metrics — then using an AI-powered tool to help consolidate and make sense of this huge volume of data gives you observability into your business. Having observability for your business and applications lets you make smarter decisions, faster.
How to gain Kubernetes visibility in a few clicks
Tracing vs. Logging: What You Need To Know
Log tracking, trace log, or logging traces… Although these three terms are easy to interchange (the wordplay certainly doesn’t help!), compare tracing vs. logging, and you’ll find they are quite distinct. Logs, traces, and metrics are the three pillars of observability, and they all work together to measure application performance effectively. Let’s first understand what logging is.
Introduction to reliability management
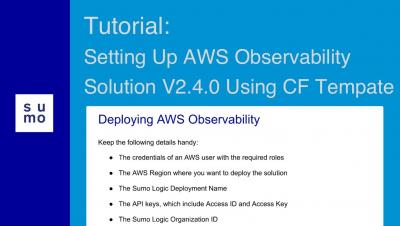
Tutorial: Setting Up AWS Observability Solution V2.4.0 Using CloudFormation Template
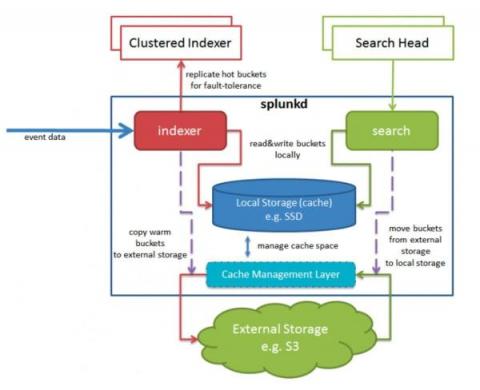
Splunk 9.0 SmartStore with Microsoft Azure Container Storage
With the release of Splunk 9.0 came support for SmartStore in Azure. Previously to achieve this, you’d have to use some form of S3-compliant broker API, but now we can use native Azure APIs. The addition of this capability means that Splunk now offers complete SmartStore support for all three of the big public cloud vendors. This blog will describe a little bit about how it works, and help you set it up yourself.
How Does Observability Help an Organization Move the Needle?
If you’re new to the concept or just trying to keep up with the conversation, Gartner defines Observability as the evolution of monitoring into a process that offers insight into digital business applications, speeds innovation and enhances customer experience. Some folks think that Observability is a new buzzword, but in fact the term was coined in 1960 by Rudolf E. Kalman, a Hungarian-American engineer.
Logging in Python: A Developer's Guide
Have you ever had a tough time debugging your Python code? If yes, learning how to set up logging in Python can help you streamline your debugging workflow. As a beginner programmer, you’ll have likely used the print() statement—to print out certain values across runs of your program—to check if the code is working as expected. Using print() statements to debug could work fine for smaller Python programs.
What is Tracing? Everything You Need to Know
Tracing, or more specifically distributed tracing or distributed request tracing, is the ability to follow a request through a system, joining the dots between all the individual system calls required to service a particular request. Although tracing logs have been around for some time, the trend toward distributed architectures, microservices, and containerization has elevated it from nice-to-have status to an essential piece of the observability puzzle.
Introducing our new log viewer
Today we are rolling out our new "operation log viewer." This feature is not just a new page to show logs but a whole new way to find logs for actions taken by you and your team on your applications. The new log viewer page supports historical deployment logs, allowing you to see logs from previous actions.
Coralogix Platform Overview - July 2022
How to monitor Hadoop with OpenTelemetry
Cribl Named as a Big Data Emerging Vendor by CRN
Although we’ve encouraged employees to take plenty of time off this summer to relax, recharge, and enjoy time with family, Cribl certainly hasn’t been on a summer holiday as a company. After the big announcement in late May with Cribl Search and our Series D funding round, we moved right into the announcement of Cribl Stream 3.5, Cribl Edge 3.5, massive upgrades to Cribl.Cloud, and the launch of our Cribl Certified Observability Program.
Content Delivery Networks (CDNs) vs. Load Balancers: What's The Difference?
Load balancers and content delivery networks (CDNs) are critical tools for delivering modern, cloud-native applications. They play essential roles in ensuring the smooth flow of data between applications and end-users. If you don’t have both a load balancer and a CDN in place, you’re probably in a poor position to guarantee the uptime of your application across a wide geographic area. That does not mean, however, that load balancers and CDNs do the same thing.
Learn how application monitoring helps lay the foundation for operational success
How to Collect and Ship Windows Events Logs with OpenTelemetry
Empowering Security Engineers With the Cribl Pack for CrowdStrike
CrowdStrike is a class-leading endpoint monitoring solution. It collects a wealth of activity data from each managed endpoint that can be fairly voluminous. This includes network connectivity, DNS request, process activity, health checks, and the list goes on. In fact, there are over 400 event types reported by CrowdStrike! These events are a gold mine for threat hunters and blue teams looking for unusual or malicious activity. It can be extremely costly to place all this data in a SIEM.
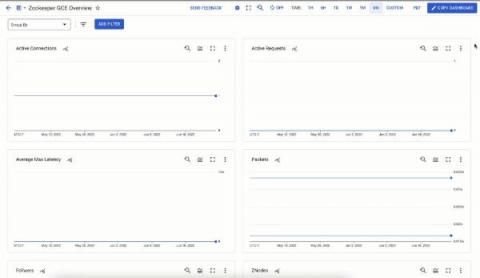
How to Monitor ZooKeeper: Key Metrics & Best Tools [2022 Comparison]
Apache Zookeeper is a great tool used by many popular tools. Your Kafka uses Zookeeper, your HDFS uses it, your SolrCloud uses it, and your ClickHouse may also be using it. No matter where you are using Apache Zookeeper, it is usually a crucial piece of the infrastructure and it needs to be reliable and fast.
Splunk vs ELK
If you have any experience with comparing the leading tools in observability then it is very likely that you will have come across Splunk & ELK during your research. These two titans have provided a swiss army knife of useful tools to many developers, cybersecurity specialists and devops professionals over the years since their inception. In this guide, we’ll be comparing these two leading SIEM tools against each other to help you to decide on which solution will help your security use case.
How Can OpenTelemetry Enhance Application Performance Monitoring?: A Gartner Quick Answer
Earlier this year Gartner published a report discussing OpenTelemetry and its place in enhancing Application Performance Monitoring (APM).
Sematext Experience | Real User Monitoring Tool | Front-end Monitoring Solutions
Analyze VPC Flow Logs for AWS Transit Gateway in Datadog
AWS Transit Gateway is a service that makes it easy to connect multiple Amazon Virtual Private Clouds (VPCs), AWS accounts, AWS Regions, and on-premises networks together through a central hub. For AWS customers operating at global scale with many accounts and VPCs, AWS Transit Gateway greatly simplifies AWS networking architecture by eliminating the need to manage complex peering relationships and massive route tables.
How to monitor Zookeeper with OpenTelemetry
What Is eBPF? A Guide To Improved Observability & Telemetry
Extended Berkeley Packet Filter (eBPF) is an exciting technology that provides secure, high-performance kernel programmability directly from the operating system. It can expose a wide range of applications and kernel telemetry that is otherwise unavailable. But with operating systems frequently processing very large volumes of network data, even with an efficient framework and cheap eBPF program runs, costs can add up quickly.
An Introduction to Kubernetes Observability
If your organization is embracing cloud-native practices, then breaking systems into smaller components or services and moving those services to containers is an essential step in that journey. Containers allow you to take advantage of cloud-hosted distributed infrastructure, move and replicate services as required to ensure your application can meet demand, and take instances offline when they’re no longer needed to save costs.
Key Server Metrics to Monitor for Peak Performance and Health
No matter how well-designed, flashy, or useful your application is for your target users, they may not take kindly to it being slow or, even worse, crashing once in a while. You will lose customers and revenue as a result. The solution is definitely not to add additional features to the application to bring back users. Instead, it’s as simple as paying close attention to the health of the servers where your application is hosted.
The Leading Tools Compatible With OpenTelemetry
OpenTelemetry (also known as OTel) is a popular open-source framework used to generate telemetry data for traces, metrics, events and logs. In this guide, we are going to cover the best observability and application performance management tools that can be used alongside OpenTelemetry to transform telemetry data into responsive reporting dashboards.
How to Monitor Varnish with Google Cloud Platform
Machine Learning at Splunk in Just a Few Clicks
The Machine Learning team at Splunk has been hard at work over the last several months preparing for a few exciting launches at.conf22, held just a few weeks ago. Splunk customers want to leverage machine learning (ML) in their environments, but many aren’t sure how to use it, or even how to get started.
Cribl Search Unlocks The Value of ALL Data
We announced Cribl Search in May, and customer reaction has been incredibly positive. We’ve heard for some time that organizations have data everywhere. They have data in their observability lakes, analytics tools, object stores, and at the edge. The big challenge facing enterprises is that existing search models require you to take all of this data that you don’t know is valuable or not, move it into one place, and then make decisions about whether this is valuable?
Mezmo Named a Top Vendor for Managing IT Performance by DEJ
We are thrilled to announce that Mezmo has been recognized as one of the Top 20 Vendors for Managing IT Performance in 2022 by Digital Enterprise Journal (DEJ). This list was created in response to DEJ’s study, 24 Key Areas Shaping IT Performance Markets in 2022. DEJ analysts surveyed more than 3,300 organizations around a variety of topics to craft a comprehensive understanding of the state of these programs today.
Building resilience for applications and services with Elastic Observability
Insights from the 2022 Results That Matter study Correlating data across multiple silos and applications to derive meaningful and actionable insights is an ongoing struggle. These challenges are only set to increase as high-speed connectivity becomes more ubiquitous and enables data-heavy, digital experiences.
OpenTelemetry Roadmap and Latest Updates
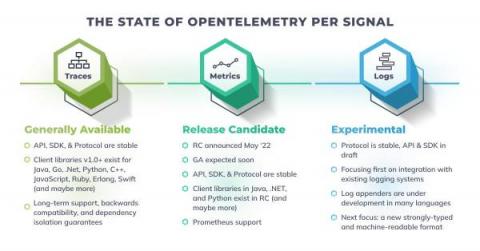
OpenTelemetry is one of the most fascinating and ambitious open source projects of this era. It’s currently the second most active project in the CNCF (the Cloud Native Computing Foundation), with only Kubernetes being more active. I was at KubeCon Europe last month, delivering a talk on OpenTelemetry and it was amazing to see the full house and the excitement and interest around the project.
Stream application logs into Cloud Logging
Common Anomaly Detection Challenges & How To Solve Them
Anomaly detection can be defined by data points or events that deviate away from its normal behavior. If you think of this in the context of time-series continuous datasets, the normal or expected value is going to be the baseline, and the limits around it represent the tolerance associated with the variance. If a new value deviates above or below these limits, then that data point can be considered anomalous.
Network Performance Monitoring vs. Application Performance Monitoring: What's The Difference?
Network performance monitoring (NPM) and application performance monitoring (APM) are both key pillars of an overall performance and reliability management strategy, especially when dealing with complex, distributed infrastructure across cloud-native environments. NPM and APM also complement each other, in the sense that NPM can serve as an additional source of truth and observability for application performance.
State of Kubernetes 2022: Report Roundup
According to recent surveys and reports on the industry, Kubernetes and containers are more popular than ever. Containers and serverless functions are being mainstream and ubiquitous – with a more than 300% increase in container production usage in the past 5 years. This trend is especially true for large organizations, which are often using managed platforms and services.
Introducing Splunk Attack Range v2.0
The Splunk Threat Research Team (STRT) has continued focusing development on the Splunk Attack Range project and is thrilled to announce its v2.0 release with a host of new features. Since the v1.0 release 6 months ago the team has been focused on developments to make the attack range a more fully-featured development testbed out of the box. This blog post will share these additions as well as some of the project’s future directions.
Analyzing Test Results Through Your Logs & How to Choose Which Automation Tests to Implement
According to the 2021 test automation report, more than 40% of companies want to expand and invest their resources in test automation. While this doesn’t mean manual testing is going away, there is an increased interest in automation from an ROI perspective – both in terms of money and time. After all, we can agree that writing and running those unit test cases are boring.
Unpopular Opinion: OKRs Are the Worst
One of the things about Silicon Valley culture is the obsession around the technology that gets created and the idea of the engineer as the hero of the story. You see the same kind of thing with other professions — like with finance executives in New York, celebrities in Hollywood, or firefighters and police officers in different areas across the US.
Monitoring Windows Infrastructure: Tools, Apps, Metrics & Best Practices
Love it or hate it, many organizations have Microsoft Windows as part of their infrastructure. They usually operate a series of Windows services like: Although surveys report that the market share of businesses using Windows is smaller than that of businesses using Linux, many organizations still use private Windows servers that are not accessible over the internet.
How Modern Log Intelligence Meets New Cybersecurity Regulations by CERT-In
The CrowdStrike Pack
How to monitor Cassandra using OpenTelemetry
Unlocking Cribl Stream's LDAP Integration
Cribl Stream has supported external Lightweight Directory Access Protocol (LDAP) authentication since version 2.0 was released in late 2019. LDAP directories offer many features, and it’s up to clients to implement them for compatibility. Here is a non-exhaustive list of LDAP features that Cribl Stream does not support: This blog post explores how Cribl Stream implements LDAP for user authentication and assumes you have a working knowledge of the topic.
Sematext Logs Product Overview | Centralized Logging for all of your Applications
How to configure Grafana Loki with a Node.js e-commerce app
I recently changed teams within Grafana and now I get the chance to work with Grafana Loki, our highly effective open source log aggregation system that stores and queries logs from your infrastructure or applications. At Grafana, we always dogfood our products so what better way to learn more about Loki than trying out a simple use case that I can actually benefit from.
How to monitor JVM with OpenTelemetry
geeks+gurus: Modern Application Architecture
geeks+gurus: Benefits of Cloud Native
geeks+gurus: Tackling Common DevOps and Security Issues in Game Development
geeks+gurus: Sumo Logic's Debut in the Gartner APM (&O!) Magic Quadrant
Continuous Profiling: A New Observability Signal
We’ve all grown used to logs, metrics and traces serving as the “three pillars of observability.” And indeed they are very important telemetry signals. But are they indeed the sum of the observability game? Not at all. In fact, one of the key trends in observability is moving beyond the ‘three pillars: One emerging telemetry type shows a particularly interesting potential for observability: Continuous Profiling.
An Observability Agent for the Cloud Era: Why Cribl Edge Matters
A few weeks ago, I did a live Cribl Edge demo for the Cribl Community, and I wanted to explain more about the importance of Cribl Edge for IT admins. Managing traditional log shipping agents is very time-consuming and brittle. Just the act of a once-a-year upgrade can require the help of a kind god! Admins need help to make this vital workflow easier and faster so they can focus time on delivering value to the business.
PostgreSQL Logging Configuration Explained: How to Enable Database Logs
PostgreSQL is an open-source relational database management system that’s been utilized in continuous development and production for 30 years now. Nearly all the big tech companies use PostgreSQL, as it is one of the most reliable, battle-tested relational database systems today. PostgreSQL is a critical point in your infrastructure, as it stores all of your data. This makes visibility mandatory, which in turn means you have to understand how logging works in PostgreSQL.
The Cribl Packs Dispensary - A Place to Share and Care
Building Packs is good. Sharing Packs is better! The Cribl Pack Dispensary is the go-to place to find, install and share Cribl Packs. What are Packs? A Cribl Pack is a collection of pre-built routes, pipelines, data samples, and knowledge objects. Packs enable sharing of best-practice configurations that route, shape, reduce and enrich the log source, Palo Alto Networks logs for example. And it’s the quickest, easiest way to get started with Stream and Edge supports Packs too.
Cloud Configuration Drift: What Is It and How to Mitigate it
More organizations than ever run on Infrastructure-as-Code cloud environments. While migration brings unparalleled scale and flexibility advantages, there are also unique security and ops issues many don’t foresee. So what are the major IaC ops and security vulnerabilities? Configuration drift. Cloud config drift isn’t a niche concern. Both global blue-chips and local SMEs have harnessed Coded Infrastructure.
Top Prometheus Interview Questions
If you are an engineer searching for a new role that involves a high level of knowledge on the monitoring stack Prometheus then you will likely wish to brush up on your knowledge of Prometheus ahead of your interview. In this guide, you will find a list of the most popular questions that are most likely to be asked to candidates looking to use Prometheus as part of their daily monitoring stack within their next role.
LogRhythm Cloud: Too Little, Too Late
Over the last 12 months, we’ve seen growing momentum around several disruptive trends in the cloud SIEM market. One of the most pervasive and obvious developments for Logz.io is the frequency with which we encounter customers seeking to replace dated and legacy on-premises SIEMs with a solution such as our Cloud SIEM. The traditional provider that comes up most often is LogRhythm—for numerous different reasons.
Logit.io Launches Further Improvements To Alerting & Monitoring
We are happy to announce today that we have launched further improvements to the Logit.io platform’s alerting and monitoring features. This latest release of the Logit.io platform offers our users an improved workflow to assist with their productivity on the platform as well as a more updated intuitive user interface (UI).
More support for structured logs in new version of Go logging library
The new version of the Google logging client library for Go has been released. Version 1.5 adds new features and bug fixes including new structured logging capabilities that complete last year's effort to enrich structured logging support in Google logging client libraries. Here are few of the new features in v1.5: Let's look into each closer.
Splunk Critical to Analyze Hundreds of Millions of Data Points for Stripe
Sematext Cloud | Full Stack Visibility in One Place | A Cloud Monitoring solution
Splunk Tutorials: Getting Started Using Splunk
Whether you are new to Splunk or just needing a refresh, this post can guide you to some of the best resources on the web for using Splunk. We’ve gathered, in a single place, the tutorials, guides, links, and even books to help you get started with Splunk.


