Operations | Monitoring | ITSM | DevOps | Cloud
January 2023
Fintech APM: Considerations, Benefits, and Tools
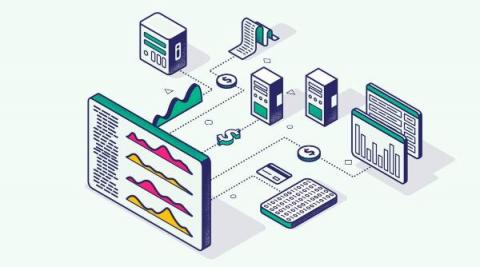
In the last few years, fintech enterprises have disrupted the financial services and banking industry by taking everything computing technology offers – from machine learning to blockchain – and turning it up a notch. Traditional financial institutions must now compete with challenger banks offering electronic payment alternatives, peer-to-peer lending, and investment apps.
Using AIOps for automation and efficiency in observability and IT operations
Artificial intelligence for IT Operations (or AIOps) has been playing an expanding role in helping SREs, DevOps, and developers effectively navigate the challenges around application and infrastructure complexity, pace of change, and data volume that characterize the operations landscape.
Sumo Logic platform video
Test Observability with Sumo Logic
How to create data views and gain insights on Elastic
The Right Time to Right-Size Your Observability Process
Every client we meet has been using multiple tools to satisfy their observability needs. We rarely find a greenfield opportunity. As their journey progresses, they have pointed out when the time is right to add ChaosSearch into the fold. There isn't just one symptom; it's usually a combination of things, including high log data volume, unpredictable costs, and ineffective results, to name a few. By the time we talk to clients in this state, the pain and frustration are incredibly high. We created a five-minute video to demonstrate how clients find themselves in this predicament.
How to Get Full Kubernetes Observability in Minutes
How is your organization handling Kubernetes observability? What tools are you using to monitor Kubernetes? Is it a time-consuming, manual process to collect, store and visualize your logging, metrics and tracing data? And, what are you actually getting out of all that investment? At Logz.io we’re trying to make this process easier for customers who are serious about Kubernetes observability. We’ve made significant investments in this area for Kubernetes use cases.
Everything You Should Know About Windows Event Logs
If you’ve ever seen Indiana Jones and the Last Crusade, you might remember the scene where Indy and his dad are in a room replete with the most ornate chalices possible, only to realize that the Holy Grail is the most plain, utilitarian one in the room. Windows event logs are the IT version of the plain-looking clay cup that holds the key to answering your service questions and system issues.
Observability to Modernize Apps and Increase Business Resilience
Increasingly, the speed and scale of a business can be measured by the resilience and performance of its applications. That’s why organizations are opting to modernize legacy applications by rewriting them using cloud-native tools and platforms. A Gartner study found that by 2025, cloud-native platforms will be the foundation for more than 95% of new digital initiatives, compared to less than 40% in 2021.
7 Open-Source Log Management Tools that you may consider in 2023
BindPlane OP Overview
Introduction to Splunk Log Observer
Elasticsearch Open Source Monitoring Tools [2023 Comparison]
This article is the third of a four-part series of articles about Elasticsearch monitoring. In the first article, we put together an Elasticsearch guide, covering how Elasticsearch works and why the setup and tuning of Elasticsearch requires a good knowledge of configuration options and performance metrics.
Monitoring with Prometheus vs Grafana: understanding the difference
Using Logs to Troubleshoot Failing Cron Jobs
Let’s say you have a script that works when run in an interactive session, but does not produce expected results when run from cron. What could be the problem? Some potential culprits include: Or it could be something else. How to troubleshoot this then, and where to start? Instead of trying fixes at random, I prefer to start by looking at logs.
Surface and Confirm Buggy Patterns in Your Logs Without Slow Search
Incidents happen. What matters is how they’re handled. Most organizations have a strategy in place that starts with log searches—and logs/log searching are great, but log searching is also incredibly time consuming. Today, the goal is to get safer software out the door faster, and that means issues need to be discovered and resolved in the most efficient way possible.
Maximizing Value and Minimizing Costs: Insights and Next Steps for Effective Tool Deployment
Reduce MTTR with Logz.io's Single-Pane-of-Glass Observability Data Analytics
Observability data provides the insights engineers need to make sense of increasingly complex cloud environments so they can improve the health, performance, and user experience of their systems. These insights can quickly answer business-critical questions like, “what is causing this latency in my front end?” Or, “why is my checkout service returning errors?” Observability is about accessing the right information at the right time to quickly answer these kinds of questions.
Easily analyze AWS VPC Flow Logs with Elastic Observability
Elastic Observability provides a full-stack observability solution, by supporting metrics, traces, and logs for applications and infrastructure. In a previous blog, I showed you how to monitor your AWS infrastructure running a three-tier application. Specifically we reviewed metrics ingest and analysis on Elastic Observability for EC2, VPC, ELB, and RDS.
Getting started with unified observability for Azure in less than 10 minutes using terraform
Detect data exfiltration activity with Kibana's new integration
Does your organization’s data include sensitive information, like intellectual property or personally identifiable information (PII)? Do you want to protect your data from being stolen and sent (i.e., exfiltrated) to external web services? If the answer to these questions is yes, then Elastic’s Data Exfiltration Detection package can help you identify when critical enterprise data is being stolen and exfiltrated.
Thousands of Insights at a Glance With Coralogix Alert Map
An effective alerting strategy is the difference between reacting to an outage and stopping it before it starts. That’s why at Coralogix, we’re constantly releasing new features that redefine how alerts are consumed, to enable teams to push their ambitions even further, release with confidence, and tackle issues proactively. Alerts Map is now an indispensable tool for that mission.
Coralogix Feature Overview: AlertMap
Using the RUM HTTP Traces App for Manual Testing
FluentD vs FluentBit - Which log collector to choose?
Why metrics, logs, and traces aren't enough
Unlock the full potential of your observability stack with continuous profiling Identifying performance bottlenecks and wasteful computations can be a complex and challenging task, particularly in modern cloud-native environments. As the complexity of cloud-native environments increases, so does the need for effective observability solutions.
How to discover advanced persistent threats in AWS
Single Vendor vs Best of Breed Solutions: A Livestream Debate on 2023 Trends
Log Analytics in Cloud Logging is now GA
Cloud Logging’s Log Analytics, with advanced search, as well as aggregation and transformation of all log data types, is now generally available.
How to use Quick Actions in Sematext | Sematext Cloud Monitoring
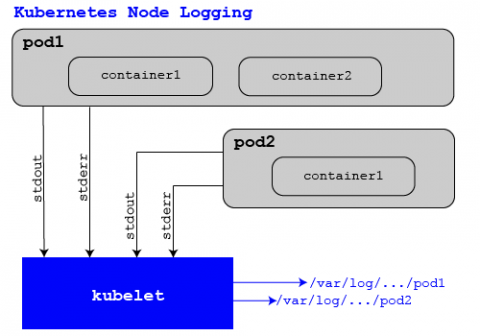
Logging and monitoring Kubernetes
What Is Observability?
Logs vs Metrics: Pros, Cons & When to Use Which
As we at Splunk accelerate our cloud journey, we’re often faced with the decision of when to use logs vs metrics — a decision many in IT face. On the surface, one can do a lot by just observing logs and events. In fact, in the early days of Splunk Cloud, this is exactly how we observed everything. As we continue to grow, however, we find ourselves using a combination of both. This post lays out the overall difference in logs and metrics and when to best utilize each.
Splunk Data Insider: What is Observability?
An Introduction to AWS Monitoring with Prometheus and Logz.io
Prometheus is a widely utilized time-series database for monitoring the health and performance of AWS infrastructure. With its ecosystem of data collection, storage, alerting, and analysis capabilities, among others, the open source tool set offers a complete package of monitoring solutions. Prometheus is ideal for scraping metrics from cloud-native services, storing the data for analysis, and monitoring the data with alerts.
Optimize Application Performance with Code Profiling
When monitoring your application performance or troubleshooting an issue in production, context is key. The more information available, the faster the prevention of or detection of a user impacting issue. Observability tools offer many different features, like code profiling, to help contextualize your data. In this post, I’ll discuss what code profiling is and show an example of how it works.
A Complete Guide to Google's Core Web Vitals and How to Optimize Them
The success of your website lies in how satisfied your users are with it. To help ensure the quality of your user experience, Google uses various signals from a web page. The three Core Web Vitals are some of the most important ones. In this article, I’ll talk about what each Core Web Vital means and how to optimize them to deliver a better user experience.
5 Logstash Alternatives [2023 Review]
When it comes to centralizing logs to Elasticsearch, the first log shipper that comes to mind is Logstash. People hear about it even if it’s not clear what it does: – Bob: I’m looking to aggregate logs – Alice: you mean… like… Logstash? When you get into it, you realize centralizing logs often implies a bunch of things, and Logstash isn’t the only log shipper that fits the bill.
Parsing and enriching log data for troubleshooting in Elastic Observability
In an earlier blog post, Log monitoring and unstructured log data, moving beyond tail -f, we talked about collecting and working with unstructured log data. We learned that it’s very easy to add data to the Elastic Stack. So far the only parsing we did was to extract the timestamp from this data, so older data gets backfilled correctly. We also talked about searching this unstructured data toward the end of the blog.
Custom Preferences in Sematext
Detecting Network Anomalies With Graylog Security
The Hidden Costs of Logging and What can Developers Do About It?
With the growing adoption of remote and distributed application development including micro-services, cloud-native applications, serverless, and more, it is becoming challenging more than ever before for developers to troubleshoot issues within a reasonable time, and that is a bottleneck. That in a sense contradicts the objectives of Agile and DevOps through fast feedback loops, continuous delivery, quick MTTR (mean time to resolution of defects), etc.
Prometheus Roadmap and Latest Updates
We Just celebrated 10 year birthday to Prometheus last month. Prometheus was the second project to join the Cloud Native Computing Foundation after Kubernetes in 2016, and has quickly become the de-facto way to monitor Kubernetes workloads. The plug-and-play experience, just putting Prometheus server and starting to see metrics flowing in tagged with Kubernetes labels, was a compelling offer.
Time Zones: A Logger's Worst Nightmare
When working with log messages, it’s critical that the timestamp of the log message is accurate. Incorrect timestamps can cause problems when trying to find log messages at a specific date/time or may cause alerts to not function properly. A common cause of incorrect timestamps for log messages is a mismatch of time zones between the log source (device sending the log) and log destination (device receiving the log, such as Graylog).
Centralized Logging with Open Source Tools - OpenTelemetry and SigNoz
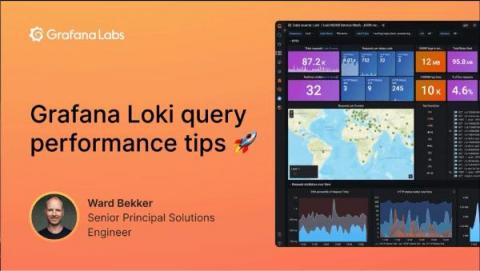
Watch: 5 tips for improving Grafana Loki query performance
Grafana Loki is designed to be cost effective and easy to operate for DevOps and SRE teams, but running queries in Loki can be confusing for those who are new to it. Loki is a horizontally scalable, highly available, multi-tenant log aggregation system inspired by Prometheus. It doesn’t index the content of the logs, but rather a set of labels for each log stream.
Frontend Performance Monitoring: 8 Tools & SaaS to Improve Application and Website User Experience [2023]
Monitoring the performance of an application is not a strange concept to most developers. At one point or another, we’ve all had to do some performance debugging of our own. Usually, it happens when there’s a big issue affecting the user’s experience or cost implications. Only then do we make time to look at how the app performs in different scenarios.
Best Java GC Log Analyzers: Top Analysis Tools You Need to Know in 2023
Table of Contents When an application written for the Java Virtual Machine is running, it constantly creates new objects and puts them on the heap. Well, at least in the vast majority of the cases. Such objects can have a longer or shorter life, but at some point, they stopped being referenced from the code. Unlike languages like C/C++, we don’t have exact control over when the memory will be freed – freeing the memory is the garbage collector’s job.
10 Best Server Performance Monitoring Tools & Software in 2023
Table of Contents Setting up and administering multiple servers for business and application purposes has become easier thanks to advancements in cloud technology. Today, enterprises are choosing to operate large numbers of servers both in the cloud and in their data centers to meet the ever-increasing demand. As a result of these changes, monitoring technologies have become crucial. In this post, we’ll explore the best server monitoring tools and software currently on the market.
How to Deploy a Cribl Stream Leader, Cribl Stream Worker, and Redis Containers via Docker
Configuring Docker Syslog Logging Driver for Docker Dameon & Containers
AWS Lambda in Java 8: examples and instructions
Security Observability Trends for 2023
Split Screen in Sematext | Feature and Product Updates
The Best Infrastructure monitoring tools For 2023
In our latest comparison guide for 2023, we'll cover all of the best IT infrastructure monitoring software that you should consider using to maintain uptime and improve your system’s performance.
Splunk Universal Forwarder: Tips & Resources for Universal Forwarders
Curious about Splunk® Universal Forwarders? This article will sum up what they are, why to use them and how the universal forwarder works. Importantly, we’ll point you to the very best tips, tricks and resources on using universal forwarders (and other ways) to get data into Splunk.
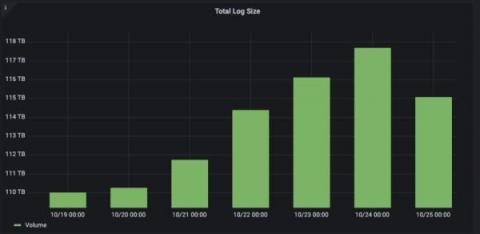
4 billion logs, 120 TB of data: How Just Eat Takeaway.com uses Grafana Cloud to scale
In 2017, Just Eat Takeaway.com (JET) was transitioning from a scrappy startup to a surging scaleup. With a global customer base and workforce, the food delivery marketplace’s front line teams needed to scale the real-time monitoring of the platform. Their initial efforts looked like “NASA’s mission control with Grafana dashboards,” said Senior Technology Manager Alex Murray.
Phantom Metrics: Why Your Monitoring Dashboard May Be Lying to You
Whether you’re a DevOps, SRE, or just a data driven individual, you’re probably addicted to dashboards and metrics. We look at our metrics to see how our system is doing, whether on the infrastructure, the application or the business level. We trust our metrics to show us the status of our system and where it misbehaves. But do our metrics show us what really happened? You’d be surprised how often it’s not the case.
Unreadable Metrics: Why You Can't Find Anything in Your Monitoring Dashboards
Dashboards are powerful tools for monitoring and troubleshooting your system. Too often, however, we run into an incident, jump to the dashboard, just to find ourselves drowning in endless data and unable to find what we need. This could be caused not just by the data overload, but also due to seeing too many or too few colors, inconsistent conventions or the lack of visual cues.


