Operations | Monitoring | ITSM | DevOps | Cloud
March 2023
Cloud Computing: Accelerate with Splunk Cloud Platform
Cloud Migrations with Cribl.Cloud
How do I write a query for log analytics?
What is a log analytics solution? A way to find and fix fast!
Severity Filter With BindPlane OP
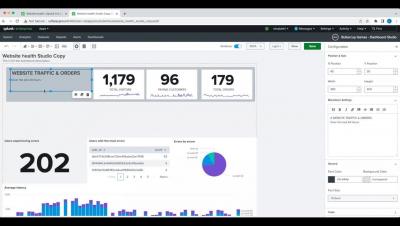
Splunk Dashboard Studio Demo in Splunk 9.0
Building a Distributed Security Team With Cjapi's James Curtis
Four Things That Make Coralogix Unique
SaaS Observability is a busy, competitive marketplace. Alas, it is also a very homogeneous industry. Vendors implement the features that have worked well for their competition, and genuine innovation is rare. At Coralogix, we have no shortage of innovation, so here are four features of Coralogix that nobody else in the observability world has.
Data Centers: The Ultimate Guide To Data Center Cooling & Energy Optimization
A Fireside Chat with CNCF's CTO on OpenTelemetry (and More!)
KubeCon Europe 2023 will be held in Amsterdam in April, with many exciting updates and discussions to come around projects from the Cloud Native Computing Foundation (CNCF). That’s why I was thrilled to host Chris Aniszczyk, the CTO of the CNCF on the March 2023 episode of OpenObservability Talks. We had a wide-ranging, free-flowing conversation that touched on all things cloud native, observability and the future of our space.
Create a Log Type and associate it with a Log Profile
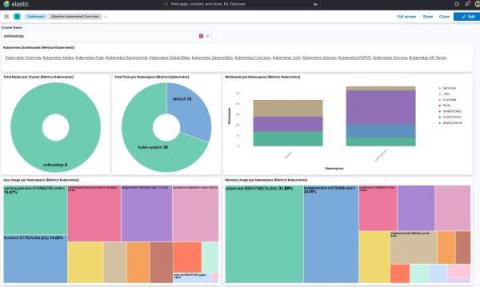
Elastic Observability 8.7: Enhanced observability for synthetic monitoring, serverless functions, and Kubernetes
Elastic Observability 8.7 introduces new capabilities that drive efficiency into the management and use of synthetic monitoring and expand visibility into serverless applications and Kubernetes deployments. These new features allow customers to: Observability 8.7 is available now on Elastic Cloud — the only hosted Elasticsearch offering to include all of the new features in this latest release.
geeks+gurus: Centralizing Log Management & Tool Consolidation
Log Analytics pricing
4 Challenges of Serverless Log Management in AWS
Serverless services on AWS allow IT and DevSecOps teams to deploy code, store and manage data, or integrate applications in the cloud, without the need to manage underlying servers, operating systems, or software. Serverless computing on AWS eliminates infrastructure management tasks, helping IT teams stay agile and reducing their operational costs - but it also introduces the new challenge of serverless log management.
Splunk Open Source: What To Know
Financial Services Predictions - the highlights for 2023: Two trends, two actions and a honest take on financial services hype.
Trust, understanding, and love
Integrating OpenTelemetry into a Fluentbit environment using BindPlane OP
Mask PII Data With BindPlane
Mean Time to Acknowledge (MTTA): What It Means & How To Improve MTTA
What are the benefits of log management?
Long-Term Storage: Coralogix vs. DataDog
Long-term storage, especially for logs, is essential to any modern observability provider. Each vendor has their own method for handling this problem. While there are numerous available solutions, let’s explore just one – DataDog – and see the benefits and limitations.
Elastic Observability: Built for open technologies like Kubernetes, OpenTelemetry, Prometheus, Istio, and more
As an operations engineer (SRE, IT Operations, DevOps), managing technology and data sprawl is an ongoing challenge. Cloud Native Computing Foundation (CNCF) projects are helping minimize sprawl and standardize technology and data, from Kubernetes, OpenTelemetry, Prometheus, Istio, and more. Kubernetes and OpenTelemetry are becoming the de facto standard for deploying and monitoring a cloud native application.
Reduce compliance TCO by using Grafana Loki for non-SIEM logs
Compliance is a term commonly associated with heavily regulated industries such as finance, healthcare, and telecommunication. But in reality, it touches nearly every business today as governments and other regulatory agencies seek to enact tighter controls over the use of our collective digital footprint. As a result, more and more companies need to retain a record of every single digital transaction under their control.
Best Practices for SOC Tooling Acquisition
Your Security Operations Center (SOC) faces complex challenges for keeping corporate data safe and in the right hands everyday. The right tooling is critical for success. Deciding when—and how—to make investments in SOC tooling is complex and challenging across organizations. There’s a ton of vendor spin out there and it’s important to understand what’s real and what isn’t.
ChatGPT praise and trepidation - cyber defense in the age of AI
What is a log management tool?
What is log management, and why is it important?
Data Denormalization: Pros, Cons & Techniques for Denormalizing Data
Reference Architecture Series: Scaling Syslog
Kibana Demo of Hexagonal Clusters
What is SRE? Explained in 6 minutes
Data lake vs. data mesh: Which one is right for you?
The future of observability: Trends and predictions business leaders should plan for in 2023 and beyond
If the past year has taught us anything, it’s that the more things change, the more things stay the same. The whiplash and pivot from the go-go economy post-pandemic to a belt-tightening macroeconomic environment induced by higher inflation and interest rates has been seen before, but rarely this quickly. Technology leaders have always had to do more with less, but this slowdown may be unpredictable, longer, and more pronounced than expected.
Ingesting and managing your Nginx Logs in Elastic
The Splunk Immersive Experience powered by AWS is here!
User Experience Monitoring with Elastic Observability Synthetics
ElasticON Global 2023 Keynote: What's Next? With Elastic CPO Ken Exner
Introducing AppSignal Logging
We're excited to announce AppSignal Log Management, a straightforward solution for ingesting and analyzing your logs. AppSignal is designed to be intuitive and help you get the most out of your application's monitoring data. Here's what you'll get with our logging solution.
Public Sector Predictions - the highlights for 2023 and two challenges that the public sector faces
Cloud Migration is hard especially in the public sector, but there is a way
Splunk Observability in Less Than 2 Minutes
Five Things to Know About Google Cloud Operations Suite and BindPlane
Is Managed Prometheus Right For You?
Prometheus is the de facto open-source solution for collecting and monitoring metrics data. Its straightforward architecture, operational reliability, minimal upfront cost, and versatility in integrating with cloud-native systems make it the preferred choice for many. Getting started is as simple as configuring the Prometheus server and setting simple parameters such as the scrape intervals and targets, cadence, and setting the job name based on the function of the server.
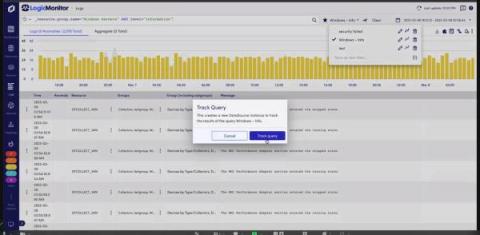
LM Logs query tracking: find what's relevant now to prepare for tomorrow
Transforming Your Data With Telemetry Pipelines
Telemetry pipelines are a modern approach to monitoring and analyzing systems that collect, process, and analyze data from different sources (like metrics, traces, and logs). They are designed to provide a comprehensive view of the system’s behavior and identify issues quickly. Data transformation is a key aspect of telemetry pipelines, as it allows for the modification and shaping of data in order to make it more useful for monitoring and analysis.
Customer Insights: The journey to Open Telemetry
Monitoring Android applications with Elastic APM
People are handling more and more matters on their smartphones through mobile apps both privately and professionally. With thousands or even millions of users, ensuring great performance and reliability is a key challenge for providers and operators of mobile apps and related backend services.
Observing an application with Elastic Observability APM
Easily configure Elastic to ingest OpenTelemetry data
SaaS Observability Platforms: A Buyer's Guide
Observability is the ability to gather data from metrics, logs, traces, and other sources, and use that data to form a complete picture of a system’s behavior, performance, and health. While monitoring alone was once the go-to approach for managing IT infrastructure, observability goes further, allowing IT teams to detect and understand unexpected or unknown events.
Splunk Data Insider: What is Edge Computing?
Coralogix Deep Dive - Loggregation, Features and Limitations
3 Effective Tips for Cloud-Native Compliance
Building Resilience With the Splunk Platform One Use Case at a Time
How I used Graylog to Fix my Internet Connection
In today’s digital age, the internet has become an integral part of our daily lives. From working remotely to streaming movies, we rely on the internet for almost everything. However, slow internet speeds can be frustrating and can significantly affect our productivity and entertainment. Despite advancements in technology, many people continue to face challenges with their internet speeds, hindering their ability to fully utilize the benefits of the internet.
First Input Delay (FID) Explained in 4 Minutes
Amazon Linux 2023: Why we're moving to AL2023
Amazon Web Services (AWS) recently announced the release of Amazon Linux 2023 (AL2023) as the next generation of Amazon Linux with enhancements to its already-proven reliability. Besides offering frequent updates and long-term support, AL2023 provides a predictable release cadence, flexibility, and control over new versions. It also eliminates the operational overhead that comes with creating custom policies to meet standard compliance requirements.
Centralized Log Management Best Practices and Tools
Centralized logging is a critical component of observability into modern infrastructure and applications. Without it, it can be difficult to diagnose problems and understand user journeys—leaving engineers blind to production incidents or interrupted customer experiences. Alternatively, when the right engineers can access the right log data at the right time, they can quickly gain a better understanding of how their services are performing and troubleshoot problems faster.
Server Monitoring Best Practices: 9 Tips to Improve Health and Performance
Businesses that have mission-critical applications deployed on servers often have operations teams dedicated to monitoring, maintaining, and ensuring the health and performance of these servers. Having a server monitoring system in place is critical, as well as monitoring the right parameters and following best practices. In this article, I’ll look at the key server monitoring best practices you should incorporate into your operations team’s processes to eliminate downtime.
Retry Dynamic Imports with "React.lazy"
In the modern web, code splitting is essential. You want to keep your app slim, with a small bundle size, while having “First Contentful Paint” as fast as possible. But what happens when a dynamic module fails to fetch? In this short article, we’ll see how to overcome such difficulties.
Using Elastic to observe GKE Autopilot clusters
Elastic Agent provides a new observability option for fully managed GKE clusters
Deploy Open Telemetry to Kubernetes in 5 minutes
OpenTelemetry is an open-source observability framework that provides a vendor-neutral and language-agnostic way to collect and analyze telemetry data. This tutorial will show you how to integrate OpenTelemetry on Kubernetes, a popular container orchestration platform. Prerequisites.
Embrace the Chaos
Predictions: a Deeper Dive into the Rise of the Machines
A Guide to Enterprise Observability Strategy
Observability is a critical step for digital transformation and cloud journeys. Any enterprise building applications and delivering them to customers is on the hook to keep those applications running smoothly to ensure seamless digital experiences. To gain visibility into a system’s health and performance, there is no real alternative to observability. The stakes are high for getting observability right — poor digital experiences can damage reputations and prevent revenue generation.
What To Do When Elasticsearch Data Is Not Spreading Equally Between Nodes
Elasticsearch (ES) is a powerful tool offering multiple search, content, and analytics capabilities. You can extend its capacity and relatively quickly horizontally scale the cluster by adding more nodes. When data is indexed in some Elasticsearch index, the index is not typically placed in one node but is spread across different nodes such that each node contains a “shard” of the index data. The shard (called primary shard) is replicated across the cluster into several replicas.
Key Elastic Dev Commands for Troubleshooting Disk Issues
Disk-related issues with Elasticsearch can present themselves through various symptoms. It is important to understand their root causes and know how to deal with them when they arise. As an Elasticsearch cluster administrator, you are likely to encounter some of the following cluster symptoms.
Audit Logging 101: Everything To Know About Audit Logs & Trails
Log Aggregation: Everything You Need to Know for Aggregating Log Data
Beyond Logging: The Power of Observability in Modern Systems
Getting started with Elastic Observability for Google Cloud in less than 10 min using terraform
Empowering Security Observability: Solving Common Struggles for SOC Analysts and Security Engineers
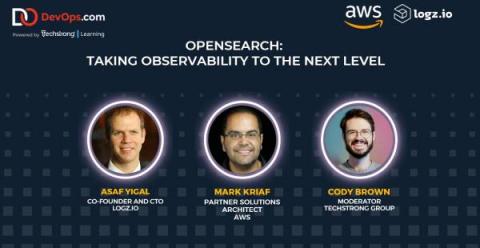
OpenSearch and Logz.io - Taking Observability to the Next Level
If you’re in the cloud engineering and DevOps space, you’ve probably seen the name OpenSearch a lot over the last couple of years. But, what is your current understanding of OpenSearch, and the components around it? Let’s take a closer look.
Splunk's Purpose
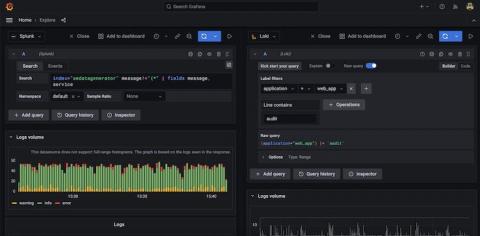
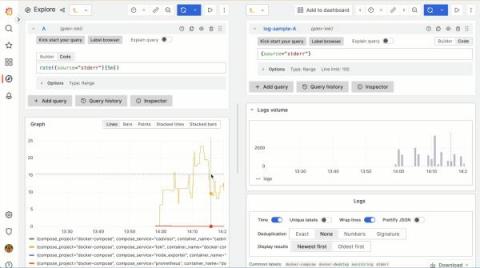
Write Loki queries easier with Grafana 9.4: Query validation, improved autocomplete, and more
At the beginning of every successful data exploration journey, a query is constructed. So, with this latest Grafana release, we are proud to introduce several new features aimed at improving the Grafana Loki querying experience. From query expression validation to seeing the query history in code editor and more, these updates are sure to make querying in Grafana even more efficient and intuitive, saving you time and frustration.
Ingesting Google Cloud Audit Logs Into Graylog
We will focus on the audit logging of Google cloud itself, however, the input supports the below sources when it refers to Google Cloud Logs.
Tips and best practices for Docker container management
How Can You Optimize Business Cost and Performance With Observability?
Businesses are increasingly adopting distributed microservices to build and deploy applications. Microservices directly streamline the production time from development to deployment; thus, businesses can scale faster. However, with the increasing complexity of distributed services comes visual opacity of your systems across the company. In other words, the more complex your system gets, the harder it becomes to visualize how it works and how individual resources are allocated.
Coralogix Deep Dive - How to Save Between 40-70% with the TCO Optimizer
Coralogix Deep Dive - Lambda Telemetry Exporter
Java Logging Frameworks Comparison: Log4j vs Logback vs Log4j2 vs SLF4j Differences
Any software application or a system can have bugs and issues in testing or production environments. Therefore, logging is essential to help troubleshoot issues easily and introduce fixes on time. However, logging is useful only if it provides the required information from the log messages without adversely impacting the system’s performance. Traditionally, implementing logging that satisfies these criteria in Java applications was a tedious process.
Analyze causal relationships and latencies across your distributed systems with Log Transaction Queries
Modern, high-scale applications can generate hundreds of millions of logs per day. Each log provides point-in-time insights into the state of the services and systems that emitted it. But logs are not created in isolation. Each log event represents a small, sequential step in a larger story, such as a user request, database restart process, or CI/CD pipeline.
6 Steps to Implementing a Telemetry Pipeline
Observability has become a critical part of the digital economy and software engineering, enabling teams to monitor and troubleshoot their applications in real-time. Properly managing logs, metrics, traces, and events generated from your applications and infrastructure is critical for observability. A telemetry pipeline can help you gather data from different sources, process it, and turn it into meaningful insights.
FULL EKS & Kubernetes Debugging Journey with Coralogix
First Steps to Building the Ultimate Monitoring Dashboards in Logz.io
Cloud infrastructure and application monitoring dashboards are critical to gaining visibility into the health and performance of your system. But what are the best metrics to monitor? What are the best types of visualizations to monitor them? How can you ensure your alerts are actionable? We answered these questions on our webinar Build the Ultimate Cloud Monitoring Dashboard.
Analyzing Heroku Router Logs with Papertrail
Best Apache Solr Tips and Tricks. Ep.01 #shorts #solr #devops
Event Breakers in Cribl Stream
Common Event Format (CEF): An Introduction
10+ Best Status Page Tools: Free, Open source & Paid [2023 Comparison]
Communication with our users is very important. You want them to be aware of the new features that your platform exposes, exciting news about the company, but also about the status of the services that you are building for them. This includes information about all the functionalities and the infrastructure and applications behind them – when they work correctly and efficiently and when they don’t.
Kubernetes Logging
You'll notice that monitoring and logging don't appear on the list of core Kubernetes features. However, this is not due to the fact that Kubernetes does not offer any sort of logging or monitoring functionality at all. It does, but it’s complicated. Kubernetes’ kubectl tells us all about the status of the different objects in a cluster and creates logs for certain types of files. But ideally speaking, you won't find a native logging solution embedded in Kubernetes.
What is syslog?
How to Use Operational IT Data for PLG
Victory over the universe: managing chaos, achieving reliability
Data Analytics 101: The 4 Types of Data Analytics Your Business Needs
Python Logging Tutorial: How-To, Basic Examples & Best Practices
Logging is the process of keeping records of activities and data of a software program. It is an important aspect of developing, debugging, and running software solutions as it helps developers track their program, better understand the flow and discover unexpected scenarios and problems. The log records are extremely helpful in scenarios where a developer has to debug or maintain another developer’s code.
How Splunk Users can Maximize Investment with CloudFabrix Log Intelligence
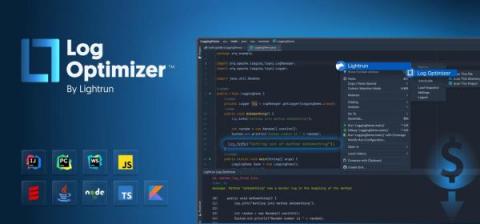
Reduce 60% of your Logging Volume, and Save 40% of your Logging Costs with Lightrun Log Optimizer
As organizations are adopting more of the FinOps foundation practices and trying to optimize their cloud-computing costs, engineering plays an imperative role in that maturity. Traditional troubleshooting of applications nowadays relies heavily on static logs and legacy telemetry that developers added either when first writing their applications, or whenever they run a troubleshooting session where they lack telemetry and need to add more logs in an ad-hoc fashion.
How Monitoring, Observability & Telemetry Come Together for Business Resilience
Suffering from high log costs? Too much log noise? Finally, a solution for both.
IT outage times are rapidly increasing as businesses modernize to meet the needs of remote workers, accelerate their digitalization transformations, and adopt new microservices-based architectures and platforms. Research shows that mean time to recovery (MTTR) is ramping up, and it now takes organizations an average of 11.2 hours to find and resolve an outage after it’s reported—an increase of nearly two hours since just 2020.


