Operations | Monitoring | ITSM | DevOps | Cloud
April 2023
What is Platform Engineering and Why Does It Matter?
In the era of cloud-native development, as businesses rely on a growing number of software tools to enable agile application delivery, platform engineering has emerged as a crucial discipline for building the technology platforms that drive DevOps efficiency. In this blog post, we explain the growing importance of platform engineering in high-performance DevOps organizations and how platform teams enable DevOps efficiency, agility, and productivity.
Technical Education Can Drive Long Term Success for Organizations
Root cause analysis with logs: Elastic Observability's AIOps Labs
In the previous blog in our root cause analysis with logs series, we explored how to analyze logs in Elastic Observability with Elastic’s anomaly detection and log categorization capabilities. Elastic’s platform enables you to get started on machine learning (ML) quickly. You don’t need to have a data science team or design a system architecture. Additionally, there’s no need to move data to a third-party framework for model training.
Cloud Computing: Splunk Cloud Migration Benefits
Data-Driven Decision Making: Leveraging Metrics and Logs-to-Metrics Processors
In modern business environments, where everything is fast-paced and data-centric, companies need to be able to track and analyze data quickly and efficiently to stay competitive. Metrics play a crucial role in this, providing valuable insights into product performance, user behavior, and system health. By tracking metrics, companies can make data-driven decisions to improve their product and grow their business.
5 Ways to Use Log Analytics and Telemetry Data for Fraud Prevention
Coralogix Deep Dive - Tracking Every Interaction with Tracing and APM
Enriching and troubleshooting logs with Elastic Observability
Log monitoring and unstructured log data, moving beyond tail -f
Live from KubeCon: Insider Insights with CNCF's Head of Ecosystem
We’ve just recently completed KubeCon + CloudNativeCon Europe 2023 in Amsterdam, one of the signature events of the year in the cloud native, open source and observability spaces. I was thrilled to be joined by Taylor Dolezal, the Head of Ecosystem for the hosting Cloud Native Computing Foundation (CNCF) to discuss the insider happenings of KubeCon EU live from Amsterdam for the April 2023 OpenObservability Talks podcast.
Tool Consolidation: Best Practices for Content Migration
Coralogix Deep Dive - ML Driven Log Clustering with Loggregation
What is Windows Event Log?
Event logging for Microsoft Windows provides a standard, centralized way for applications and the operating system to record important software and hardware events. The event-logging service (eventlog) stores events from various sources in a single collection called an event log. The system administrator can use the event log to help determine what conditions caused the error and the context in which it occurred. TechTarget have an excellent overview of Windows event logs available.
The Best Data Science & Data Analytics Certifications for 2023: Beginner To Advanced
The Mezmo Telemetry Pipeline Product Tour
Mezmo Telemetry Pipeline helps organizations Ingest, transform, and route telemetry data to control costs and drive actionability. Modern organizations are adopting telemetry pipelines to manage challenges with telemetry data (logs, metrics, traces, events) growth and to get the most value from their data investments.
What Customers are Saying About Cribl Stream on Gartner Peer Insights
Since day one, Cribl has been on a mission to give users more control and more value from their observability and security data. We had a feeling that putting customers first would be the key to unlocking that value, so “Customers First, Always” went at the top of the list when the time came to talk about company values.
Getting Started with Splunk Mission Control
Gaming Industry: How Important are Logs for Systems?
In today’s fast-paced and highly-competitive gaming industry, providing a seamless and enjoyable gaming experience is essential to retain users. Games need to be responsive, offer high-resolution graphics, continuous uptime, and handle a huge amount of transactions. Having strong log analytics solution is essential to improve performance, identify issues, and fine-tune the player experience.
Supercharging Grafana with the Power of Telemetry Pipelines
Grafana is a popular open-source tool for visualizing and analyzing data from various sources. It provides a platform for creating interactive, customizable dashboards that display real-time data in various formats, including graphs, tables, and alerts. When powered by Mezmo's Telemetry Pipeline, Grafana can access a wide range of data sources and provide a unified view of the performance and behavior of complex systems.
Supercharging Elasticsearch with the Power of Telemetry Pipelines
Elasticsearch has made a name for itself as a powerful, scalable, and easy-to-use search and analytics engine, enabling organizations to derive valuable insights from their data in real-time. However, to truly unlock the potential of Elasticsearch, it is essential that the right data in the right format is provisioned to Elasticsearch. This is where integrating a telemetry pipeline can add value to Elasticsearch.
Find connections and expand your data visualization with new dashboards
7 Quick Tips for Working with Traces in OpenTelemetry
Avoiding vendor lock-in is a ‘must’ when it comes to working with new services. Those in ITOps, DevOps, or as an SRE also don’t want to be tied to specific vendors when it comes to their telemetry data. And that’s why OpenTelemetry’s popularity has surged lately. OpenTelemetry prevents you from being locked into specific vendors for the agents that collect your data.
Log Shippers: The Key to Efficient Log Management
Logs are a vital source of information for any system, providing valuable insights into its performance and behaviour. However, with the increasing complexity of modern systems and the massive amount of data generated by them, managing logs can be a daunting task. This is where log shippers come into play. Log shippers are tools designed to simplify the process of collecting and forwarding log data to a centralized location, allowing for easy analysis and troubleshooting.
The Latest Version of OpenSearch Is Now Live On Logit.io
Logit.io is pleased to introduce the latest version of OpenSearch onto the platform, with an OpenTelemetry-compliant data schema that unlocks a host of future analytics and observability capabilities. Also included in this release are improvements in threat detection for security analytics workloads, visualization tools, and machine learning (ML) models.
Monitoring service performance: An overview of SLA calculation for Elastic Observability
Elastic Stack provides many valuable insights for different users. Developers are interested in low-level metrics and debugging information. SREs are interested in seeing everything at once and identifying where the root cause is. Managers want reports that tell them how good service performance is and if the service level agreement (SLA) is met. In this post, we’ll focus on the service perspective and provide an overview of calculating an SLA.
Introducing CrowdStream: A New Native CrowdStrike Falcon Platform Capability Powered by Cribl
We’re excited to announce an expanded partnership with CrowdStrike and introduce CrowdStream, a powerful new native platform capability that enables customers to seamlessly connect any data source to the CrowdStrike Falcon platform.
What is FID? Explained in 60 seconds
Getting Data In: 4 Ways to Ingest Data into Splunk
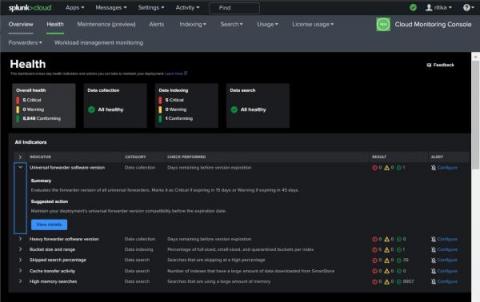
Cloud Monitoring Console's Health Dashboard: Maximize Your Monitoring Efficiency
How the All-In Comprehensive Design Fits into the Cribl Stream Reference Architecture
Head in the Clouds: Innovate And Grow At The Speed of Cloud
How to Mask Sensitive Data in Logs with BindPlane OP Enterprise
Adding a Log Record Attribute
How an Observability Pipeline Can Help With Cloud Migration
Do you want to confidently move workloads to the cloud without dropping or losing data? Of course, everyone does. But easier said than done. Cloud migration is tricky. There’s so much to think through and so much to worry about — how can you reconfigure architectures and data flows to ensure parity and visibility? How do you know the data in transit is safe and secure? How can you get your job done without getting in trouble with procurement?
The Evils of Data Debt With Ed and Jackie
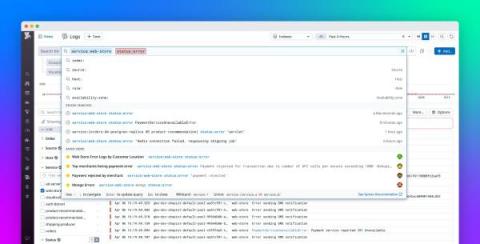
Search your logs efficiently with Datadog Log Management
In any type of organization and at any scale, logs are essential to a comprehensive monitoring stack. They provide granular, point-in-time insights into the health, security, and performance of your whole environment, making them critical for key workflows such as incident response, security investigations, auditing, and performance analysis. Many organizations generate millions (or even billions) of log events across their tech stack every day.
DevOps vs. SRE
Retrace Logging Benefits
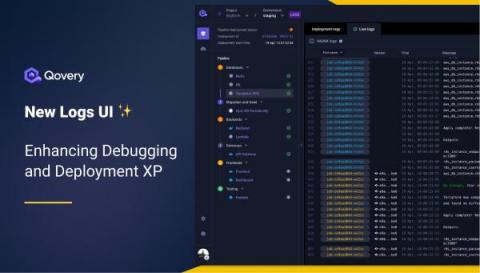
New Logs Interface: Enhancing Debugging and Deployment Experience
Cribl Makes Open Observability a Reality
DevOps Pulse 2023: Increased MTTR and Cloud Complexity
Evolving DevOps maturity, mounting Mean-Time-to-Recovery (MTTR), and perplexing cloud environments – all these factors are shaping modern observability practices according to approximately 500 observability practitioners. While every organization faces its unique challenges, there are broadly impactful trends that arise.
Increasing Implications: Adding Security Analysis to Kubernetes 360 Platform
A quick look at headlines emanating from this year’s sold out KubeCon + CloudNativeCon Europe underlines the fact that Kubernetes security has risen to the fore among practitioners and vendors alike. As is typically the case with our favorite technologies, we’ve reached that point where people are determined to ensure security measures aren’t “tacked on after the fact” as related to the wildly-popular container orchestration system.
Elastic Common Schema and OpenTelemetry - A path to better observability and security with no vendor lock-in
At KubeCon Europe, it was announced that Elastic Common Schema (ECS) has been accepted by OpenTelemetry (OTel) as a contribution to the project. The goal is to achieve convergence of ECS and OpenTelemetry’s Semantic Conventions (SemConv) into a single open schema that is maintained by OpenTelemetry. This FAQ details Elastic’s contribution of Elastic Common Schema to OpenTelemetry, how it will help drive the industry to a common schema, and its impact on observability and security.
The Three Pillars of Observability: Metrics, Logs and Traces
Metrics, Logs and Traces are often referred to as The Three Pillars of “Observability“. The term observability has been used in control theory to refer to how the state of a system can be inferred from the system’s external outputs. Applied to IT, observability is how the current state of an application can be assessed based on the data it generates. Applications and the IT components they use provide outputs in the form of metrics, events, logs and traces (MELT).
Optimize your CI/CD Pipeline with Coralogix Tagging
Continuous Integration/Continuous Delivery (CI/CD) has now become the de-facto standard for all engineering teams seeking to keep pace with the demands of the modern economy. At Coralogix, we operate some of the most advanced build and deploy pipelines in the world. We’ve baked that knowledge into our platform with a CI/CD Observability feature called Coralogix Tagging.
Rest Assured, Cribl's Improved Webhook Can Now Write to Microsoft Sentinel
As version 4.0.4, we are excited to announce the capability of Cribl’s webhook to write to any destinations and APIs that requires OAuth including Microsoft Sentinel. Cribl has long supported OAuth in many destinations through native integrations but with the enhanced Webhook we can now write to any destination that require OAuth authentication.
What is SRE?
Now you can forward logs to external endpoints from within the Console!
Our aim, like always, is to help users thrive. We want them to receive real value from all that we deliver through our various features. And it’s equally important to offer flexibility by providing all different ways to use those features. This way, you’re free to use the feature in the way that's most convenient. Driving this vision of ours, well, forward, we have now extended our Logs Forwarding experience from CLI to within the Console.
Plan better and preempt bottlenecks with predict for metrics
OpenTelemetry-powered infrastructure monitoring: isolate and fix issues in minutes
Cloud Computing: How To Secure The Cloud With Splunk
Reducing Your Splunk Bill With Telemetry Pipelines
With 85 of their customers listed among the Fortune 100 companies, Splunk is undoubtedly one the leading machine data platforms on the market. In addition to its core capability of consuming unstructured data, Splunk is one of the top SIEMs on the market. Splunk, however, costs a fortune to operate – and those costs will only increase as data volumes grow over the years. Due to these growing pains, technologies have emerged to control the increasing costs of using Splunk.
Optimizing Your Splunk Experience with Telemetry Pipelines
When it comes to handling and deriving insights from massive volumes of data, Splunk is a force to be reckoned with. Its ability to index, search, and analyze machine-generated data has made it an essential tool for organizations seeking actionable intelligence. However, as the volume and complexity of data continue to grow, optimizing the Splunk experience becomes increasingly important. This is where the power of telemetry pipelines, like Mezmo, comes into play.
How to Build a Culture of Data-Driven Product Management
Sumo Logic Brown Bag Session: Tips & Tricks on Creating Log Searches
Securely Connecting an Amazon S3 Destination to Cribl.Cloud and Hybrid Workers
There are several reasons you may want to route to Amazon S3 destinations, including routing to object storage for archival, routing to S3 buckets to utilize Cribl.Cloud’s Search feature, and archiving data that can be replayed later. When setting up Amazon S3 destinations in Cribl, there are three authentication methods: Auto, Manual, and Secret. Using the Auto authentication method paired with Assume Role is the most secure way to connect Amazon S3 to Cribl.
Log Less, Achieve More: A Guide to Streamlining Your Logs
Businesses are generating vast amounts of data from various sources, including applications, servers, and networks. As the volume and complexity of this data continue to grow, it becomes increasingly challenging to manage and analyze it effectively. Centralized logging is a powerful solution to this problem, providing a single, unified location for collecting, storing, and analyzing log data from across an organization’s IT infrastructure.
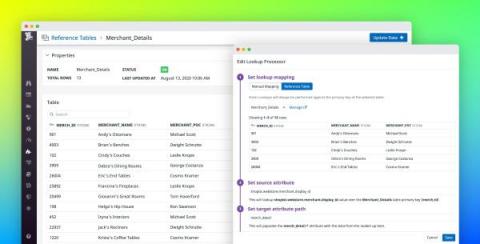
Add more context to your logs with Reference Tables
Logs provide valuable information for troubleshooting application performance issues. But as your application scales and generates more logs, sifting through them becomes more difficult. Your logs may not provide enough context or human-readable data for understanding and resolving an issue, or you may need more information to help you interpret the IDs or error codes that application services log by default.
Tracing Services Using OTel and Jaeger
Log Analytics: Everything To Know About Analyzing Log Data
Get a Sneak Peek with Operator Preview in Cribl Search
At Cribl, we understand precisely what challenges our customers face when running complex searches, and the importance of getting exactly what they need with their queries. Cribl Search’s latest feature, Operator Preview, allows data analysts to test search operators without committing to a full search. It saves time, reduces costs, and streamlines your everyday data analysis.
Log Management in the Age of Observability
How to collect and query Kubernetes logs with Grafana Loki, Grafana, and Grafana Agent
Logging in Kubernetes can help you track the health of your cluster and its applications. Logs can be used to identify and debug any issues that occur. Logging can also be used to gain insights into application and system performance. Moreover, collecting and analyzing application and cluster logs can help identify bottlenecks and optimize your deployment for better performance.
The Digital Resilience Guide: 7 Steps To Building Digital Resilience
4 CDN Monitoring Tools to Look At
Beyond their primary function of bringing internet content closer to client servers, CDNs also play a vital role in network security. For instance, CDN helps you absorb traffic overloads from DDoS attacks by distributing traffic across many servers. However, the volume of servers under your CDNs control and their geographically distributed nature presents its own set of risks, operational and security. Choosing the best CDN monitoring tool is critical to the end-user experience.
Even faster 3 am troubleshooting with new logs search and query
How to Reduce Duplicate Log Data with BindPlane OP
Cribl Reference Architecture Series: Scaling Effectively for a High Volume of Agents
10+ Best Tools & Systems for Monitoring Ubuntu Server Performance [2023 Comparison]
Ubuntu is a Linux distribution based on Debian Linux that’s mostly composed of open-source and free software. Released in three options – servers, desktop computers and Internet of Things devices. Ubuntu is highly popular, reliable and updated every 6 months, with a long-term support version released every two years. Multiple Ubuntu versions allow users to choose whether to stick with the long-term support version or the recently updated one.
Cloud Computing: Splunk Cloud Migration 101
Data Streaming in 2023: The Ultimate Guide
Micro Lesson: Tool Consolidation Overview
Why Log Analytics is Key to Unlocking the Value of XDR for Enterprises
Google Cloud Platform (GCP) App Template
Webinar Recap: Unlocking Business Performance with Telemetry Data
Telemetry data can provide businesses with valuable insights into how their applications and systems are performing. However, leveraging this data optimally can be a challenge due to data quality issues and limited resources. Our recent webinar, "Unlocking Business Performance with Telemetry Data", addresses this challenge.
Implementing a log management program: What is best to start with?
Troubleshoot faster and modernize your apps with AWS Monitoring and Observability
OpenTelemetry: Why community and conversation are foundational to this open standard
What are the best practices for log management?
Grafana Loki 2.8 release: TSDB GA, LogQL enhancements, and a third target for scalable mode
Grafana Loki 2.8 is here — and it’s at least 0.1 better than Loki 2.7! Jokes aside, this release includes a number of improvements users will appreciate. In addition to graduating our TSDB index from Experimental to General Availability, we’ve added a number of nifty LogQL features, and we’ve made the Loki deployment and management experience much easier. This also marks the release of Grafana Enterprise Logs (GEL) 1.7.
What to Expect When You Are Expecting: Cribl Data Routed to a Cribl Destination
For so many, the unknown sucks. Knowing or knowing what to expect is best. Why? Because it puts us at ease, and peace and gives us a calm sense of knowing without having experienced it yet. That’s part of my mission here at Cribl. I talk to a lot of people and the one consistent part of these conversations is the unknown.
Coralogix vs. Sumo Logic: Support, Pricing, Features & More
Sumo Logic has been a staple of the observability industry for years. Let’s look at some key measurements when comparing Coralogix vs. Sumo Logic, to see where customers stand when choosing their favorite provider.
How to Monitor Cloudflare with OpenTelemetry
Using Elastic Anomaly detection and log categorization for root cause analysis
Revolutionize Your Observability Data with Cribl.Cloud - Streamline Your Infrastructure Hassle-Free!
Ship OpenTelemetry Data to Coralogix via Reverse Proxy (Caddy 2)
It is commonplace for organizations to restrict their IT systems from having direct or unsolicited access to external networks or the Internet, with network proxies serving as gatekeepers between an organization’s internal infrastructure and any external network. Network proxies can provide security and infrastructure admins the ability to specify specific points of data egress from their internal networks, often referred to as an egress controller.
Getting Started with Logz.io Cloud SIEM
The shortcoming of traditional SIEM implementations can be traced back to big data analytics challenges. Fast analysis requires centralizing huge amounts of security event data in one place. As a result, many strained SIEM deployments can feel heavy, require hours of configuration, and return slow queries. Logz.io Cloud SIEM was designed as a scalable, low-maintenance, and reliable alternative. As a result, getting started isn’t particularly hard.
Monitor OpenAI API and GPT models with OpenTelemetry and Elastic
ChatGPT is so hot right now, it broke the internet. As an avid user of ChatGPT and a developer of ChatGPT applications, I am incredibly excited by the possibilities of this technology. What I see happening is that there will be exponential growth of ChatGPT-based solutions, and people are going to need to monitor those solutions.
What is Generative AI? ChatGPT & Other AIs Transforming Creativity and Innovation
Serverless Architecture Explained: Easier, Cheaper, FaaS vs BaaS & Evolving Compute Needs
Managing business objectives with Elastic Observability Anomaly detection
Monitoring and troubleshooting - Apache error log file analysis
What is log management in DevOps?
What is log management in security?
What is log management used for?
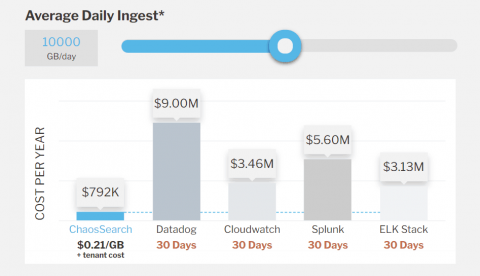
ChaosSearch Pricing Models Explained
How to Cut Through SIEM Vendor Nonsense
If you’re in need of new SIEM tooling, it can be more complicated than ever to separate what’s real and what’s spin. Yes, Logz.io is a SIEM vendor. But we have people in our organization with years of cybersecurity experience, and they wanted to share thoughts on how best to address the current market. Our own Matt Hines and Eric Thomas recently hosted a webinar running through what to look out for titled: Keep it SIEM-ple: Debunking Vendor Nonsense. Watch the replay below.
How to monitor Kafka and Confluent Cloud with Elastic Observability
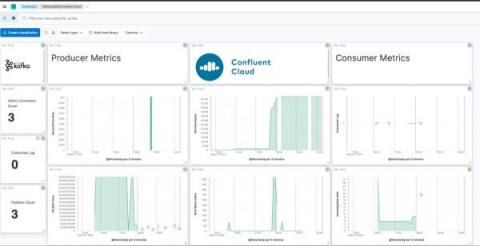
The blog will take you through best practices to observe Kafka-based solutions implemented on Confluent Cloud with Elastic Observability. (To monitor Kafka brokers that are not in Confluent Cloud, I recommend checking out this blog.) We will instrument Kafka applications with Elastic APM, use the Confluent Cloud metrics endpoint to get data about brokers, and pull it all together with a unified Kafka and Confluent Cloud monitoring dashboard in Elastic Observability.
Platform Engineering 101: Origins, Goals, DevOps vs SRE & Best Practices
Reduce time to detect with AppDynamics Cloud Log Analytics
How machine learning in AppDynamics Cloud accelerates log analysis and reduces mean time to detect. Site recovery engineers (SREs) need to investigate unknown problems reported in production. The common approach is to search and filter log files to find the root cause, and we all know how painful it is to sift through log contents. It’s like finding a needle in a haystack. A machine learning approach is essential to assist SREs to quickly identify the root cause.
Enhancing Datadog Observability with Telemetry Pipelines
Datadog is a powerful observability platform. However, unlocking it’s full potential while managing costs necessitates more than just utilizing its platform, no matter how powerful it may be. It requires a strategic approach to data management. Enter telemetry pipelines, a key to elevating your Datadog experience. Telemetry pipelines offer a toolkit to achieve the essential steps for maximizing the value of your observability investment. The Mezmo Telemetry Pipeline is a great example of such.


