Operations | Monitoring | ITSM | DevOps | Cloud

January 2024

Understanding Syslog Formats: A Comprehensive Guide

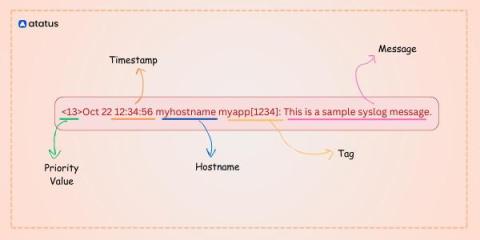
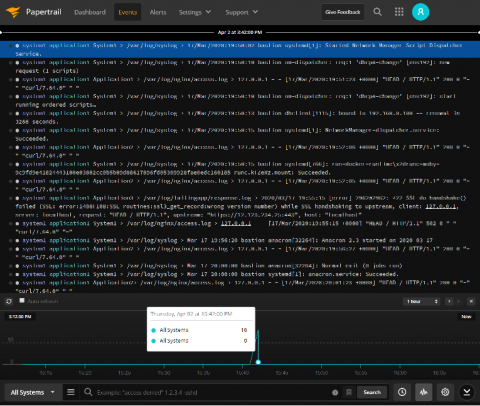
Syslog, short for System Logging Protocol, is a standard protocol used to send log messages and event notifications across a network. It plays a crucial role in monitoring and managing the health, performance, and security of systems and applications. Syslog was originally developed as a part of the BSD operating system, but many other operating systems and network devices have since adopted it. One of the key aspects of syslog is its flexible and standardized message formats.

Mastering the Cloud Migration: The Ultimate Guide to Cloud Migration Tools

Clouds aren’t magical data farms in the sky; they’re the backbone of modern infrastructure. Whether you’re using a public cloud, private cloud, or a mix of both, migrating to cloud-based infrastructure is not just a trend; it’s a strategic move for businesses seeking agility, scalability, and cost-efficiency. Cloud migration—moving data, applications, and workloads to the cloud (or between clouds)—is a critical step in this transformation.

Log Less, Achieve More: A Guide to Streamlining Your Logs

Businesses are generating vast amounts of data from various sources, including applications, servers, and networks. As the volume and complexity of this data continue to grow, it becomes increasingly challenging to manage and analyze it effectively. Centralized logging is a powerful solution to this problem, providing a single, unified location for collecting, storing, and analyzing log data from across an organization’s IT infrastructure.

Evaluating New Tools with Cribl

Discover how Cribl's suite of products can be utilized to assess security and analytics tools, thereby reducing the duration of POVs and simplifying the process of tool migrations. Cribl, the Data Engine for IT and Security, empowers organizations to transform their data strategy. Customers use Cribl's suite of products to collect, process, route, and analyze all IT and security data, delivering the flexibility, choice, and control required to adapt to their ever-changing needs.
Sponsored Post

5 Guiding Principles of Digital Business Observability

Modern data-driven organizations are synergizing operations observability, business intelligence, and data science with digital business observability programs that break down data silos, increase productivity, and drive innovation. Digital business observability combines IT and business data with cutting-edge data science techniques, enabling deeper analysis and unlocking valuable insights that propel innovation across use cases from sales and marketing to product design and financial operations.

Optimizing APM Costs and Visibility with Cribl Stream and Search

OpenTelemetry is starting to gain critical mass due to its vendor neutrality and having worked in the APM space for the last five years. I can see the appeal. Using OpenTelemetry libraries to instrument your code frees you from putting vendor libraries in your codebase. The other challenge most customers face is balancing cost versus visibility. While effective, most APM solutions are costly.

Major Hospital System Cuts Azure Sentinel Costs by Over 50% with Observo.ai

A large North American hospital system saw rapid increases in its Microsoft Azure Sentinel SIEM expenses primarily due to the escalating growth of security telemetry data. Their primary data sources were Fortinet Firewall logs, Windows Event Logs, Active Directory, Domain Controller, and DNS logs.

Exploring Splunk Alternatives: Deep Dive into Log Analysis

Splunk is a powerful and widely used software platform designed for searching, monitoring, and analyzing machine-generated data, including logs, events, and other forms of structured and unstructured data. Originally developed for IT operations and log management, Splunk has expanded its capabilities to address a broader range of use cases across various industries.

Up Your Observability Game With Attributes

Splunk Observability Cloud includes powerful features which automatically identify patterns within your data to surface trends. The resulting insights tell you why some customers aren’t getting an optimal experience from your application, and how you can improve it. Unlocking these features requires attributes to be included with your application traces. But how do you know which attributes are the most valuable for your application and business?

The Top 15 New Relic Dashboard Examples

Among the arsenal of tools available for monitoring and managing an organisation’s mission critical applications and service, New Relic is a popular choice for many users. In our article, we will delve into the world of New Relic Dashboards, shedding light on the best use cases that demonstrate their visualisation capabilities.

5 Important Reasons Why You Need Application Observability

Application performance monitoring (APM) has been around for a long time. Odds are if you’re tasked with overseeing app performance, you’ve had to deal with this technology to get an understanding of your applications and any issues that can arise in the name of troubleshooting. But there’s a new approach you should consider: application observability.

Elastic Observability monitors metrics for Microsoft Azure in just minutes

Developers and SREs choose Microsoft Azure to run their applications because it is a trustworthy world-class cloud platform. It has also proven itself over the years as an extremely powerful and reliable infrastructure for hosting business-critical applications. Elastic Observability offers over 25 out-of-the-box integrations for Microsoft Azure services with more on the way. A full list of Azure integrations can be found in our online documentation.

Forward logs from Google Cloud Platform to Site24x7 with Dataflow

Google Cloud Platform (GCP) enables organizations to create and scale applications. Activities in applications, whether on Compute Engine or other services from virtual machines to serverless environments on GCP, produce a significant amount of logs. Logs play a crucial role in helping you achieve effective observability and troubleshooting. But the logs may experience irregular surges in data ingestion during major system events, posing challenges for network overhead.

Navigating IT and Security Consolidation in 2024

Please join Cribl’s Ed Bailey and Jackie McGuire for a dynamic discussion around IT and Security vendor consolidation in 2024. The current economic landscape poses challenges for companies to sustain operations without being profitable or having a clear path to profitability. As a response, businesses are either merging with similar companies or becoming part of larger entities through acquisitions. Change is afoot, so join the conversation as we dive into the ongoing transformations, discussing the implications for security and observability. Get ready for an engaging discussion.

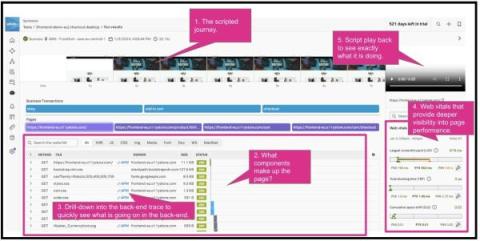
Why Knowing the Front-End and User's Experience of Your Platform is Key to Understanding How that Platform is Working

We have all been there. When you are trying to buy a ticket and the app crashes or loads the next web page when booking a holiday only to find it takes forever and appears to hang. Our frustration level increases and if it continues, we will exit and go elsewhere. With banking apps though, we won’t move straight away but repeated bad experiences here will be remembered and eventually will make us move.

Securing the Future: The Critical Role of Endpoint Telemetry in Cybersecurity

As IT managers and security practitioners navigate the complex terrain of modern cybersecurity in 2024 and beyond, the importance of endpoint telemetry cannot be overstated. This sophisticated technology involves meticulously gathering and analyzing data from various network endpoints, such as personal computers, mobile devices, and the ever-growing network of IoT devices.

Beyond Logs, Metrics and Traces

Despite what you may have seen and heard, the intersection of logging, metrics and tracing does not tell the whole story about observability. Our systems emit telemetry, and those previously noted telemetry signals are considered the “three pillars” of observability. They’re all important, but by themselves, they aren’t observability. Many users I see day in and day out find themselves with broken observability even though they’re collecting those three pillars.

Sending Go Application Logs to Loggly

If you’ve been building web apps long enough, you’ve certainly read through your fair share of logs. One of the more painful parts of going through web app logs is getting them all to the same place. It’s only then you can review your logs and troubleshoot your applications. In this article, we’ll build a simple Go web app to send logs to SolarWinds® Loggly®.

Introducing 'Cribl Stream Fundamentals'

Join Cribl's Ed Bailey and Cjapi's James Curtis for an engaging discussion about James' new book, 'Cribl Stream Fundamentals.' We will explore why James wrote the book and what he plans next. Additionally, we'll discuss his perspective on the challenges practitioners will face in 2024 and how teams should prepare for the year ahead.

Scaling Platform Engineering: Shopify's Blueprint

Platform Engineering is a hot topic these days. We’ve seen the hype around it in 2023, and I expect we shall see it becoming production-grade as we move into 2024. I wanted to look into this topic, and learn from those who’ve already implemented it at scale: the e-commerce hyperscaler Shopify. In the latest episode of OpenObservability Talks, I had the pleasure of hosting Aparna Subramanian, the Director of Production Engineering at Shopify.

Docker Logging One-Stop Beginner's Guide

Log analysis is a very powerful feature for an application when it comes to debugging and finding out which flow is working properly in the application and which is not. In a world of containerization and cloud computing, it is essential to understand logs generated by a Docker environment to maintain healthy performing applications. In this article, we will discuss log analysis in Docker and how logging in Docker containers is different than in other applications.

The Top 15 Splunk Dashboard Examples

The ability to extract meaningful insights from your wealth of organisational information is often the key differentiator between successful businesses and those struggling to stay competitive. Splunk, a renowned leader in the realm of data analytics and visualisation, has emerged as a powerful ally in this quest for actionable knowledge.

When to Automate Recurring Events

“Is it worth it?” is probably the most common question customers ask business architects and value advisors. Whether it’s a software deployment or process improvement, customers want to be assured that the effort and risk of a project delivers real value. That is the question people in my line of work spend their days trying to answer. In many cases, the answer is complicated and requires a great deal of experience to explain.

The Ultimate Guide to Windows Event Logging

In a perfect world, there would be no issues with the operating system and no problems with the applications. Unfortunately, this isn’t a perfect world. System failures can and will occur, and when they do, it is the responsibility of system administrators to diagnose and resolve the issues. But where can system administrators begin the search for solutions when problems arise? The answer is Windows event logs.

Building the NextGen Factory with Splunk and Bosch Rexroth

For centuries there have been many wise sayings on how to deal with disruptions and prevail amidst uncertain circumstances. Read on to learn how Splunk and Bosch Rexroth are building the next-generation factory to help manufacturers elevate their resilience and take advantage of new market trends and operating models.

How to Customise Detectors for Even Better Alerting

In the previous blog, we introduced what makes a bad alert and how being able to simply customise and fine-tune your detectors is critical to creating great alerts. The first category of detectors in Splunk Observability Cloud that we dived into was the out-of-the-box offering called AutoDetect. Customising and subscribing to these detectors is a great way to get up and running straight away with industry best-practice alerts and bring down MTTx.

Why Splunk customers face a choice for observability and modernization

Elastic Observability is fast, simple, and built for the future Businesses everywhere are facing a challenging environment: increased cost pressures coupled with high volumes of data generated by complex, distributed, cloud-native environments. As a result, teams need smarter analytics, access, and retention across all their data — instantly and from anywhere — to resolve issues, make decisions, and ensure resiliency.

Managing Kubernetes Events with Cribl Edge

When we discuss observability for applications running in Kubernetes, most people immediately default to Metrics, Logs, and Traces – commonly referred to as the “three pillars.” These pillars are just different types of telemetry – signals that can be fed into observability platforms to help understand how an application behaves. But did you know that Kubernetes offers another valuable signal? When combined with the other signals, you get MELT.

Data Lake Strategy: Implementation Steps, Benefits & Challenges

Data lakes have emerged as a revolutionary solution in the current digital landscape, where data growth is at a 28% CAGR with no signs of slowing. These repositories, capable of storing vast amounts of raw data in their native format in a vendor-neutral way, offer unprecedented flexibility and scalability.

All in the family Architecting and Managing Shared Graylog Clusters

Joel from the Solution Engineering team at Graylog discusses ways to deploy Graylog in a multi-tenant or shared environment and the challenges involved. He dives into the architecture of Graylog, explaining how to use streams, indexes, and permissions. The video focuses on running Graylog in shared capacities, depending on the diverse needs of various departments. Moreover, Joel also talks about traffic accounting and methods to extract data from Graylog. The video is loaded with useful insights from real-world customer experiences, making it a resourceful guide for anyone looking to optimize their Graylog setup.

Graylog Cluster: Navigating Shared Data Like a Pro

As data-rich solutions are important for many businesses, technical information can become overwhelming, especially regarding shared environments and multi-tenancy. In the world of Graylog, we understand these challenges and present the tools you need to keep your cluster running smoothly. Let’s dive into how you can effectively manage shared Graylog clusters.

Overcoming Messy Cloud Migrations, Outdated Infrastructures, Syslog, and Other Chaos

As businesses grapple with increasing data volumes, the need for practical tools to manage and use this data has never been greater. High-quality tools are great — but imagine what you could accomplish with one that made all the others in your toolbox even better? That’s exactly how we design every Cribl solution — we exist to help IT and Security teams get more out of their existing infrastructure.

Loki vs Elasticsearch - Which tool to choose for Log Analytics?

Elasticsearch, or the ELK stack, is a popular log analytics solution. The Loki project was started at Grafana Labs in 2018. Grafana leads the development of Loki, while Elastic is the company behind Elasticsearch. In this article, we will do a detailed comparison between these two tools for log analytics. Log data helps application owners debug their applications while also playing a critical role in cyber security.

Top 11 Splunk Alternatives in 2024 [Includes Free & Open-Source Tools]

Splunk is a powerful unified security and observability tool that analyzes data and logs. Splunk allows you to monitor and visualize data in real-time. It analyzes machine-generated data and logs through a web interface. It was recently acquired by Cisco in a $28 billion deal. While Splunk is a powerful platform, it might not suit your needs. In this post, we discuss 11 top Splunk alternatives that you can consider.

What's New in Open 360? January 2024 Update

At Logz.io, we recently announced the release of App 360, a new solution that aims to shift the paradigm around application performance monitoring (APM) systems. To better give our customers a look at the new solution within the Logz.io Open 360™ platform for essential observability, we recently hosted a webinar explaining App 360 in greater depth and provided a detailed product demonstration. Let’s take a closer look at the key highlights and insights we shared during the webinar.

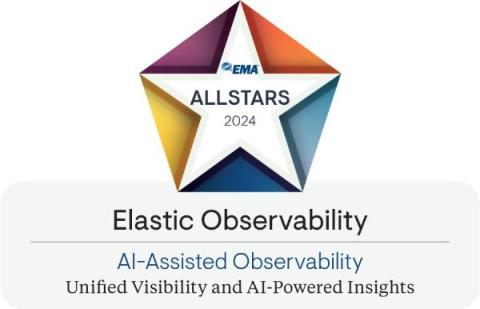
Elastic recognized with 2024 EMA Allstars award for its AI-assisted observability

We are thrilled to be recognized with the 2024 EMA Allstars award. This award acknowledges Elastic’s focus on delivering a full-stack observability solution that provides unified visibility and AI-powered insights into complex hybrid cloud deployments. The EMA Allstars award celebrates trailblazers and innovators who are reshaping the enterprise technology landscape.

Scale Your Splunk Cloud Operations With The Splunk Content Manager App

Effectively managing both public and private Splunk Apps across multiple Splunk environments poses a considerable challenge, demanding significant time and effort with the potential for tedious and manual tasks. Recognizing this complexity, the Splunk Cloud Service has been progressively introducing additional features and capabilities to streamline and simplify these intricate administrative responsibilities.

How to Create Great Alerts

We’ve all been guilty of it. Creating rules and filters to hide those alerts that, for the most part, are just noise. Only then to have notifications about a legitimate issue also get swept up by those same filters. There’s only so many times we can break concentration and disrupt productivity before getting fed up with false positives and ignoring everything completely.

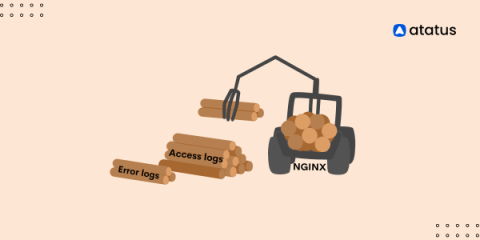
NGINX Access and Error Logs

Nginx, a widely used web server and reverse proxy, maintains two crucial logs that provide valuable insights into its performance and user interactions: the access log and the error log. These logs play a pivotal role in monitoring and troubleshooting web server activities. The access log records every request made to the server, capturing details such as the requested URL, client's IP address, response status code, and user agent.

Understand & Optimize Your Telemetry Data (Subtitled)

The explosion of telemetry data also massively increases your data bill. Teams also cannot control the data they do not understand and often lack the capabilities to act on it once it is understood. Mezmo makes it easier to understand and optimize your data. It helps reduce unnecessary noise and cost, and improve the quality of your data, so that your developers and engineers can consistently deliver on their service level objectives.

Managing Telemetry Data Overflow in Kubernetes with Resource Quotas and Limits

One of the inherent challenges you'll face when working with Kubernetes is that a typical cluster includes many resources that produce telemetry data. Because producing and moving telemetry data consumes resources, you can end up in situations where different workloads are competing for the resources necessary to manage telemetry data.

EMA explores Elastic AI Assistant for Security

Spoiler alert: it’s great! Elastic Security has been making waves among busy security analysts everywhere with the launch of Elastic AI Assistant. Whether it’s synthesizing alert details and suggesting next steps, or the recent addition from Elastic 8.11 to generate ES|QL queries from natural language, there’s a lot to love about Elastic AI Assistant for security efforts.

AI at Splunk: Trustworthy Principles for Digital Resilience

There’s no doubt AI will radically reimagine the way we live, work and interact. It will empower new ways to solve business challenges and deliver customer value, but such a widespread impact requires a holistic approach. Building AI responsibly is one thing, but embedding trust into every aspect of our AI strategy is another entirely – and that’s what Splunk sets out to do.

How Cribl Helps the UK Public Sector Manage Challenges Around Growing Data Costs and Complexity

As the Data Engine for IT & Security, Cribl helps organisations overcome several challenges, including : In this first blog, we will concentrate on how Cribl can help the UK public sector deal with ever-rising data volumes whilst controlling costs.

Why Your Logging Data and Bills Get Out of Hand

In the labyrinth of IT systems, logging is a fundamental beacon guiding operational stability, troubleshooting, and security. In this quest, however, organizations often find themselves inundated with a deluge of logs. Each action, every transaction, and the minutiae of system behavior generate a trail of invaluable data—verbose, intricate, and at times, overwhelming.

Monitoring-as-Code for Scaling Observability

As data volumes continue to grow and observability plays an ever-greater role in ensuring optimal website and application performance, responsibility for end-user experience is shifting left. This can create a messy situation with hundreds of R&D members from back-end engineers, front-end teams as well as DevOps and SREs, all shipping data and creating their own dashboards and alerts.

How to easily add application monitoring in Kubernetes pods

The Elastic APM K8s Attacher lets the Elastic APM agent auto-attach to the application in your pods by adding just one annotation to your deployment The Elastic® APM K8s Attacher allows auto-installation of Elastic APM application agents (e.g., the Elastic APM Java agent) into applications running in your Kubernetes clusters. The mechanism uses a mutating webhook, which is a standard Kubernetes component, but you don’t need to know all the details to use the Attacher.

Why Network Load Balancer Monitoring is Critical

Your networks are the highways that enable data transfers and cloud-based collaboration. Like highways connect people to physical locations, networks connect people to applications and databases. As you would look up the fastest route between two physical locations, your workforce members need the fastest connectivity between two digital locations. Network load balancers enable you to prevent and identify digital “traffic jams” by redistributing incoming network requests across your servers.

Elastic Search 8.12: Making Lucene fast and developers faster

Elastic Search 8.12 contains new innovations for developers to intuitively utilize artificial intelligence and machine learning models to elevate search experiences with lightning fast performance and enhanced relevance. This version of Elastic® is built on Apache Lucene 9.9, the fastest Lucene release ever, and updates some of our most popular integrations such as Amazon S3, MongoDB, MySQL, and more.

Elastic Observability 8.12: GA for AI Assistant, SLO, and Mobile APM support

Elastic® Observability 8.12 announces general availability (GA) for the AI Assistant, Service Level Objectives (SLO), and Mobile APM support: Elastic Observability 8.12 is available now on Elastic Cloud — the only hosted Elasticsearch® offering to include all of the new features in this latest release. You can also download the Elastic Stack and our cloud orchestration products, Elastic Cloud Enterprise and Elastic Cloud for Kubernetes, for a self-managed experience.

Incident Response Plans: The Complete Guide To Creating & Maintaining IRPs

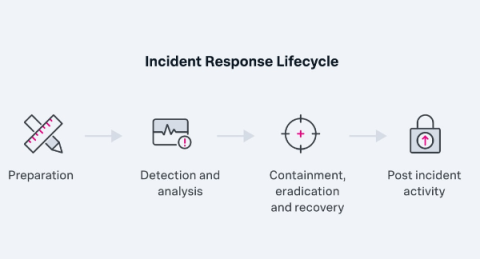
Speedily minimizing the negative impact of an information security incident is a fundamental element of information security management. The risks — loss of credibility in the eyes of users and other stakeholders, loss of business revenue and critical data, potential regulatory penalties — can significantly jeopardize your organization’s mission and objectives.

Collecting OpenShift container logs using Red Hat's OpenShift Logging Operator

This blog explores a possible approach to collecting and formatting OpenShift Container Platform logs and audit logs with Red Hat OpenShift Logging Operator. We recommend using Elastic® Agent for the best possible experience! We will also show how to format the logs to Elastic Common Schema (ECS) for the best experience viewing, searching, and visualizing your logs. All examples in this blog are based on OpenShift 4.14.

Make Moves Without Making Your Data Move

How much of the data you collect is actually getting analyzed? Most organizations are focused on trying not to drown in the seas of data generated daily. A small subset gets analyzed, but the rest usually gets dumped into a bucket or blob storage. “Oh, we’ll get back to it,” thinks every well-intentioned analyst as they watch data streams get sent away, never to be seen again.

Docker Log Rotation Configuration Guide | SigNoz

It is essential to configure log rotation for Docker containers. Log rotation is not performed by default, and if it’s not configured, logs on the Docker host can build up and eat up disk space. This guide will teach us how to set up Docker log rotation. Logs are an essential piece of telemetry data. Logs can be used to debug performance issues in applications.

Observability and Telecommunications Network Management [Part 1]

The border between the management of telecommunications networks and the services that they support and the management of IT infrastructures and the applications that they support has always been a porous one. One might say that they are like two dialects of the same language rather than different languages. Nonetheless, these areas, whether characterised by technology or practice, are different and have, for the most part, been served by different vendors and products.

Security Has a Big Data Problem, and an Even Bigger People Problem

Got cybersecurity problems? Well, the good news is the same as the bad news — you’re not alone. The world of security has a big data problem and an even bigger people problem. Enterprise connectivity has drastically increased in the last decade, meaning every employee, contractor, and vendor has some level of access to corporate networks. To support this growth, companies monitor exponentially increasing infrastructure and traffic, producing a steadily rising volume of data.

Debugging 5 Common Networking Problems With Full Stack Logging

Infrastructure is a complex and difficult concept for developers. When an issue occurs, where do you even begin to look? I’ve spent years of my life playing the “What looks like one but not like the other” game, wrestling with confirmation bias and hunting through haystacks of logs to find a clue to my hosted applications. This takes away from time spent improving my applications—and it isn’t fun.

How the All-In Comprehensive Design Fits Into the Cribl Stream Reference Architecture

In this livestream, Ahmed Kira and I provided more details about the Cribl Stream Reference Architecture, which is designed to help observability admins achieve faster and more valuable stream deployment. We explained the guidelines for deploying the comprehensive reference architecture to meet the needs of large customers with diverse, high-volume data flows. Then, we shared different use cases and discussed their pros and cons.

Exploring Observability's Role in Retail & E-Commerce

For retailers and ecommerce store owners, your bottom line is always affected whenever your service is down, due to today's consumers expecting their digital interactions to operate around the clock. This is particularly crucial during spikes in traffic due to sales, like Black Friday or Cyber Monday.

Cribl Stream's Replay vs Cribl Search's Send: Understanding the Differences

In today’s contemporary landscape, organizations produce more data than ever, which needs to be collected, stored, analyzed, and retained, but not necessarily in that order. Historically, most vendors’ analysis tools were also the retention point for that data. Still, while this may first appear to be the best option for performance, we have quickly seen it creates significant problems.

Data Architecture for Business Data & AI Projects

Like physical architecture, the architecture running your business data — any and compute-intensive AI projects — is important. This data architecture governs a very important part of your business: how well users can translate raw information into real knowledge and actionable insights. Today, your data architecture is getting perhaps more attention than ever before. And that’s all thanks to usable AIs that now exist.

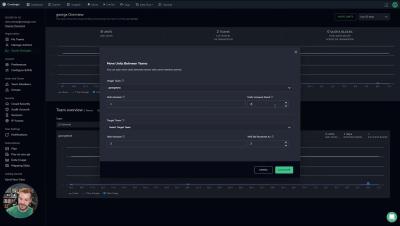
Organization Admin Console

Coralogix supports multi-tenancy, allowing multiple teams to be connected under a single organization. Some companies prefer separate teams to isolate data based on the environment it originates from like: Dev, QA, or Production. While others prefer to isolate the data based on organizational units like: Infrastructure, Security, and Application. Coralogix allows you to associate multiple teams with an Organization.

Unified Observability: The Right Way Ahead

Observability, in modern software engineering, has evolved into a paramount concept, shedding light on the intricate inner workings of complex systems. Three essential pillars support this quest for clarity: logging, traces, and metrics. These interconnected elements collectively form the backbone of observability, enabling us to understand our software as never before. Think of a system as a bustling city.

Observability vs. APM: What to Know on Your Monitoring Journey

In the ever-evolving landscape of software development and IT operations, monitoring tools play a pivotal role in ensuring the performance, reliability, and availability of your applications. Two key disciplines in this domain are observability and Application Performance Management (APM). This post will help you understand the nuances between observability and APM, exploring their unique characteristics, similarities, benefits and differences.

How To Set Up Monitoring for Your Hybrid Environment

The modern IT landscape consists of many distributed systems, which can pose a challenge if you are responsible for the end-to-end performance of these systems. As a platform engineer today, that is exactly what the job requires. You must juggle between dozens of tools to meet SLAs. This is why a modern solution is needed to bridge the gap between disjointed infrastructure and application stacks…and this is why the Splunk Observability platform was born.

The Role of Observability in Media and Entertainment

Digital transformation is at the core of media and entertainment organizations, it’s vital for these firms to constantly evolve to provide the best user experience to their customers. These companies must seek new and interesting content, services, and tailored offerings that enhance the audience’s experience and supply personalization. However, whilst these investments are essential to remain competitive, they’re also particularly costly.

How to Monitor Your Hybrid Applications Without Toil

About seventy-two percent of businesses operate in a hybrid IT environment, mixing their cloud-based services with traditional on-premises infrastructure. These hybrid environments offer many benefits, from scale, speed, and flexibility to security, cost savings, and control, blending the best of both worlds.

Performing Geolocation Lookups on IP Addresses to Use in Cribl Search

Are you tired of sifting through data without context? Cribl Search adds valuable depth to your data, making it much easier to understand and analyze. No more squinting at cryptic logs or puzzling over unknown IP addresses! ️ Some common examples of how Cribl Search can enrich your data are adding service names or matching to threat intelligence. Another popular data enrichment is adding geographical location to events based on IP addresses.

Log Monitoring 101 Detailed Guide [Included 10 Tips]

Log monitoring is the practice of tracking and analyzing logs generated by software applications, systems, and infrastructure components. These logs are records of events, actions, and errors that occur within a system. Log monitoring helps ensure the health, performance, and security of applications and infrastructure. Log Monitoring helps in early detection of potential issues, ensuring systems run smoothly and efficiently. In this detailed 101 guide on Log monitoring, we will learn.

Looking at nth degree's Innovative Fractional Service Delivery Model

The nth degree team joins Cribl's Ed Bailey and Andrew Duca to discuss nth degree's innovative fractional service delivery model. This is a discussion anyone who has had to engage professional services should be interested in hearing. nth degree has developed a service delivery model that enables fast engagement and removes friction around service delivery and planning. Imagine not having to get an SOW reviewed by legal for every engagement. That alone solves a big problem for almost everyone.

The Future of Higher Education: Observability As A Strategic Asset

Schools, universities and other organizations within higher education have been shifting to modernize their learning experiences. With the intake of new students each year, some of these being based remotely, these organizations are seeking to manage large-scale and highly distributed infrastructure.

Integrating Cribl Stream with the Built-in Tables of Microsoft Sentinel

Cribl’s integration catalog is ever-expanding. At Cribl, we constantly collect feedback on where to integrate next and channel it to deliver more high-impact integrations into our catalog. Whether it is Sources, Collectors, or Destinations, we constantly add new integrations to expand our reach in the IT security and observability ecosystem.

Business Intelligence and Log management - Opportunities and challenges

Business intelligence (BI) is all about making sense of huge amounts of data to extract meaningful and actionable insights out of it. Log management tools such as Graylog, instead, are the perfect solution to streamline data collection and analysis, so it’s easy to understand how these two technologies can make sense when they’re coupled together.

3 Straightforward Pros and Cons of Datadog for Log Analytics

Observability is a key pillar for today’s cloud-native companies. Cloud elasticity and the emergence of microservices architectures allow cloud native companies to build massively scalable architectures but also exponentially increase the complexity of IT systems.

The Importance of Traces for Modern APM [Part 2]

In part 1, we looked at how the design plan of traditional monitoring technologies depended heavily on properties of the systems that were intended to monitor and then showed how those properties began to be undermined by an increase in complexity, an increase which can ultimately be captured by the concept of entropy. In this part, we will explore how increased entropy forces us to rethink what is required for monitoring.

Generating and Comparing Statistics with Eventstats in Cribl Search

When exploring data, comparing individual data points with overall statistics for a large data set is often useful. For example, you might be interested in understanding when a performance metric rises above the historical average. Or possibly knowing when the variance of that metric increases past a certain threshold. Or maybe noting a change in the distinct number of IP addresses connecting to your public web portal.

Shadow IT & How To Manage It Today

In the business world, shadow IT is a controversial topic. Gartner defines Shadow IT as any IT devices, software and services that are used outside or beyond the ownership or control of IT departments/ organizations. This includes: In a standard work environment, the IT department would be responsible for providing whatever IT solutions and work tools were needed across all business functions.

The concise guide to Loki: How to work with out-of-order and older logs

For this week’s installment of “The concise guide to Loki,” I’d like to focus on an interesting topic in Grafana Loki’s history: ingesting out-of-order logs. Those who’ve been with the project a while may remember a time when Loki would reject any logs that were older than a log line it had already received. It was certainly a nice simplification to Loki’s internals, but it was also a big inconvenience for a lot of real world use cases.

RED Monitoring: Rate Errors, and Duration

The RED method is a streamlined approach for monitoring microservices and other request-driven applications, focusing on three critical metrics: Rate, Errors, and Duration. Originating from the principles established by Google's "Four Golden Signals," the RED monitoring framework offers a pragmatic and user-centric perspective on service performance.

Committed to Observability Excellence: Logz.io's Open 360 Observability Platform Takes Home Over a Dozen Winter G2 Badges

As we continue to iterate and help organizations meet their observability goals, Logz.io is thrilled to announce we’ve earned over a dozen Winter 2023 G2 Badges for our Logz.io Open 360™ essential observability platform! G2 Research is a tech marketplace where people can discover, review, and manage the software they need to reach their potential. Here are the Winter 2023 G2 Badges we’ve taken home for Application Performance Monitoring (APM) and Log Analysis.

How Observability Enhances Financial Services

Financial services and financial technology (FinTech) companies often depend upon complex infrastructure to handle their financial data. Security and compliance are paramount for these organizations, for gaining full visibility into the health and performance of these services to guarantee security is essential.

Evolving Cribl's Own Observability Practice at Blazing Speed

Cribl.Cloud has grown substantially since its launch, and our observability practice has developed in parallel. Gone are the early days of manageable logs and metrics. As we continue to grow, that problem will become even more challenging. We used Splunk internally, a well-used internal system, as our primary event management system. With Cribl Edge nodes deployed across our entire cloud fleet, we collect logs and metrics and send them to Cribl Stream for processing and routing.

Log Wrangling: Leveraging Logs to Optimize Your System

Today, we delve into the art and science of Log Wrangling. This process involves corralling, organizing, and deriving maximum benefits from your logs like handling unpredictable livestock. Why do we do this? Managing logs can be challenging, but we can transform them from a daunting task with the correct approach into a beneficial tool… Graylog.

Coralogix vs Cloudwatch: Support, Pricing, Features & More

Cloudwatch is a standard component for any AWS user, with tight integrations into every AWS service. While Cloudwatch initially seems like a cost-effective solution, its lack of functionality and flexibility can result in higher costs. Let’s explore Coralogix vs Cloudwatch.