Operations | Monitoring | ITSM | DevOps | Cloud
October 2022
Celebrating the power of the internet
International Internet Day (10/29) is an occasion for people to celebrate the great invention that transformed the way we live, work, and communicate. The day is an annual reminder of how far we have come since the creation of the internet and where it might take us in the future. Let us look into how the internet invaded every aspect of our daily lives and became indispensable.
The Orion Platform and the SolarWinds Platform - What's the Difference?
A more greenfield opportunity for threat actors
Minimizing network downtime by integrating network monitoring solutions with ITSM tools
Being a network admin of an enterprise network, you know better than anyone how disastrous network downtimes might be. The cost of downtime study conducted by Gartner in 2014 found that network downtime costs $5,600 per minute on an average, but this number can range from $2,300 to $9,000 per minute. With organizations moving towards sophisticated networks built on hybrid infrastructures, network downtimes are becoming more frequent and costly.
Network automation tools and their importance in today's networks
Insight and reliability through continuous synthetic testing in Kubernetes
Kubernetes has become the de facto standard for cloud-based applications. As companies migrate more and more workloads, ensuring reliable connectivity and performance are critical not just for user applications but also for the cluster itself. In this article, we will discuss how augmenting your system monitoring with in-cluster synthetic testing can give you proactive indicators that something might be headed for trouble.
A Demonstration of SolarWinds Observability | SolarWinds Day Virtual Showcase (Oct 22)
A Demonstration of Hybrid Cloud Observability | SolarWinds Day Virtual Showcase (Oct 22)
A Demonstration of Hybrid Cloud Observability | SolarWinds Day Virtual Showcase (Oct 22)
What's New with WhatsUp Gold 2022.1
Managing the hidden costs of cloud networking - Part 2
In the first post of this series, I detailed ways companies considering cloud adoption can achieve quick wins in performance and cost savings. While these benefits of the cloud certainly remain true in theory, realizing these benefits in practice can be increasingly difficult as applications and their networks become more complex.
Monitoring your Network SNMP devices using Hosted Graphite
When you design architecture to monitor your digital assets - either software applications or hardware devices, you need to use different strategies depending on your monitoring target. The factors you want to consider can vary including methods of retrieving monitoring data, frequency of data collection, and how you want to surface metrics and insight you find to stakeholders. In this article, we will mainly discuss how we can monitor your network SNMP devices using Hosted Graphite.
Moving from Network Monitoring to Network Observability
If you’re finding it a little difficult to sift through all the varying, often conflicting information surrounding the topic of network observability, you’re certainly not alone.
Ribbon's State of the art SBCs are certified for Google Voice SIP Link for Global Availability
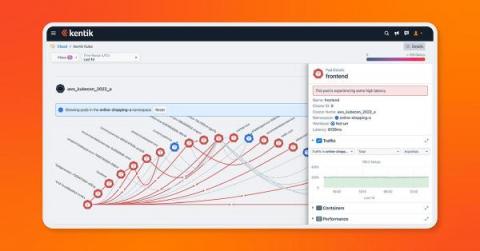
Kentik Kube extends network observability to Kubernetes deployments
We’re excited to announce our beta launch of Kentik Kube, an industry-first solution that reveals how K8s traffic routes through an organization’s data center, cloud, and the internet. With this launch, Kentik can observe the entire network — on prem, in the cloud, on physical hardware or virtual machines, and anywhere in between.
Megaport ONE Infopaper
Best practices for network perimeter security in cloud-native environments
Cloud-native infrastructure has become the standard for deploying applications that are performant and readily available to a globally distributed user base. While this has enabled organizations to quickly adapt to the demands of modern app users, the rapid nature of this migration has also made cloud resources a primary target for security threats.
Network Performance Monitoring Is Only Step One
Incident response aims to identify, limit, and mitigate an incident. Whether such an occurrence is a security breach or a hardware failure, formulating and continuously strengthening an incident response strategy has become vital for all businesses in the digital age. Your incident response strategy consists of the processes your organization takes to handle incidents-such as network outages and service-impacting bugs-and the steps taken to mitigate incidents.
3 Ways You Might Have an NOC Process Hangover
NOC, or network operation center, processes have been set in stone for decades. But it’s time for some of these processes to evolve. Digital transformation and the cloud era have led to the rise of DevOps, and with it, service ownership. Service ownership means that developers take responsibility for supporting the software they deliver at every stage of the life cycle. This brings development teams closer to their customers, the business, and the value they deliver.
Condé Nast Uses Proactive Monitoring Solution to Better Serve its Media Empire
3 Ways You Might Have a NOC Process Hangover
NOC, or network operation center, processes have been set in stone for decades. But it’s time for some of these processes to evolve. Digital transformation and the cloud era have led to the rise of DevOps, and with it, service ownership. Service ownership means that developers take responsibility for supporting the software they deliver at every stage of the life cycle. This brings development teams closer to their customers, the business, and the value they deliver.
Introducing PrivateLink Support for Enterprise
Network topology can get very complicated in the cloud, especially when you’re sending data to external SaaS providers. You will likely need to configure gateways and firewalls and keep close tabs on those points of egress. However, if your infrastructure exists within AWS, there’s a much simpler way and that’s through an AWS PrivateLink endpoint.
Modern IT Infrastructure Management: Three Pillars for Success
Your IT Infrastructure team faces untenable demands on their time and resources as your organization increasingly relies on complex hybrid infrastructures and an ever-growing set of technologies and cloud-based services. You can actually limit visibility and slow triage as you add monitoring tools to cover this expansion, blocking critical insight into your environment at the IT service level. What’s really required to be successful in today’s IT infrastructure environment?
Infovista partners with VMware to bring Automated Assurance and Operations to multi-cloud environments
N-able Recognized with Three Comparably Awards as a Best Place to Work
BGP Monitoring with Catchpoint
A Guide to SD-WAN
SD-WAN has been making waves in the networking world thanks to its ability to provide dependable edge-to-cloud connectivity. Here’s how it works, and how it could help you.
Your Business Requires a Resilient Internet
One of my initial surprises upon joining Catchpoint about five months ago was to do with how much confusion there is in the observability market. Every single vendor has almost the same message around ensuring a great digital experience for your customers or employees or both. Of course, these experiences are critical to get right, but for the most part many of these solutions, at best, help to ensure that sites are live and available, and that they are reachable by some users.
SolarWinds Hybrid Cloud Observability - Evolving Beyond Monitoring
Four Ways SolarWinds Observability Fuels Business Innovation
SolarWinds Observability - A Unified Full-Stack Solution for DevOps Teams
The Future of the Network is End User Experience. Are you Ready?
How BGP propagation affects DDoS mitigation
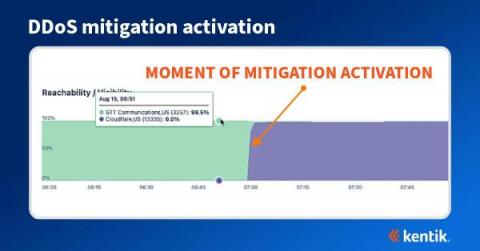
We often think of DDoS attacks as volumetric malicious traffic targeted against organizations that effectively take a service offline. Most frequently detected by anomalous behavior found in NetFlow, sFlow, IPFIX, and BGP data, what may not be well understood is how the DDoS mitigation works and how it’s possible to visualize the effectiveness of the mitigation during and after an attack.
How BGP propagation affects DDoS mitigation
Detecting and Mitigating DDoS Attacks
Megaport Virtual Edge (MVE) Infopaper
Megaport Overview
4 Website Security Threats (2022) + Solutions
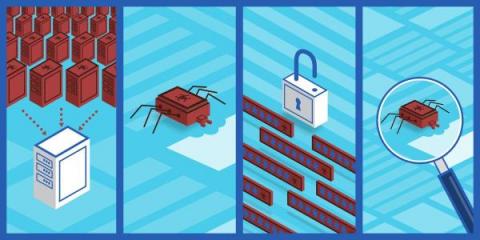
For server administrators tasked with ensuring the reliable operation of their web applications, the thought of a lurking cyberattack can be one to lose sleep over. An attack on your system and the services you provide could render your web applications unresponsive. What’s worse, important information that depends on privacy and the careful storing of data is put at risk.
9 tips for keeping down cloud expenditure
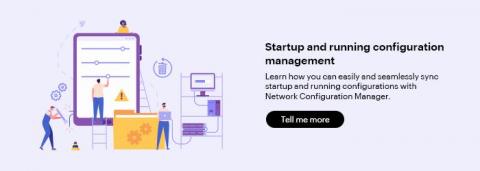
Startup and running configuration management
Configurations are considered the heart of network infrastructure. They are often adjusted to improve the overall workflow of the network environment. One small unnecessary change to a configuration can bring down an enterprise’s entire network infrastructure. Therefore, the changes made to configurations must always be checked to ensure they are in sync with the devices to improve efficiency and performance. A network configuration is generally divided into two parts: 1.
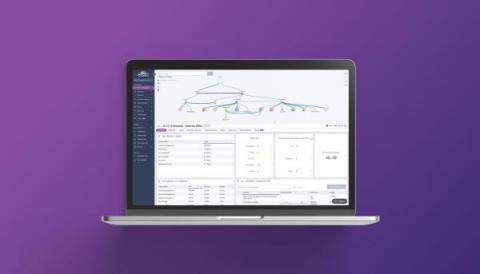
How to Monitor SD-WAN Networks
With the increasing use of cloud-based applications, businesses are more reliant than ever on the Internet to deliver WAN traffic. As a result, they’re migrating from MPLS networks to hybrid WAN architectures and SD-WAN technology. Keep reading to learn how to monitor SD-WAN networks with Network Monitoring to identify issues that native SD-WAN monitoring features often miss.
Flows vs. packet captures for network visibility
Recently, I saw some discussion online about how flow data, like NetFlow and sFlow, doesn’t provide enough network visibility compared to doing full packet captures. The idea was that unless you’re doing full packet captures, you’re not doing visibility right. Because I’ve used packet captures so many times in my career, I admit there’s a part of me that wants to agree with this.
Webinar Snippet: How to Monitor SD-WAN Networks
Webinar Snippet: How to Monitor SD-WAN Networks - Monitoring Agents
N-able Announces Award Winners During Empower Partner Conference in Las Vegas
Exoprise Expands Network Visibility into Microsoft Teams and Leading UCaaS Applications
Expanding the Definition of the Network with Saaslio & Boardgent
How to Fix Poor Google Cloud Latency
Learn how to reduce your latency and get better network performance from the popular cloud service provider.
WhatsUp Gold 2022.1: Monitor More of What Matters, Right Out of the Box
Well, we’re here to change that. Progress WhatsUp Gold release 2022.1, available as of October 12, 2022, offers users even more built-in infrastructure discovery and monitoring power, available for immediate use. It’s now even easier for you to: It’s been a banner year for WhatsUp Gold users. Packed with enhancements, WhatsUp Gold 2022.1 layers onto the powerful improvements already released in 2022.0 last March.
Rising IT costs: What to watch out for
Optimize Your Infrastructure Resources for Continuity of Network Monitoring Operations
Leverage DX NetOps network monitoring software metric projections to manage demands for IT resources proactively and cost-effectively. Capacity is a finite resource, so your IT Team needs to carefully analyze current and future use case scenarios to prevent potential bottlenecks. Presenting key network metric projections in a simple and unified manner is paramount to predict capacity and to understand when more resources are needed, allowing you to plan accordingly.
A Beginners Guide to Container Network Interfaces (CNI) - Civo Academy
Network Assessment Software: Overview & Examples
It’s true that network assessments take time, but they are worth every second. Today, businesses around the globe struggle to keep their networks and data secure. In fact, TechTarget’s list of 2022 cybersecurity statistics announces that “the cost of cybercrime is predicted to hit $10.5 trillion by 2025.” However, with routine network assessments, businesses can reduce threats and keep their IT infrastructures running smoothly.
How Service Virtualization Supports Cloud Computing: Key Use Cases
Several weeks ago, while on a call, a customer of the Broadcom Service Virtualization solution posed the following question: “Now that we’re moving to the cloud, do we still need Service Virtualization?” The question struck me as odd.
What Is a Firewall?
A firewall is a cybersecurity tool used to prevent unauthorized access to your private device or network. It could refer to any software or hardware that checks the data and traffic coming in and going out of a network to ensure they comply with cybersecurity rules. Firewalls can also include what is known as an intrusion detection system (IDS), which additionally blocks malicious traffic while allowing legitimate and authorized traffic access to a network.
Kubernetes Node-to-node Networking - Civo Academy
Enreach further strengthens European footprint with acquisitions in the Netherlands and Denmark
Pod to Pod Networking in Kubernetes - Civo Academy
Boost Application Experience with Network Behavior Analysis
“Network behavior analysis (NBA) is a network monitoring program that ensures the security of a proprietary network. NBA helps in enhancing network safety by watching traffic and observing unusual activity and departures of a network operation,” explained Techopedia. “Network behavior analysis monitors the inside happenings of an active network by collecting data from many data points and devices to give a detailed offline analysis.
How to Monitor Google Cloud Interconnect and Network Performance
Google Cloud Interconnect promises data transfers with low latency, and high availability - but how can you make sure that it’s actually performing as promised? Continuously monitoring Google Cloud Interconnect performance is the key to identifying slowdowns, high levels of packet loss, and other problems affecting Google Cloud. Keep reading to learn how to do it all in minutes using Obkio Network Monitoring!
Network Security - Making Sure VoIP Is Not A Security Risk
Container to Container Networking - Civo Academy
Data Center's Need MSPs
3DS OUTSCALE uses Megaport to Unlock Cloud Potential
3DS OUTSCALE aims to provide local cloud services with global reach.
Device discovery: The path to total network visibility
For an organization to prevent cyberattacks, it first needs complete visibility into all the events that occur within its network. With this visibility, the organization can analyze risky behavior by users and entities, and take the necessary steps to proactively secure itself. However, if an attack were to still happen, the organization again needs complete visibility to identify how and from where the attacker entered the network.
Fundamentals: What Sets Containers Apart from Virtual Machines
Containers have fast become one of the most efficient ways of virtually deploying applications, offering more agility than a virtual machine (VM) can typically provide. Both containers and VMs are great tools for managing resources and application deployment, but what is the difference between the two, and how do we manage containers?
The top 5 benefits of peering
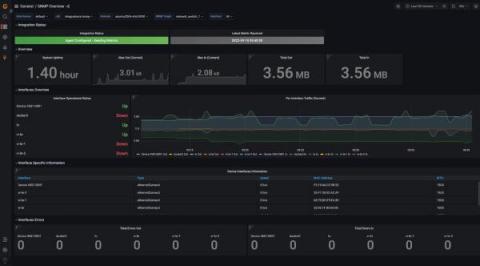
Set up instant SNMP monitoring with the new SNMP integration in Grafana Cloud
Simple Network Management Protocol (SNMP) is an internet protocol that is used to collect information about network devices and manage them. Most of the modern devices connected to a network support SNMP, such as routers, switches, servers, printers, and more. There are three different versions of SNMP (v1, v2, and v3). It most commonly operates on UDP ports 161 and 162. The most common versions being used are v1 and v2. The data can be collected from a network device through SNMP via polling.
10 Tools for Monitoring Mobile Apps from a Network Point of View
With so many apps to choose from, mobile users no longer have much patience for apps that don’t work well. This isn’t just about bugs and crashes; users also think about how fast the app works and how much battery it uses. But have you ever thought about what would happen to the business if your live applications running on the client’s systems went down or didn’t work as expected?


