Operations | Monitoring | ITSM | DevOps | Cloud
April 2021
Under the Hood With Splunk Observability
Network Observability for Distributed Services
Logz.io and the AWS Distro for OpenTelemetry
Amazon Web Services has announced enhanced support for the open-source distribution of the OpenTelemetry project for its users. AWS Distro for OpenTelemetry (ADOT) now includes support for AWS Lambda layers for the most popular languages and additional partners integrated into the ADOT collector. And one of those partners is Logz.io! Logz.io is happy to announce that our exporter is now included in the AWS Distro for OpenTelemetry.
6 Steps to Getting Started With Observability
During my office hours, I frequently get asked for practical tips on getting started with observability. Often it’s from folks on teams who are already practicing continuous delivery (or trying to get there) and are interested in more advanced practices like progressive delivery. They know observability can help—but as individual contributors—they don’t sign the checks, so they feel powerless to help get their team started with observability.
The Evolution of Observability and Monitoring panel discussion Failover Conf 2021
The State of Observability 2021: Key Findings
We at VMware Tanzu recently published our first-ever summary of the current state of observability. The main goal of our research was to uncover the key trends in observability adoption by hearing directly from IT practitioners, including DevOps teams, SREs, application architects, and their managers. We also wanted to understand what’s driving the popularity of observability and what the organizational impact of deploying observability is.
How PayIt, a secure cloud service provider for digital government, uses Grafana and Prometheus for observability at cloud native scale
A trip to the DMV — and a realization that there had to be a better, more modern way for the system to work — sparked the idea for PayIt, a secure cloud service provider for digital government that launched in 2013. The company’s mission is to help state, local, and government agencies reach their constituents better and more effectively, shifting the reliance from in-office payments to digital ones.
Dynamic Observability: Troubleshooting Techniques for 2021
[Webinar] Observability and Resilience in Microservice Environments with Komodor & Epsagon
Monitoring AWS EC2 with Splunk Observability
Today, much of our online world is powered by cloud computing, and Amazon Web Services offers an amazing depth and breadth of available services. However, most of the time it starts with Amazon Elastic Compute Cloud, EC2. EC2 is powered by virtual servers called instances and allows users to provision scalable compute capacity as desired. This means no server hardware investment and the ability to scale up or down in response to demand (thus elastic).
Expanded SaaS Coverage Delivers Full-Stack Observability At A Global Scale
AppDynamics expands SaaS offerings with new strategic locations to increase flexibility of cloud deployments, accelerate digital transformation, and eliminate concerns related to regional data residency regulations.
Getting started with free and open Elastic Observability
Unify and contextualize your logs, metrics, application trace data, and availability data behind a single pane of glass. Elastic Observability provides a unified view into the health and performance of your entire digital ecosystem. With easy ingest of multiple kinds of data via pre-built collectors for hundreds of data sources, Elastic Observability delivers seamless integration between the facets of observability.
Kubernetes Security and Observability
[Webinar] The role of log management in aiding observability in distributed systems
Logz.io Named a Leader in GigaOm Radar for Cloud Observability
Today we are excited to share a key milestone, not only for Logz.io, but also for our industry as a whole. For the first time ever, an industry analyst took on the ambitious challenge of analyzing and assessing several different markets including monitoring and telemetry, APM, AIOps, observability, and more. The radar also takes account of evaluating leaders’ various products, unveiling a comprehensive overview under the unified lens of Observability.
Announcing Lightrun Cloud: Shifting Left Observability, One Developer at a Time
We’re proud to announce the general availability of Lightrun Cloud – a completely free and self-service version of the Lightrun platform. We consider Lightrun Cloud to be a major milestone in our constant journey to empower developers with better observability tooling and welcome you to sign up for a free account.
The genesis of SigNoz - A full-stack open source observability platform
Why we felt there was a need for a full stack open source observability platform and how we went about building it.
Expanded SaaS Coverage Delivers Full-Stack Observability At A Global Scale
AppDynamics expands SaaS offerings with new strategic locations to increase flexibility of cloud deployments, accelerate digital transformation, and eliminate concerns related to regional data residency regulations.
Announcing New Honeycomb Management API
Starting today, Honeycomb’s Management API is generally available to all Honeycomb users. The Honeycomb Management API is a set of endpoints that lets you programmatically set up, configure, and delete queries, datasets, derived columns, and more. With this release, you can now manage Honeycomb with configuration as code either directly via API or with third-party tools, like Terraform, using the community-contributed Honeycomb provider.
Top Observability Strategies for Distributed Systems
In a distributed IT environment, there are a lot of moving parts, and all of them need to be monitored to ensure everything is working as it should. The rise of more complex infrastructures interweaving the cloud, on-premises, and hybrid architectures makes this a challenge. To make sure you have adequate visibility, you need an IT observability strategy.
Improve Monitoring and Observability With The Catchpoint and Sumo Logic Integration
Sumo Logic is a cloud-based log management and analytics service that leverages machine-generated big data to deliver real-time IT insights. We’re excited to share that you can now easily integrate Catchpoint and Sumo Logic, giving you a number of fantastic benefits. The integration involves pushing data from Catchpoint to Sumo Logic using Webhooks and then query the data to build visualizations. Why do we use Webhooks?
Kafka Migration and Lessons Learned
Over the last few months, Honeycomb’s platform team migrated to a new iteration of our ingest pipeline for customer events. Our migration to this newer architecture did not go too smoothly, as can be attested by our status page since February. There were also many near-incidents where we got paged and reacted quickly enough to avoid major issues. We’ve decided to write a full overview of all the challenges we had encountered, which you can can download.
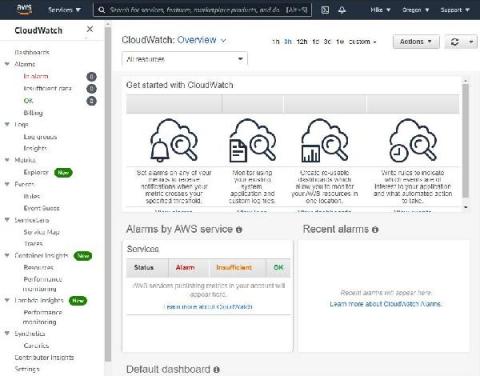
Extend AWS Observability Beyond CloudWatch
How Network Monitoring Takes Observability to the Next Level
With expectations around digital experience never higher, organizations should seriously consider implementing a network monitoring solution to support optimal business performance.
Lightrun Launches Lightrun Cloud: Free Debugger for Developer-Native Observability
Lightrun, the continuous debugging and observability company, today announced the release of a free, self-service version of its popular debugging solution for developers. Lightrun Cloud is not only the most powerful debugger a developer can use to troubleshoot production applications live from within the IntelliJ IDE – but also the easiest to set-up, with a complete self-service experience that gets developers up and running in less than five minutes.


