Operations | Monitoring | ITSM | DevOps | Cloud
July 2022
Adding Code Tags to Your OpenTelemetry Spans
In this article, I’m going to walk you through adding attributes to your spans in.NET that contain information about the code that generated the span. We’ll also look at ways to do this automatically using a library I’ve created.
SOC 2: Data Security For Cloud-Based Observability
As more companies adopt SaaS services over on-premise delivery models, there is a natural concern around data security and platform availability. Words on a vendor’s website can provide insights to prospective customers on the process and policies that companies have in place to alleviate these concerns. However, the old adage of “actions speak louder than words” does apply. Trust in a website’s words only goes so far.
"Why Are My Tests So Slow?" A List of Likely Suspects, Anti-Patterns, and Unresolved Personal Trauma
“Lead time to deploy” means the interval from when the code gets written to when it’s been deployed to production. It has also been described as “how long it takes you to run CI/CD.” How important is it? It’s nigh-on impossible to have a high-performing team if you have a long lead time, and shortening your lead time makes your team perform better, both directly and indirectly.
Ask Miss O11y: My Manager Won't Let Me Spend Any Time Instrumenting My Code
My organization doesn’t want me spending time on instrumenting my product. What can I do? Thanks for the question! You’ll be relieved to hear that you’re in the majority, and also that there are quick (and easy) steps you can do to prove that instrumenting your code is worthwhile.
Extending Visibility Beyond the Edge | Discovering Observability: Session 3
Full-Stack Observability Guide
Like cloud-native and DevOps, full-stack observability is one of those software development terms that can sound like an empty buzzword. Look past the jargon, and you’ll find considerable value to be unlocked from building observability into each layer of your software stack. Before we get into the details of observability, let’s take a moment to discuss the context.
Building a Resilient System: Our Journey to Observability at Intercom
At Intercom, we focus on customer experience above all—our service’s availability and performance is our top priority. That requires a strong culture of observability across our teams and systems. As a result, we invest a lot in the reliability of our application. But unpredictable failures are inevitable, and when they happen it’s humans that fix them. We operate a socio-technical system, and its ability to recover when faced with adversity is called resilience.
Masking Data with Cribl Stream
Executive Lookout: Observing Observability
Splunk Observability is incredibly good at details! Many of us use it as a metaphorical microscope through which we observe our software. But how do you observe the long-term trends and usage of that microscope? There are numerous organization-level metrics provided in Splunk Observability that can be used to chart organization-level concerns. These can be leveraged in various ways to understand things like uptake, billing and just how much value Observability is providing.
The Essential List of Spring Boot Annotations and Their Use Cases
The Spring framework is a robust server-side framework for modern Java-based enterprise applications. Since its introduction in 2003, its advantages have made it one of the most dominant server-side frameworks among many organizations. According to a research study by Snyk in 2020 on the usage of the server-side web frameworks, 50% of the respondents have said they use Spring Boot, and 31% of the respondents use Spring MVC.
Five Blind Spots Solved Through Observability
Authors' Cut-Debugging with the Core Analysis Loop, and What to Build vs Buy
In the old days, the most senior members of an engineering team were the best debuggers. They had built up such an extensive knowledge about their systems that they instinctively knew the right questions to ask and the right places to look. They even wrote detailed runbooks in an attempt to identify and solve every possible issue and possible permutation of an issue.
Unified Observability is the Solution IT Has Been Waiting For
IT teams have been relying on observability tools to (theoretically) provide intelligence and insights into operating conditions within an organization’s digital infrastructure for years. But most of these tools have come with significant shortcomings that leave IT teams wanting more.
Grafana Labs founders on the future of observability and how to scale an open source company
“Overwhelming.” It was the only word Grafana Labs CEO and Co-founder Raj Dutt could use to describe how it felt to look out at the sea of more than 600 Grafanistas gathered together in Whistler, British Columbia, for the first company-wide employee event in two years.
Cisco's new digital convergence
Cisco has unified technologies throughout the decades to provide new value and solutions to its customers and partners. Observability is Cisco’s new convergence frontier.
TransUnion's Steve Koelpin shares his solution to automate log onboarding
The Next Frontier for Observability: Data Ownership with OpenTelemetry
Observability is a mindset that lets you use data to answer questions about business processes. In short, collecting as much data as possible from the components of your business — including applications and key business metrics — then using an AI-powered tool to help consolidate and make sense of this huge volume of data gives you observability into your business. Having observability for your business and applications lets you make smarter decisions, faster.
A Data Lake Is Not Enough to Keep Your Observability Ambitions Afloat
Recently I heard one of our prospects talk about a competitor who was promoting their data lake and ask, how are we different than that? His question got me thinking about why a data lake alone does not provide the depth of observability you really need. The goal of observability is to help SREs, IT Ops and DevOps teams run their IT systems with close-to-zero downtime. Consolidating data from across your environment into a data lake is certainly a good step.
Datasets, Traces, and Spans-Oh My!
If you've stumbled (or purposefully landed) on this blog post, chances are you are new to—or diving deeper—into the observability space, o11y for short. Suffice it to say, you’re not in Kansas anymore. Honeycomb in a lot of ways can serve as a yellow brick road into o11y, and this article should serve as an introduction into how Honeycomb facilitates implementing o11y into applications and distributed services.
Top 12 Site Reliability Engineering (SRE) Tools
Ben Treynor Sloss, then VP of Engineering at Google, coined the term “Site Reliability Engineering” in 2003. Site Reliability Engineering, or SRE, aims to build and run scalable and highly available systems. The philosophy behind Site Reliability Engineering is that developers should treat errors as opportunities to learn and improve. SRE teams constantly experiment and try new things to enhance their support systems.
Tutorial: Setting Up AWS Observability Solution V2.4.0 Using CloudFormation Template
Building a Custom Grafana Dashboard for Kubernetes Observability
Distributed systems open us up to myriad complexities due to their microservices architecture. There are always little problems that arise in the system. Therefore, engineering teams must be able to determine how to prioritize the challenges. Viewing logs and metrics of such systems enables engineers to know the shared state of the system components, thereby informing the decision-making on what challenge needs to be solved most immediately.
Cisco's CX Cloud team talks full-stack observability
Learn how working with AppDynamics as a customer and design partner is helping the Cisco CX team improve Cisco’s offerings to customers via the CX Cloud platform.
How Does Observability Help an Organization Move the Needle?
If you’re new to the concept or just trying to keep up with the conversation, Gartner defines Observability as the evolution of monitoring into a process that offers insight into digital business applications, speeds innovation and enhances customer experience. Some folks think that Observability is a new buzzword, but in fact the term was coined in 1960 by Rudolf E. Kalman, a Hungarian-American engineer.
The Observability Maturity Model Webinar | StackState, TechStrong Research, Ripple X
Getting Started With Observability on Kubernetes | Webinar with Ricardo Santos and Andreas Prins
Observability Again? Oh, Yes.
How real-time Grafana dashboards and alerts combat climate change: Inside Apeel Sciences observability stack
Meet the newest changemakers making an impact in the current climate crisis: Apeel Sciences. The ag-tech company is on a mission to eliminate the 8 percent of greenhouse gas emissions caused by global food waste with their edible, plant-derived food coating, which keeps fruits and vegetables fresh for up to twice as long.
What Is eBPF? A Guide To Improved Observability & Telemetry
Extended Berkeley Packet Filter (eBPF) is an exciting technology that provides secure, high-performance kernel programmability directly from the operating system. It can expose a wide range of applications and kernel telemetry that is otherwise unavailable. But with operating systems frequently processing very large volumes of network data, even with an efficient framework and cheap eBPF program runs, costs can add up quickly.
A to Z With Observability and OpenTelemetry
How do you go from A to Z with observability and OpenTelemetry? This post answers a question we hear often: “How do I get started on instrumentation with OpenTelemetry, while also following best practices for the long-term?” This article is all about taking you from A to Z on instrumentation. This will help you: We will use a simple greeting service application written in Node.js to understand the journey. You can find the pre-instrumented state here.
Building resilience for applications and services with Elastic Observability
Insights from the 2022 Results That Matter study Correlating data across multiple silos and applications to derive meaningful and actionable insights is an ongoing struggle. These challenges are only set to increase as high-speed connectivity becomes more ubiquitous and enables data-heavy, digital experiences.
What Are Some Useful Things to Look for Right Away When You Get Data into Honeycomb?
At Honeycomb, we love involving our customers when we can. We asked: “What was the first thing you found value from with Honeycomb?” Here are some of our favorite answers.
Using Open Source for API Observability
API Observability isn't exactly new, however it's popularity has seen rapid growth in the past few years in terms of popularity. API Observability using open source is different from regular API monitoring, as it allows you to get deeper and extract more valuable insights. Although it takes a bit more effort to set up, once you've got an observability infrastructure running it can be immensely helpful not only in catching errors and making debugging easier, but also in finding areas that can be optimized.
Top Takeaways from Monitorama 2022
Since 2013, Monitorama has been a community-driven conference, bringing together open source development and operations engineers to focus on pushing the boundaries of monitoring software and practices. It’s chock full of thought-provoking content in the conference talks. The casual atmosphere also makes the hallway track a great way to network with fellow engineers and vendors alike to pick up on new developments in the monitoring space.
ManageEngine recognized in the Gartner® Magic Quadrant for Application Performance Monitoring and Observability
7000+ GitHub stars, DIY Query Builder & UX improvements - SigNal 14
Continuous Profiling: A New Observability Signal
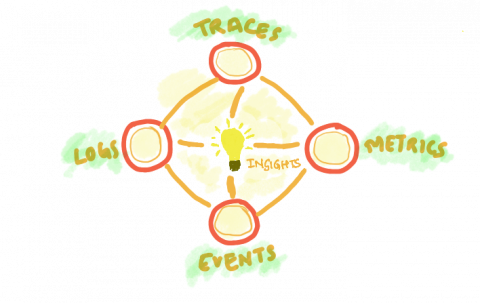
We’ve all grown used to logs, metrics and traces serving as the “three pillars of observability.” And indeed they are very important telemetry signals. But are they indeed the sum of the observability game? Not at all. In fact, one of the key trends in observability is moving beyond the ‘three pillars: One emerging telemetry type shows a particularly interesting potential for observability: Continuous Profiling.
We Learn Systems by Changing Them
It is only possible to come to an understanding of a system of interest by trying to change it. Here, Jackson contrasts action research with old-style hard science, which tries to study a system from the outside. Laboratories draw a line between experiment and scientist. In the social world, there is no outside: we participate in the systems we study. I’ve noticed this in code: when I come to an existing codebase, I get a handle on it by changing stuff.
Data Observability With Robotic Data Automation Fabric
The Cost of Production Blindness
When I speak at conferences, I often fall back to the fact that just a couple of decades ago we’d observe production by kicking the server. This is obviously no longer practical. We can’t see our production. It’s an amorphous cloud that we can’t touch or feel. A power that we read about but don’t fully grasp. In this case, we have physical evidence that the cloud is there. A part of this major shift in our industry is a change to our fundamental roles as engineers.
What is observability? Best practices, key metrics, methodologies, and more
Sometimes the simplest questions prompt the most spirited discussion. Questions like: What is the airspeed velocity of an unladen swallow? What should we have for dinner tonight? Or, as we find out in this episode of “Grafana’s Big Tent" what even is observability?


