Operations | Monitoring | ITSM | DevOps | Cloud
May 2023
Best Bee-haviors: Revamping Feature Flags with Nathan Lincoln
5 Ways You Can Utilize Observability to Make Your Next Migration Easier
When people hear the word “migration,” they typically think about migrating from on-prem to the cloud. In reality, companies do migrations of varying types and sizes all the time. However, many teams delay making critical migrations or technical upgrades because they don’t have the proper tools and frameworks to de-risk the process.
What is an Internal Developer Platform (IDP) and Why It Matters
In today's evolving technological landscape, enterprises are under increasing pressure to deliver high-quality software at an accelerated pace. Internal Developer Platforms (IDPs) provide a centralized developer portal that empowers developers with self-service capabilities, standardized development environments, and automation tools to accelerate the software development lifecycle. In this week's blog, we're taking a closer look at internal developer platforms and how implementing IDPs is helping organizations overcome the complexity of modern software development and increase developer efficiency to accelerate the delivery of software products.
Revolutionizing SAP observability: The Elastic-Kyndryl partnership
Across industries and geographies, businesses rely heavily on Systems Applications and Products (SAP) systems. These powerful and versatile systems streamline operations and manage critical data spanning areas like finance, human resources, and supply chain. However, the real-time monitoring of these systems, with an in-depth understanding of performance metrics and quick anomaly detection, is paramount for smooth operations and business continuity. It's here that our unique offering steps in.
Observability is a practice, not a job
Engineering organizations that ship fast have Observability as part of their core DNA.
How Traceloop Leverages Honeycomb and LLMs to Generate E2E Tests
At Traceloop, we’re solving the single thing engineers hate most: writing tests for their code. More specifically, writing tests for complex systems with lots of side effects, such as this imaginary one, which is still a lot simpler than most architectures I’ve seen: As you can see, when an API call is made to a service, there are a lot of things happening asynchronously in the backend; some are even conditional.
AWS ECS Monitoring | Breaking out of the observability vendor lock-in with SigNoz
Observing the Future: The Power of Observability During Development
Just when you thought everything that could be shifted left has been shifted left, we’re sorry to say you’ve missed something: observability. Modern software development—where code is shipped fast and fixed quickly—simply can’t happen without building observability in before deployments happen. Teams need to see inside the code and CI/CD pipelines before anything ships, because finding problems early makes them easier to fix.
What is Applied Observability?
Understanding Metrics, Events, Logs and Traces - Key Pillars of Observability
Understanding Metrics, Logs, Events and Traces - the key pillars of observability and their pros and cons for SRE and DevOps teams.
Agent and agentless: An ongoing battle
Observability of an SAP environment is critical. Whether you have a large complex and hybrid environment or a small set of simply architected systems, the importance of these systems is probably crucial to your business. Just thinking about system outages keeps us up at night, let alone the pressure of system performance, cross system communication and proper backend processing.
Unleash the power of Elastic and Amazon Kinesis Data Firehose to enhance observability and data analytics
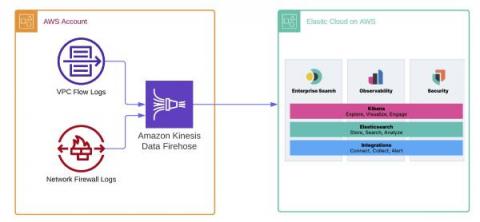
As more organizations leverage the Amazon Web Services (AWS) cloud platform and services to drive operational efficiency and bring products to market, managing logs becomes a critical component of maintaining visibility and safeguarding multi-account AWS environments. Traditionally, logs are stored in Amazon Simple Storage Service (Amazon S3) and then shipped to an external monitoring and analysis solution for further processing.
Datadog vs. Splunk: Which Is the Better Observability Solution [2023 Comparison]
Datadog and Splunk are among the most popular performance monitoring tools available on the market. If you’re looking for such a solution and looking to scratch one off your shortlist, look no further than this article. In this Datadog vs Splunk comparison, we will take a deep dive into everything each tool has to offer. We will point out their similarities and differences to help you decide which tool can meet your needs better.
Developing with OpenAI and Observability
Honeycomb recently released our Query Assistant, which uses ChatGPT behind the scenes to build queries based on your natural language question. It's pretty cool. While developing this feature, our team (including Tanya Romankova and Craig Atkinson) built tracing in from the start, and used it to get the feature working smoothly. Here's an example. This trace shows a Query Assistant call that took 14 seconds. Is ChatGPT that slow? Our traces can tell us!
What is Observability?
“Observability” seems to be the buzzword du jour in IT these days but what does it actually mean, and how is it any different from plain, old monitoring? In simple terms, observability is the ability to understand how a system is performing and how it is behaving from the data that system generates. It is not just about monitoring metrics or collecting logs, but also understanding the context of those metrics and logs, and how they relate to the overall health of the system.
Why Paradigm switched to Grafana Cloud: Inside their observability stack
As the largest liquidity network in crypto, Paradigm facilitates more than $11 billion in monthly volumes, representing nearly 40% global cryptocurrency option flows. Their free-to-use platform provides a single point of access to multi-asset, multi-instrument liquidity on demand, and Software Architect Jameel Al-Aziz leads the team of developers who build and maintain the platform.
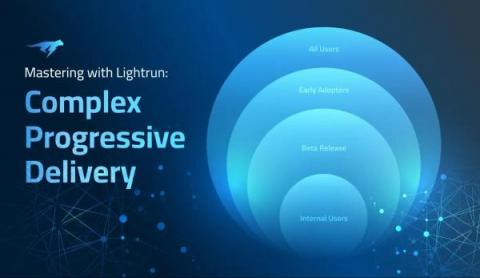
Mastering Complex Progressive Delivery Challenges with Lightrun
Progressive delivery is a modification of continuous delivery that allows developers to release new features to users in a gradual, controlled fashion. It does this in two ways. Firstly, by using feature flags to turn specific features ‘on’ or ‘off’ in production, based on certain conditions, such as specific subsets of users. This lets developers deploy rapidly to production and perform testing there before turning a feature on.
Cribl Stream Production Deployment Guide
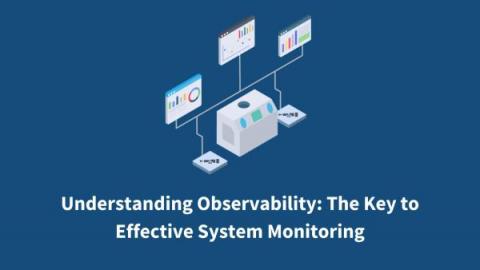
Understanding Observability: The Key to Effective System Monitoring
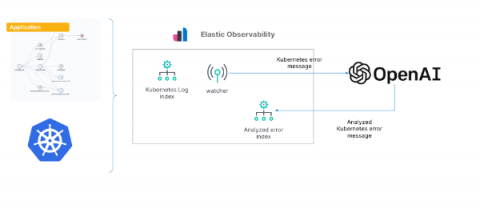
Gain insights into Kubernetes errors with Elastic Observability logs and OpenAI
As we’ve shown in previous blogs, Elastic® provides a way to ingest and manage telemetry from the Kubernetes cluster and the application running on it. Elastic provides out-of-the-box dashboards to help with tracking metrics, log management and analytics, APM functionality (which also supports native OpenTelemetry), and the ability to analyze everything with AIOps features and machine learning (ML).
5 Ways Honeycomb Saves Time, Money, and Sanity
There’s a reason everyone dreads debugging, especially in today’s complex cloud systems: it’s at the high stakes nexus of nervous senior management, overworked engineers, neverending rabbit holes, copious buckets of time, and fickle customers.
Less is more: industry leaders share their success with tool consolidation for maximized productivity
Insights into Observability Tools: Commercial vs. Open-Source
Observability has become a critical aspect of modern software development and operations, allowing organizations to gain insights into the health and performance of their applications and systems. One of the key decisions when implementing observability is choosing between commercial or open-source tools. We spoke to several professionals who shared their experiences and insights on this topic, shedding light on the pros and cons of each approach.
A Systematic Approach to Collaboration and Contributing to the Lattice Design System
The Honeycomb design team began work on Lattice in early 2021. Over several months, we worked to clean up and optimize typography, color, spacing, and many other product experience areas. We conducted an extensive audit of all components, documenting design inconsistencies and laying the foundation for a sustainable design system. However, a more extensive evaluation and audit were necessary before updating or developing components.
There's Nuggets in Them Buckets: How Cribl Search Can Mine Your Observability Lake
Enterprises have enough data, in fact, they are overwhelmed with it, but finding the nuggets of value amongst the data ‘noise’ is not all that simple. It is bucket’d, blob’d, and bestrewn across the enterprise infrastructure in clouds, filesystems, and hosts machines. It’s logs, metrics, traces, config files, and more, but as Jimmy Buffett says, “we’ve all got ’em, we all want ’em, but what do we do with ’em”.
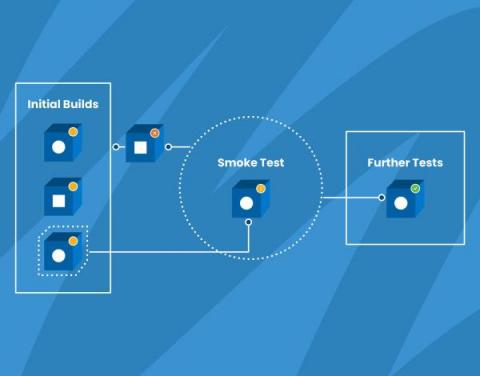
How We Use Smoke Tests to Gain Confidence in Our Code
Wikipedia defines smoke testing as “preliminary testing to reveal simple failures severe enough to, for example, reject a prospective software release.” Also known as confidence testing, smoke testing is intended to focus on some critical aspects of the software that are required as a baseline.
Trace your Azure Function application with Elastic Observability
Adoption of Azure Functions in cloud-native applications on Microsoft Azure has been increasing exponentially over the last few years. Serverless functions, such as the Azure Functions, provide a high level of abstraction from the underlying infrastructure and orchestration, given these tasks are managed by the cloud provider. Software development teams can then focus on the implementation of business and application logic.
Kubernetes Design Patterns For Optimal Observability
Technology is a fast-moving commodity. Trends, thoughts, techniques, and tools evolve rapidly in the software technology space. This rapid change is particularly felt in the software the engineers in the cloud-native space make use of to build, deploy, and operate their applications. One particular area where we see rapid evolution in the past few years/months is Observability.
Maximizing CI/CD Pipeline Efficiency: How to Optimize your Production Pipeline Debugging?
At one particular time, a developer would spend a few months building a new feature. Then they’d go through the tedious soul-crushing effort of “integration.” That is, merging their changes into an upstream code repository, which had inevitably changed since they started their work. This task of Integration would often introduce bugs and, in some cases, might even be impossible or irrelevant, leading to months of lost work.
Three Ways to Make the Most out of Honeycomb Metrics
A while ago, we added Metrics to our observability platform so teams could easily see system information right next to their application observability data—no tool or team switching required. So how can teams get the most out of metrics in an observability platform? We’re glad you asked! We had this conversation with experts at Heroku. They’ve successfully blended metrics and observability and understand what is most helpful to know.
Overcoming Kubernetes Monitoring Challenges with Observability
At Logz.io, we’re seeing a very fast pace of adoption for Kubernetes–at this point, it’s even outpacing cloud adoption, with companies running on-prem fully adopting Kubernetes in production. Why are companies going in this direction? Kubernetes provides additional layers of abstraction, which helps create business agility and flexibility for deploying critical applications. At the same time, those abstraction layers create additional complexity for observability.
IT Operations in 2023: AI/ML & Automation Will Continue to Be the North Star
The use of statistics, advanced algorithms and AI/Ml is becoming omnipresent. The benefits are visible in every walk of life, from web searches, to movie and retail recommendations, to auto-completing our emails. Of course, not many anticipated the dramatic entrance of generative AI in the form of ChatGPT for writing college essays and poetry on arcane topics.
Upgrading NPM and SAM to Hybrid Cloud Observability
Ask Miss O11y: To Metric or to Trace?
Dear Miss O11y, I remember reading quite interesting opinions from you about usage of metrics and traces in an application. Did you elaborate on those points in a blog post somewhere, so I can read your arguments to forge some advice for myself? I must admit that I was quite puzzled by your stance regarding the (un)usefulness of metrics compared to traces in apps in some contexts (debugging).
A Comprehensive Guide to Troubleshooting Celery Tasks with Lightrun
This article explores the challenges associated with debugging Celery applications and demonstrates how Lightrun’s non-breaking debugging mechanisms simplify the process by enabling real-time debugging in production without changing a single line of code.
The Importance of an API Observability Pipeline for SaaS Tools
Third-party APIs and cloud based software as a service (SaaS) tools have become a cornerstone of modern enterprises. It is essential to monitor log data and optimize API performance. This will ensure that development teams provide the desired advantages to clients and users. To address this challenge, businesses can use an observability pipeline. It is a set of tools and processes that monitor and analyze data from various sources. That includes third-party APIs and SaaS tools.
GigaOm Names Broadcom Highest Scoring Leader for Third Straight Year in 2023 Radar Report for Network Observability
Broadcom has been named the highest-scoring vendor for the third consecutive year in a row in the 2023 Radar Report for Network Observability.
Using AIOps effectively with Elastic Observability
Over the past several years, one topic that has become of increasing importance for DevOps and site reliability engineering (SRE) teams is AIOps. Artificial intelligence for IT Operations (AIOps) is the application of artificial intelligence (AI), machine learning (ML), and analytics to improve the day-to-day operational work for IT operations teams.
Our Super Friendly AI Sloth that Analyzes Your Performance Data
Errors Got You Down? Honeycomb and OpenTelemetry are Here to Help
It’s 5:00 pm on a Friday. You’re wrapping up work, ready to head into the weekend, when one of your high-value customers Slacks you that something’s not right. Requests to their service are randomly timing out and nobody can figure out what’s causing it, so they’re looking to your team for help. You sigh as you know it’s one of those all-hands-on-deck situations, so you dig out your phone and type the "going to miss dinner" text.
Observability Challenges Solved with SolarWinds Observability
3 Observability Takeaways from DevOps Pulse 2023
The observability landscape is changing fast, as organizations look to deploy applications and separate themselves from competition at a breakneck pace. What are the trends organizations need to be aware of as they make sense of the landscape? Every year, we at Logz.io set out to answer this question by going right to the DevOps and observability practitioners on the front lines.
Cribl Reference Architecture Series: How SpyCloud Architected its Cribl Stream Deployment
Fully Correlated Serverless Observability
Observability in Action - OpsRamp Demo
8 Best Observability Tools and the Right One for You
For many of us in the software development world, observability tools are a must-have for effectively debugging applications and infrastructure. And doing the job right means selecting the right observability tool. Some might look for a fully featured enterprise solution, while others may simply search for the best open-source solution. But regardless of your approach, you have a number of considerations when selecting the right observability tool.
Feature Focus: April 2023
You know the old saying, I’m sure: “April deploys bring May joys.” Okay, maybe it doesn’t go exactly like that, but after reading what we’ve been up to for the past month, I think it might be time for an update. Let’s dive into our Feature Focus April 2023 edition.
Code Instrumentation Practices to Improve Debugging Productivity
Code instrumentation is closely tied to debugging. Ask one of the experienced developers and they will swear by it for their day-to-day debugging needs. With modest beginnings in the form of print statements that label program execution checkpoints, present-day developers employ a host of advanced techniques for code instrumentation. When carried out in the right way, it improves developer productivity and also reduces the number of intermediate build/deployment cycles for every bug fix.
SIEM Optimizations with Cribl Stream
How to use Elasticsearch and Time Series Data Streams for observability metrics
Elasticsearch is used for a wide variety of data types — one of these is metrics. With the introduction of Metricbeat many years ago and later our APM Agents, the metric use case has become more popular. Over the years, Elasticsearch has made many improvements on how to handle things like metrics aggregations and sparse documents. At the same time, TSVB visualizations were introduced to make visualizing metrics easier.
Kentique - The Fragrance of Observability
RCA Series: Root Cause Analysis in Observability with Elastic AIOps (2/4)
Setting Up a Grafana Destination with BindPlane OP
Scale Your Monitoring and Observability With Sensu
Sensu is the complete cloud monitoring solution for observability at scale, designed to give you rich insight and ensure that you know what’s going on everywhere in your system. With true multi-tenancy, an enterprise datastore that keeps pace as you scale, and streaming handlers to process all those events, you can rely on Sensu for cloud, container, and application performance monitoring that provides deep visibility into your entire infrastructure.
Unpacking the Hype: Navigating the Complexities of Advanced Data Analytics in Cybersecurity
Observability-OSS vs Paid vs Managed OSS
The Reliability industry needs a managed, non-vendor lock-in answer to spiraling costs, high cardinality and the toil of managing a tsdb.
Observability: What Is It and What Tools Should You Be Using?
A Simplified Guide to Implementing Full-Stack Observability
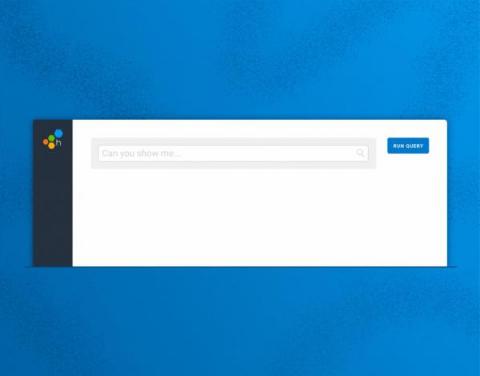
Observability, Meet Natural Language Querying with Query Assistant
Engineers know best. No machine or tool will ever match the context and capacity that engineers have to make judgment calls about what a system should or shouldn’t do. We built Honeycomb to augment human intuition, not replace it. However, translating that intuition has proven challenging. A common pitfall in many observability tools is mandating use of a query language, which seems to result in a dynamic where only a small percentage of power users in an organization know how to use it.
Code Instrumentation in Cloud Native Applications
Cloud native is the de facto standard approach to deploying software applications today. It is optimized for a cloud computing environment, fosters better structuring and management of software deployments. Unfortunately, the cloud native approach also poses additional challenges in code instrumentation that are detrimental to developer productivity.
IOException in Java
IOException is the most generic exception in a large group of Java exceptions that express input/output and networking errors in Java applications.
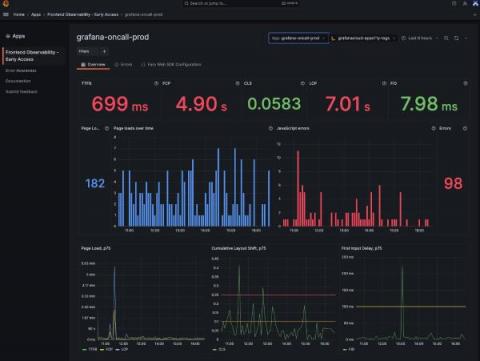
Gain real user monitoring insights with Grafana Cloud Frontend Observability
At ObserabilityCON 2022, we announced a limited private preview program for Grafana Cloud Frontend Observability, our hosted service for real user monitoring. Today we are excited to introduce a public preview program that makes Frontend Observability accessible to all Grafana Cloud users, including those in our generous free-forever tier. Simply look for Frontend under Apps in the left-hand navigation of the Grafana Cloud UI and click through to set up the feature. (Not a Grafana Cloud user?
Remote Query Solves the Observability Data Problem
We are caught in a whirlwind of rapid data change. As more engineers, services and sophisticated practices are helping generate an astronomical amount of digital information, there’s a growing challenge of the data explosion. Coralogix offers a completely unique solution to the data problem. Using Coralogix Remote Query, the platform can drive cost savings without sacrificing insights or functionality.
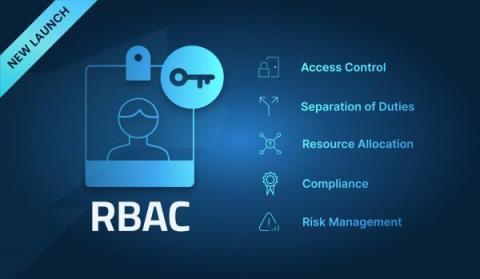
Lightrun Bolsters Security Measures with Role-Based Access Control (RBAC)
Lightrun enhances its enterprise-grade platform with the addition of RBAC support to ensure that only authorized users have access to sensitive information and resources as they troubleshoot their live applications. By using Lightrun’s RBAC solution, organizations can create a centralized system for managing user permissions and access rights, making it easier to enforce security policies and prevent security breaches.
Our Favorite #chArt
Heatmaps are a beautiful thing. So are charts. Even better is that sometimes, they end up producing unintentional—or intentional, in the case of our happy o11ydays experiment—art. Here’s a collection of our favorite #chArt from our Pollinators Slack community. Today would be a great time to join if you’re into good conversation about OpenTelemetry, Honeycomb-y stuff, SLOs, and obviously, art.


