Operations | Monitoring | ITSM | DevOps | Cloud
July 2023
Sumo Logic Customer Brown Bag - Observability - July 31st, 2023
Using Generative AI with Elastic AI Assistant for Observability
How to Implement Cloud Cost Optimization in Observability
Although microservices and cloud architectures are the new norm for modern applications, cloud cost optimization could run high in observability. High costs are largely due to the number of components involved in cloud architectures. According to Cloud Data Insights in a recent report, around 71% of IT companies say that cloud observability logs are growing at an alarming rate— a driving factor for rising observability costs.
CriblCon 2023 Keynote Session
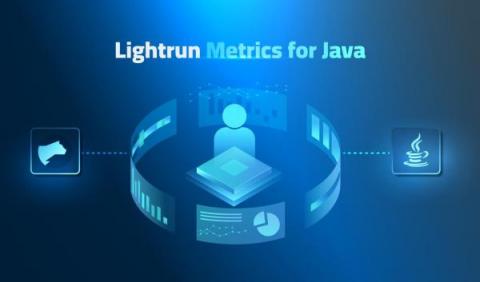
Lightrun Empowers Developers with Next Generation Metric Tools for Java Performance Troubleshooting
When it comes to debugging performance related issues, the range of these issues together with their root cause can be overwhelming to developers.
Top PostgreSQL Monitoring Tools in 2023
Continuous Observability: Shedding Light on CI/CD Pipelines
DevOps is not just about operating software in production, but also releasing that software to production. Well-functioning continuous integration/continuous delivery (CI/CD) pipelines are critical for the business, and this calls for quality observability to ensure that Lead Time for Changes is kept short and that broken and flaky pipelines are quickly identified and remediated.
Cribl Stream Projects
Latest Developments in Monitoring and Observability, 2023
You know it’s going to be a great day when you find yourself mentioned as a Sample Vendor on the Gartner® Hype Cycle™ report for Monitoring and Observability, 2023(July 2023). The OnPage team is thrilled to share with its community that we have been mentioned as a Sample Vendor by Gartner on their latest Hype Cycle for Monitoring and Observability. OnPage is recognized as a Sample Vendor, specifically within the Automated Incident Response category.
Cisco AppDynamics launch The Age of Application Observability report highlighting how business leaders lack knowledge in security management
Application Observability: A critical priority to optimize application performance and accelerate innovation
Research published by Cisco AppDynamics highlights the challenges that IT teams are facing in managing application availability and performance within hybrid IT environments. The new report, The Age of Application Observability, reveals the levels of complexity that technologists are encountering as they implement cloud native technologies alongside existing on-premises applications and infrastructure.
The Evolution of Sampling in Honeycomb: Introducing Refinery 2.0
Honeycomb's Refinery is a tool that customers can use to help manage the volume of their telemetry. It's rare to have too much telemetry—it's not often that someone says "I wish I didn't have all this information!" However, telemetry is data, and data is not necessarily information—particularly when you’re drowning in it. Honeycomb's query engine is so fast and powerful that many customers can send us all their telemetry.
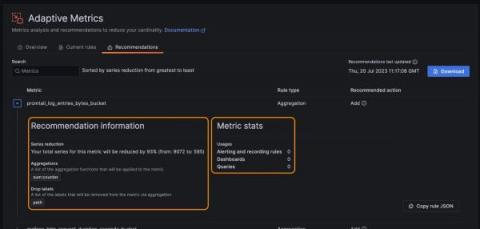
5 steps to start saving on your observability bill with Grafana Cloud Adaptive Metrics
In the observability space, it seems like everyone is talking about how to reduce costs and control the explosion of Prometheus metrics. It’s no wonder — our recent analysis of user environments suggests 20% to 50% of metrics generated are never used, but users are still stuck paying for them.
Enhancing Observability Through Open Telemetry, industry trends and gaps to be considered
Datadog and BigPanda: Observability and AIOps made better together
Datadog’s modern observability empowers development engineers with full-stack visibility, comprehensive instrumentation generation, and proactive alerts to accelerate software development releases and address potential incidents. While Datadog gives teams end-to-end visibility, it works even better together with AIOps from BigPanda – development teams gain insights into outside application dependencies and reliance on other systems.
Up to 70% metrics storage savings with TSDS enabled integrations in Elastic Observability
The latest versions of Elastic Observability’s most popular observability integrations now use the storage cost-efficient time series index mode for metrics by default. Kubernetes, Nginx, System, AWS, Azure, RabbitMQ, Redis, and more popular Elastic Observability integrations are time series data stream (TSDS) enabled integrations.
Breaking Down the Pillars of Observability from Data to Outcomes
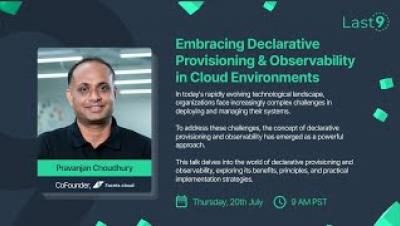
Webinar: Embracing Declarative Provisioning and Observability in cloud environments
Full-stack observability starts with APM and AppDynamics
How AppDynamics APM, Cloud Native Application Observability and the Cisco FSO Platform can provide a full-stack, holistic view of application performance, user experience, security posture and business impact. Recently, a customer asked me how Cisco’s investment in full-stack observability benefits traditional AppDynamics customers. To answer, first, let’s take a moment to discuss how Cisco AppDynamics fits into Cisco Full-Stack Observability.
Leading on full-stack observability: once you have the logs, the rest is easy
OpenMetrics vs OpenTelemetry - How to choose?
A Software Developer's Guide to Getting Started With Kubernetes: Part 2
In Part 1 of this series, you learned the core components of Kubernetes, an open-source container orchestrator for deploying and scaling applications in distributed environments. You also saw how to deploy a simple application to your cluster, then change its replica count to scale it up or down. In this article, you’ll get a deeper look at the networking and monitoring features available with Kubernetes.
OpenTelemetry vs Prometheus
Incident Management Steps and Best Practices
According to the Uptime Institute’s 2022 Outage Analysis report, one out of every five companies has experienced a “serious” or “severe” incident over the past three years—a percentage that’s increasing. Those incidents are expensive: over 60% cost more than $100,000, while 15% set their companies back close to $1 million.
4 Observability Metrics Examples to Overcome Big Challenges
Having a strong full-stack observability has become increasingly crucial in modern IT environments, as organizations strive to gain deep insights into their systems’ behavior, performance and overall health. However, achieving effective observability can be challenging without the right tools and strategies in place. In this article, we will explore the key challenges associated with observability and how Coralogix can help overcome those issues.
The Great Network Observability Debate
You may have heard the term “network observability” regarding solutions that offer a deep and contextual view into the network. You’ve likely heard other terms, such as ‘network visibility,’ “network visualization” and of course “network monitoring.” But, experts argue, what these terms each truly means is still open for debate.
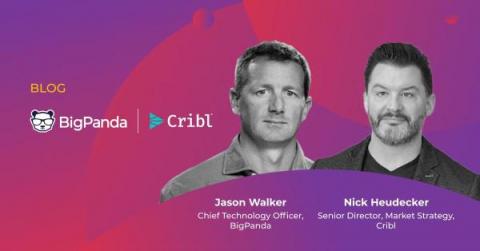
BigPanda-Cribl Integration: Stronger actionable insights within your observability data
Overwhelming volumes and varieties of observability data most businesses encounter on a daily basis is impossible for IT operations teams to manually sift through successfully. This can be a troubling reality when frequent high-value business data is required to consistently maintain the uptime and integrity of your services and applications.
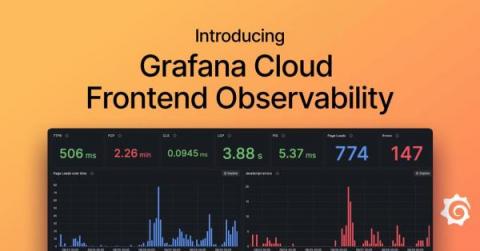
Real user monitoring in Grafana Cloud: Get frontend error tracking, faster root cause analysis, and more
The frontend of a web application is the part that users directly interact with. It’s the last mile of the digital service you deliver to your customers and it’s directly associated with customer satisfaction and business objectives. Knowing performance metrics such as CPU or memory is helpful, but at the end of the day, what you care most about is if the user experience is affected.
How real user monitoring works in Grafana Cloud Frontend Observability
The Hidden Challenges of Troubleshooting Legacy and Monolithic apps in Production
Debugging in production is always a necessary evil. No matter how well your code is written and reviewed, bugs are bound to appear, and their consequences are there for your users to see. While debugging any app has challenges, debugging legacy systems is a different ballgame. From unfamiliarity with the codebase to a lack of knowledge about the tech, your developers can find themselves aimlessly searching for solutions where solutions don’t exist.
AppDynamics Cloud is now Cloud Native Application Observability, powered by the Cisco Full-Stack Observability Platform
AppDynamics Cloud is now Cloud Native Application Observability powered by Cisco Full-Stack Observability (FSO) Platform. With Cisco FSO Platform extensibility, the introduction of new modules will extend observability use cases supported by Cloud Native Application Observability. In addition, we are expanding our Multi-Cloud Observability strategy to include visibility into Google Cloud Platform with this release.
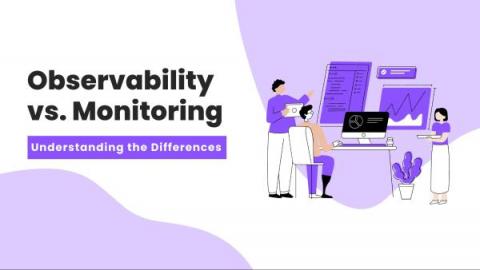
Observability vs. Monitoring: Understanding the Differences
This post was written by Siddhant Varma. Scroll down to read the author’s bio. Software development isn’t just about building and deploying software. There’s a wide range of operations and activities you need to tackle even after you’ve successfully deployed it. The two most common are observability and monitoring. While they’re similar in a lot of ways, it’s important to understand that they are not exactly the same, and each has its own purpose.
Evolving by Involving
The customer success department at Honeycomb features a number of different roles dedicated to helping our customers succeed in every step of their observability journey. The work we do ranges from support engineers who provide timely assistance to customers, to customer architects who dive deep into the technical stuff, to product training who educate folks on features old and new.
Observability-Driven Development Explained: 8 Steps for ODD Success
Super Mario World Meets Observability Pipelines: Unlocking the Power of Data with BindPlane
Datadog Alternatives in 2023
Unify Infrastructure and Application Observability with Logz.io's Service Overview
Logz.io is excited to announce Service Overview, a fast and easy way to unify telemetry data and insights across your infrastructure and applications into a single interface. Our Beta users have reported simplified observability, faster time-to-insights, and observability consolidation.
Observing Core Web Vitals with OpenTelemetry
Core Web Vitals (CWV) are Google's preferred metrics for measuring the quality of the user experience for browser web apps. Currently, Core Web Vitals measure loading performance, interactivity, and visual stability. These are the main indicators of what a user’s experience will be while using a web page.
Data Observability: An Introductory Guide
As more companies rely on data insights to drive critical business decisions, data must be accurate, reliable, and of high quality. Gaining insights from data is essential, but so is the data’s integrity so that you can be sure that data isn’t missing, incorrectly added, or misused. This is where data observability comes in.
Exploring Nginx metrics with Elastic time series data streams
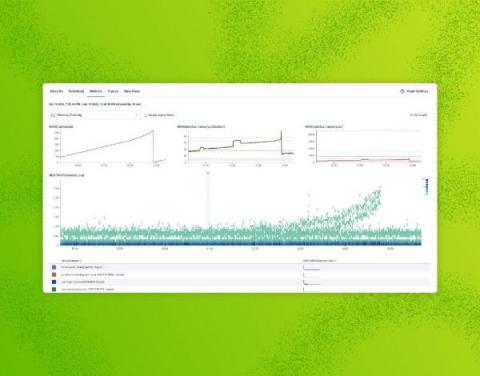
Elasticsearch® recently released time series data streams for metrics. This not only provides better metrics support in Elastic Observability, but it also helps reduce storage costs. We discussed this in a previous blog. In this blog, we dive into how to enable and use time series data streams by reviewing what a time series metrics document is and the mapping used for enabling time series. In particular, we will showcase this by using Elastic Observability’s Nginx integration.
ServiceNow is a Visionary in the Gartner Magic Quadrant for Application Performance Monitoring and Observability
I’m thrilled to announce that ServiceNow has been recognized as a Visionary in the 2023 Gartner® Magic Quadrant™ for Application Performance Monitoring (APM) and Observability. We believe this validates our strong vision and unique ability to help customers bring unified telemetry into their existing ServiceNow® Event Management and Service Operations solutions, reduce mean time to resolution (MTTR), and accelerate innovation.
Sentry vs Datadog - Detailed Comparison
Logz.io Named Visionary in 2023 Gartner Magic Quadrant for Application Performance Monitoring and Observability
Consistent performance and continuous improvement: these are the fundamentals we should aspire to in the world of cloud software delivery. We focus on ensuring our systems become more consumable, enjoyable and innovative. We seek to make customers’ lives easier and more productive through incremental achievements, and doing a better job, every day.
We Did it Again: We're a Leader in 2023 Gartner Magic Quadrant for APM & Observability for the Second Year in a Row
When the Gartner Magic Quadrant Report came out in 2022, we did the professional equivalent of a spit take, then cheered wildly. NOT ONLY did they include observability for the first time ever in their newly revamped 2022 Magic Quadrant for APM & Observability, but they also put us in the Leader Quadrant—our debut appearance!
Datadog named Leader in 2023 Gartner Magic Quadrant for APM and Observability
We are thrilled to announce that, for the third consecutive year, Datadog has been named a Leader in the 2023 Gartner® Magic Quadrant™ for APM and Observability. We believe that this placement reflects Datadog’s continued commitment to understanding our customers’ most complex challenges and building products and services that give them the visibility they need into their applications.
How Metrics Behave in Honeycomb
Honeycomb has the ability to receive events from applications. These events can take the shape of Honeycomb wide events, OpenTelemetry trace spans, and OpenTelemetry metrics. Because Honeycomb’s backend is very flexible, these OpenTelemetry signals fit in just fine—but sometimes, they have a few quirks. Let’s dive into using metrics the Honeycomb way and cover a few optimizations.
Integrating Cisco AppDynamics and Cloud Native Application Observability for unified hybrid cloud monitoring
Cisco AppDynamics has reached a significant milestone in supporting traditional and modern application monitoring use cases with AppDynamics and Cloud Native Application Observability (formerly AppDynamics Cloud). Many enterprises have yet to complete their journey to modern cloud native architectures, but most have started embracing such a move.
ML Observability: what, why, how
4 Tips to Reduce Your Observability Costs
Observability is essential for maintaining the performance and reliability of modern software systems. However, the cost associated with attaining and extending observability can quickly escalate in ways that may not even seem apparent at first. We hear from many organizations struggling to tamp down the costs of observability at a time when every dollar spent on technology is scrutinized.
Driving Exceptional Support: Unleashing Support Power with Honeycomb
In technical support, ensuring customer satisfaction and quickly resolving issues are of utmost importance. At Honeycomb, we embrace a comprehensive approach by using our own platform—not only for engineering purposes, but to also empower our support team. By utilizing Honeycomb, our support engineers can monitor, troubleshoot, and investigate customer issues with great efficiency.
Observability: How to Boost Gaming Performance in 5 Ways
For a game to provide the best user experience, certain elements come into play. These factors can be hardware components in the user’s computer, like the CPU and GPU, operating system settings, or specific game settings. In fact, if there’s misalignment between these components and a game’s intensity, performance issues can crop up. The most common performance issues in gaming include frame rate drops, input lag, stuttering, rendering issues and network latency.
Improve MTBF and MTTR for your Application Platforms by using MESH Observability
When businesses look at how best to understand the performance levels of their platforms, some of the best incident management metrics to look at are Mean Time Between Failures (MTBF) and Mean Time ToResolution(MTTR). These two measurements will give an excellent indication of the health and speed of the system, as well as the ability of the platform to take care of any anomalies that have been detected or to flag them up for others to take action to resolve them.


