Operations | Monitoring | ITSM | DevOps | Cloud

January 2024

Evaluating New Tools with Cribl

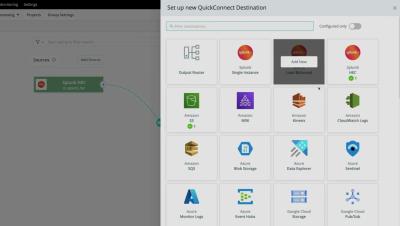
Discover how Cribl's suite of products can be utilized to assess security and analytics tools, thereby reducing the duration of POVs and simplifying the process of tool migrations. Cribl, the Data Engine for IT and Security, empowers organizations to transform their data strategy. Customers use Cribl's suite of products to collect, process, route, and analyze all IT and security data, delivering the flexibility, choice, and control required to adapt to their ever-changing needs.

The Rise of Applied Observability, AIOps, and GenAI in Enterprises

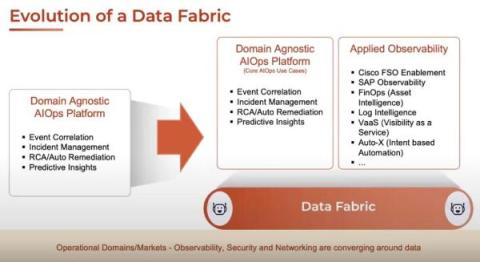
CloudFabrix’s Macaw Conference for Observability and AIOps garnered traction and showcased modern solutions to modern IT problems in enterprises. This is a summary of the conference. CloudFabrix CMO – Shailesh Manjrekar kicked off the conference by delivering the keynote by talking about the General Market Trends & highlighting the Modern IT challenges faced by Enterprises during their Digital Transformation journey.
Sponsored Post

5 Guiding Principles of Digital Business Observability

Modern data-driven organizations are synergizing operations observability, business intelligence, and data science with digital business observability programs that break down data silos, increase productivity, and drive innovation. Digital business observability combines IT and business data with cutting-edge data science techniques, enabling deeper analysis and unlocking valuable insights that propel innovation across use cases from sales and marketing to product design and financial operations.

Seven innovative observability features to explore in the new year

See some of our recent observability feature and product releases that correlate application security and performance with your business critical KPIs. In our latest App Attention Index, consumers showed unprecedented levels of scrutiny when it comes to app experiences, with nearly two-thirds (62%) revealing their digital expectations are far higher now than they were just two years ago. In fact, 77% reported discontinued use or deletion of an app due to poor performance — within the past year.

Micrometer: The Gold Standard in Observability

In the dynamic realm of observability frameworks, one name stands out as the unspoken gold standard with the ability to guide developers through the intricacies of monitoring and data collection. Let’s look at the heart of open-source technologies and uncover the essence of a tool that has become the industry's beacon of excellence.

Getting Started with OpenTelemetry Visualization

OpenTelemetry is a Cloud Native Computing Foundation(CNCF) project aimed at standardizing the way we instrument applications for generating telemetry data(logs, metrics, and traces). However, OpenTelemetry does not provide storage and visualization for the collected telemetry data. For OpenTelemetry visualization, you need to use a backend that can ingest the collected data and provide a web UI to visualize it.

Up Your Observability Game With Attributes

Splunk Observability Cloud includes powerful features which automatically identify patterns within your data to surface trends. The resulting insights tell you why some customers aren’t getting an optimal experience from your application, and how you can improve it. Unlocking these features requires attributes to be included with your application traces. But how do you know which attributes are the most valuable for your application and business?

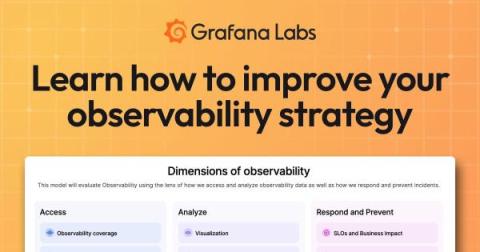
How to improve your observability strategy: Introducing the Observability Journey Maturity Model

While many segments of the IT market move quickly, the observability space seems to move at lightning speed. Fueled by open source innovation, observability toolsets and best practices constantly evolve. Sometimes, it can be tough to keep up — and even tougher to know where your own observability strategy stands. That’s the exact challenge we aim to address with our new Observability Journey Maturity Model.

5 Important Reasons Why You Need Application Observability

Application performance monitoring (APM) has been around for a long time. Odds are if you’re tasked with overseeing app performance, you’ve had to deal with this technology to get an understanding of your applications and any issues that can arise in the name of troubleshooting. But there’s a new approach you should consider: application observability.

Now Available: Honeycomb Launches Data Residency in Europe

At Honeycomb, we are very concerned about privacy and data sovereignty—it’s something we take very seriously, and in an effort to serve our customers better, we’re thrilled to announce that we now offer data residency in Europe. This new instance will allow Honeycomb customers to store their data in the US, in Europe, or both. Let’s talk about the details.

Elastic Observability monitors metrics for Microsoft Azure in just minutes

Developers and SREs choose Microsoft Azure to run their applications because it is a trustworthy world-class cloud platform. It has also proven itself over the years as an extremely powerful and reliable infrastructure for hosting business-critical applications. Elastic Observability offers over 25 out-of-the-box integrations for Microsoft Azure services with more on the way. A full list of Azure integrations can be found in our online documentation.

Navigating IT and Security Consolidation in 2024

Please join Cribl’s Ed Bailey and Jackie McGuire for a dynamic discussion around IT and Security vendor consolidation in 2024. The current economic landscape poses challenges for companies to sustain operations without being profitable or having a clear path to profitability. As a response, businesses are either merging with similar companies or becoming part of larger entities through acquisitions. Change is afoot, so join the conversation as we dive into the ongoing transformations, discussing the implications for security and observability. Get ready for an engaging discussion.

Inside TeleTracking's journey to build a better observability platform with Grafana Cloud

Oren Lion, Director of Software Engineering, Productivity Engineering, and Tim Schruben, Vice President, Logistics Engineering, both work for TeleTracking, an integrated healthcare operations platform provider that is Expanding the Capacity to Care™ by helping health systems optimize access to care, streamline care delivery, and connect transitions of care.

Observability with OpenTelemetry and Checkly

Observability isn't just a buzzword; it's a vital compass guiding us through the maze of system health and performance. As we’ve adopted microservice architectures, the ability to know ‘what is currently happening in our system’ has diminished as our operational resilience has increased. We find services scattered among a maze of interconnections and interdependencies. And even the logs that used to guide are now scattered throughout this maze.

Introducing 'Cribl Stream Fundamentals'

Join Cribl's Ed Bailey and Cjapi's James Curtis for an engaging discussion about James' new book, 'Cribl Stream Fundamentals.' We will explore why James wrote the book and what he plans next. Additionally, we'll discuss his perspective on the challenges practitioners will face in 2024 and how teams should prepare for the year ahead.

Getting started with Application Observability for Java

Links: Description: Get started with instrumenting Java applications with Grafana Cloud to observe them, detect anomalies, and find root causes. In this video, Grafana Developer Advocate Leandro Melendez outlines how to quickly get started with Application Observability for Java based on these three easy steps: Download the Grafana instrumentation agent Instrument an application and send telemetry data to the Grafana Cloud OTLP Endpoint Observe the service in Application Observability.

The Cost Crisis in Observability Tooling

The cost of services is on everybody’s mind right now, with interest rates rising, economic growth slowing, and organizational budgets increasingly feeling the pinch. But I hear a special edge in people’s voices when it comes to their observability bill, and I don’t think it’s just about the cost of goods sold.

Why Splunk customers face a choice for observability and modernization

Elastic Observability is fast, simple, and built for the future Businesses everywhere are facing a challenging environment: increased cost pressures coupled with high volumes of data generated by complex, distributed, cloud-native environments. As a result, teams need smarter analytics, access, and retention across all their data — instantly and from anywhere — to resolve issues, make decisions, and ensure resiliency.

Elastic recognized with 2024 EMA Allstars award for its AI-assisted observability

We are thrilled to be recognized with the 2024 EMA Allstars award. This award acknowledges Elastic’s focus on delivering a full-stack observability solution that provides unified visibility and AI-powered insights into complex hybrid cloud deployments. The EMA Allstars award celebrates trailblazers and innovators who are reshaping the enterprise technology landscape.

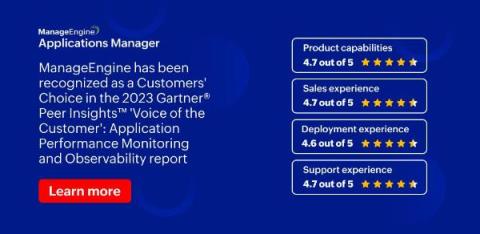
We've done it again: ManageEngine named a 2023 Gartner Peer Insights Customers' Choice for Application Performance Monitoring and Observability!

At ManageEngine, customers are at the heart of everything we do. That’s why we are excited to be recognized as a 2023 Gartner Peer Insights™ Customers’ Choice for Application Performance Monitoring and Observability. This year marks the fifth time we have been recognized with this distinction.

Alerts Are Fundamentally Messy

Good alerting hygiene consists of a few components: chasing down alert conditions, reflecting on incidents, and thinking of what makes a signal good or bad. The hope is that we can get our alerts to the stage where they will page us when they should, and they won’t when they shouldn’t. However, the reality of alerting in a socio-technical system must cater not only to the mess around the signal, but also to the longer term interpretation of alerts by people and automation acting on them.

Effective Trace Instrumentation with Semantic Conventions

There’s plenty of literature on the mechanics of instrumenting code with OpenTelemetry and delivering it to Honeycomb. However, I’ve not found many guides on the craft of instrumenting code in order to have a good observability experience in your system. A lot of focus is placed on automatic instrumentation—which is great, particularly if you’re new to observability or retrofitting—but it misses the power of good instrumentation at the application level.

Observability vs. Monitoring: Decoding Key Distinctions

In the evolving digital landscape, transformation has become a necessity for businesses in order to stand out and remain competitive. As per stats records, around 91% of businesses use digital technologies and platforms to run their business more successfully. With excessive dependency on digital technologies, there also comes the challenge of navigating through the complex web of dependencies and interactions.

Elastic Observability 8.12: GA for AI Assistant, SLO, and Mobile APM support

Elastic® Observability 8.12 announces general availability (GA) for the AI Assistant, Service Level Objectives (SLO), and Mobile APM support: Elastic Observability 8.12 is available now on Elastic Cloud — the only hosted Elasticsearch® offering to include all of the new features in this latest release. You can also download the Elastic Stack and our cloud orchestration products, Elastic Cloud Enterprise and Elastic Cloud for Kubernetes, for a self-managed experience.

Monitoring-as-Code for Scaling Observability

As data volumes continue to grow and observability plays an ever-greater role in ensuring optimal website and application performance, responsibility for end-user experience is shifting left. This can create a messy situation with hundreds of R&D members from back-end engineers, front-end teams as well as DevOps and SREs, all shipping data and creating their own dashboards and alerts.

Observability and Telecommunications Network Management [Part 1]

The border between the management of telecommunications networks and the services that they support and the management of IT infrastructures and the applications that they support has always been a porous one. One might say that they are like two dialects of the same language rather than different languages. Nonetheless, these areas, whether characterised by technology or practice, are different and have, for the most part, been served by different vendors and products.

How We Leveraged the Honeycomb Network Agent for Kubernetes to Remediate Our IMDS Security Finding

Picture this: It’s 2 p.m. and you’re sipping on coffee, happily chugging away at your daily routine work. The security team shoots you a message saying the latest pentest or security scan found an issue that needs quick remediation. On the surface, that’s not a problem and can be considered somewhat routine, given the pace of new CVEs coming out. But what if you look at your tooling and find it lacking when you start remediating the issue?

Exploring Observability's Role in Retail & E-Commerce

For retailers and ecommerce store owners, your bottom line is always affected whenever your service is down, due to today's consumers expecting their digital interactions to operate around the clock. This is particularly crucial during spikes in traffic due to sales, like Black Friday or Cyber Monday.

The Last Mile of Observability - Fine-Tuning Notifications for More Timely Alerts

No one wants to get an alert in the middle of the night. No one wants their Slack flooded to the point of opting out from channels. And indeed, no one wants an urgent alert to be ignored, spiraling into an outage. Getting the right alert to the right person through the right channel — with the goal of initiating immediate action — is the last mile of observability.

Unified Observability: The Right Way Ahead

Observability, in modern software engineering, has evolved into a paramount concept, shedding light on the intricate inner workings of complex systems. Three essential pillars support this quest for clarity: logging, traces, and metrics. These interconnected elements collectively form the backbone of observability, enabling us to understand our software as never before. Think of a system as a bustling city.

Observability vs. APM: What to Know on Your Monitoring Journey

In the ever-evolving landscape of software development and IT operations, monitoring tools play a pivotal role in ensuring the performance, reliability, and availability of your applications. Two key disciplines in this domain are observability and Application Performance Management (APM). This post will help you understand the nuances between observability and APM, exploring their unique characteristics, similarities, benefits and differences.

Choosing the Right Observability Tools for Developers

This is the third and final blog post in a series about shifting Observability left. If you have not yet read the first two, you can find the first post here and the second post here. Observability is fundamental to modern software development, enabling developers to gain deep insights into their application’s behavior and performance.

Building a Secure OpenTelemetry Collector

The OpenTelemetry Collector is a core part of telemetry pipelines, which makes it one of the parts of your infrastructure that must be as secure as possible. The general advice from the OpenTelemetry teams is to build a custom Collector executable instead of using the supplied ones when you’re using it in a production scenario. However, that isn’t an easy task, and that prompted me to build something.

The Role of Observability in Media and Entertainment

Digital transformation is at the core of media and entertainment organizations, it’s vital for these firms to constantly evolve to provide the best user experience to their customers. These companies must seek new and interesting content, services, and tailored offerings that enhance the audience’s experience and supply personalization. However, whilst these investments are essential to remain competitive, they’re also particularly costly.

What is Observability? Monitoring vs Observability

When the process of an application malfunctions, it can have a negative impact on users and the business. Companies need a way to identify and resolve the root cause of problems smartly. This is where monitoring and observability come in. Monitoring and observability are two methods for identifying the underlying cause of problems. Observability in IT is a concept that goes further than simple monitoring.
Observability trends and predictions for 2024: CI/CD observability is in. Spiking costs are out.

From AI to OTel, 2023 was a transformative year for open source observability. While the advancements we made in open source observability will be a catalyst for our continued work in 2024, there is even more innovation on the horizon. We asked seven Grafanistas to share their predictions for which observability trends are on their “In” list for 2024. Here’s what they had to say.

Looking at nth degree's Innovative Fractional Service Delivery Model

The nth degree team joins Cribl's Ed Bailey and Andrew Duca to discuss nth degree's innovative fractional service delivery model. This is a discussion anyone who has had to engage professional services should be interested in hearing. nth degree has developed a service delivery model that enables fast engagement and removes friction around service delivery and planning. Imagine not having to get an SOW reviewed by legal for every engagement. That alone solves a big problem for almost everyone.
The Future of Higher Education: Observability As A Strategic Asset

Schools, universities and other organizations within higher education have been shifting to modernize their learning experiences. With the intake of new students each year, some of these being based remotely, these organizations are seeking to manage large-scale and highly distributed infrastructure.

Escaping the Cost/Visibility Tradeoff in Observability Platforms

For developers, understanding the performance of shipped code is crucial. Through the last decade, a tablestake function in software monitoring and observability solutions has been to save and track app metrics. Engineers love tools that get out of your way and just work, and the appeal of today’s best-in-class application performance monitoring (APM) suites lies in a seamless day zero experience with drop-in agent installs, button click integrations, and immediate metrics collection.

3 Straightforward Pros and Cons of Datadog for Log Analytics

Observability is a key pillar for today’s cloud-native companies. Cloud elasticity and the emergence of microservices architectures allow cloud native companies to build massively scalable architectures but also exponentially increase the complexity of IT systems.

Harmony in Chaos: Uniting Team Autonomy with End-to-End Observability for Business Success

Imagine a symphony where every musician plays their part flawlessly, but without a conductor to guide the orchestra, the result is just a discordant mess. Now apply that image to the modern IT landscape, where development and operations teams work with remarkable autonomy, each expertly playing their part. Agile methodologies and DevOps practices have empowered teams to build and manage their services independently, resulting in an environment that accelerates innovation and development.

With OpenTelemetry, ComplyAdvantage overhauled its observability (twice)

ComplyAdvantage, which provides compliance and risk management tools, has overhauled its observability platform twice in two years, first moving from on-prem Grafana OSS to Datadog, and then migrating from Datadog to Grafana Cloud. Join Principal SRE Adam Wilson to hear how his team’s approach to observability evolved, and how their increased OTel usage made it possible to migrate twice — and to get the most out of Grafana Cloud for metrics, logs, traces, Kubernetes monitoring, and more.

Product Managing to Prevent Burnout

I’m currently working on a small team within Honeycomb where we’re building an ambitious new feature. We’re excited—heck, the whole company is—and even our customers are knocking on our door. The energy is there. With all this excitement, I’ve been thinking about a risk that—if I'm not careful—could severely hinder my team's ability to ship on time, celebrate success, and continue work after launch: burnout.

Lightrun LogOptimizer Gets A Developer Productivity and Logging Cost Reduction Boost

Lightrun’s LogOptimizer stands as a groundbreaking automated solution for log optimization and cost reduction in logging. An integral part of the Lightrun IDE plugins, this tool empowers developers to swiftly scan their source code—be it a single file or entire projects—to identify and replace log lines with Lightrun’s dynamic logs, all within seconds.

Committed to Observability Excellence: Logz.io's Open 360 Observability Platform Takes Home Over a Dozen Winter G2 Badges

As we continue to iterate and help organizations meet their observability goals, Logz.io is thrilled to announce we’ve earned over a dozen Winter 2023 G2 Badges for our Logz.io Open 360™ essential observability platform! G2 Research is a tech marketplace where people can discover, review, and manage the software they need to reach their potential. Here are the Winter 2023 G2 Badges we’ve taken home for Application Performance Monitoring (APM) and Log Analysis.

How Observability Enhances Financial Services

Financial services and financial technology (FinTech) companies often depend upon complex infrastructure to handle their financial data. Security and compliance are paramount for these organizations, for gaining full visibility into the health and performance of these services to guarantee security is essential.

Evolving Cribl's Own Observability Practice at Blazing Speed

Cribl.Cloud has grown substantially since its launch, and our observability practice has developed in parallel. Gone are the early days of manageable logs and metrics. As we continue to grow, that problem will become even more challenging. We used Splunk internally, a well-used internal system, as our primary event management system. With Cribl Edge nodes deployed across our entire cloud fleet, we collect logs and metrics and send them to Cribl Stream for processing and routing.