Operations | Monitoring | ITSM | DevOps | Cloud
July 2022
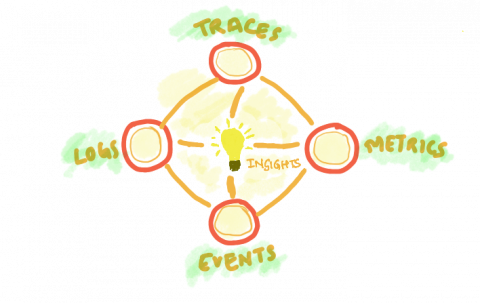
Not 3 pillars but a single whole to help customers solve issues faster
User Experience (UX) Design: The Definitive Beginner's Guide
The importance of UX design is on the rise. Customer expectations have accelerated in the post-pandemic world. According to PwC, even when people love a company or a product, 17% of US consumers will walk away after just one bad experience. So follow along for the key considerations in this important space.
Alerts Builder Demo | Setup powerful alerts on the go | SigNoz
Auto-Remediation with AppDynamics & Resolve
Open Source APM Tools
Application performance monitoring software is a basic need for most tech-related companies in the world. APM software is built by tech companies to help in the performance management of the application. Open Source APM tools are those whose source code is publicly accessible. In fact, for any software which is open source, the source code of the application must be publicly accessible on Github or any other website.
Free Logon Simulator for AVD (Azure Virtual Desktop) - Now Available!
I’m excited to be able to announce the availability of the new eG Enterprise Express Logon Simulator for AVD that now provides any AVD administrator with a no-risk, powerful “synthetic” monitoring tool to track logon performance and failures.Slow logon performance has been one of the most challenging user complaints that VDI and digital workspace administrators and support teams have to deal with.
What is Real User Monitoring (RUM)? Detailed Guide with Use Cases and Benefits
Near-instantaneous performance. Silky smooth user experience. This is what your digital users are expecting from your web application. If they perceive slowness or encounter failures in their user experience, they will readily switch to a competitor. Failures are a fact of life. The SRE (site reliability engineering) movement is helping craft modern digital systems that are engineered for resilience to failures.
What's on our radar: APM expert shares A-list app performance monitoring content
Snapshot of the application performance monitoring (APM) content that AppDynamics’ observability technical expert, Aaron Schifman finds valuable.
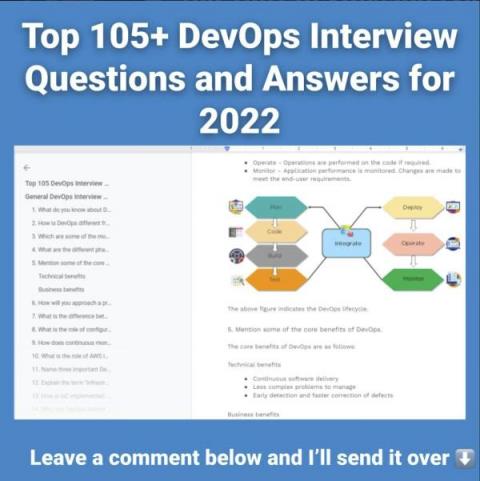
Top 105+ DevOps Interview Questions and Answers for 2022 ?
Thinking about breaking into the DevOps space? DevOps has become one of the biggest tech buzzwords. Tech giants – like Facebook, Amazon, or Google – have numerous open positions for DevOps engineers. But it is a competitive field to break into. So if you’ve been prepping for DevOps roles, here are some of the most common interview questions (and potential answers) to expect, including.
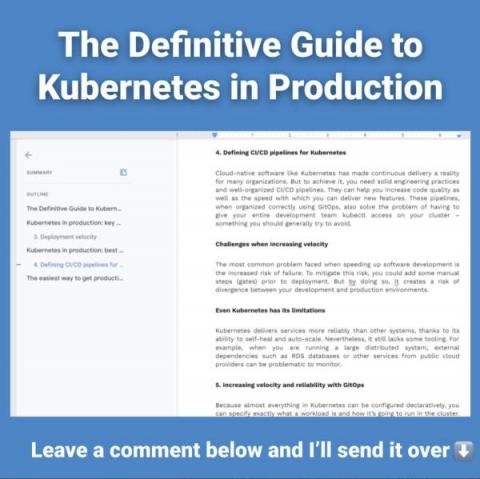
The Definitive Guide to Kubernetes in Production
Kubernetes has quickly grown in popularity, also due to its flexibility and power as a container orchestration system. It can scale virtually indefinitely, which has enabled it to provide the backbone for many of the world’s most popular online services. Plus, it is accessible and easy to set up. But, Kubernetes also comes with a few challenges in production.
Supporting Developers with Fit-for-Purpose APM Solutions: A CTO's Perspective
Founded in 2015 with a mission to “empower eCommerce businesses to deliver a top-notch customer experience,” Gorgias is a multi-channel eCommerce helpdesk service for small to medium businesses. Among their core values are ownership, excellence and a customer-first mindset, and CTO and co-founder Alex Plugaru understood from day one that, for engineering teams to be successful, the tools he set them up with had to facilitate that.
A Practical Overview of APM Tools
In today’s tech-savvy world, apps not only add value to your brand but are also required to deliver fast responses and real-time problem solving with 24/7 availability. If your business relies on software applications for day-to-day operations, application performance monitoring (APM) is critical. APM tools allow you to pinpoint performance issues quickly, ensuring peak app performance.
Cisco's new digital convergence
Cisco has unified technologies throughout the decades to provide new value and solutions to its customers and partners. Observability is Cisco’s new convergence frontier.
Azure Virtual Desktops: Questions & Answers
Recently, we hosted a great joint webinar with the team from AVD TechFest to present the results of a survey we conducted jointly to assess real-world Microsoft Azure Virtual Desktop (AVD) usage and industry and customer sentiments towards the AVD technologies. Alongside myself, Peter Claridge from eG Innovations and Simon Binder, digital workplace architect at Cygate and co-founder of the community-oriented AVD TechFest, were answering Azure Virtual Desktop questions.
Cisco's CX Cloud team talks full-stack observability
Learn how working with AppDynamics as a customer and design partner is helping the Cisco CX team improve Cisco’s offerings to customers via the CX Cloud platform.
Top Freeware and Open-source IT Monitoring Tools
There are hundreds of monitoring tools available in the market for enterprises and MSPs to choose from. Many of these tools are open source or freeware. Over the years, the functionality of many of these open source tools have improved greatly. In this blog, we highlight the top open source IT monitoring tool options and discuss their pros and cons.
Metrics Query Builder to make Advanced and Custom Dashboards for your Application | SigNoz
How Can OpenTelemetry Enhance Application Performance Monitoring?: A Gartner Quick Answer
Earlier this year Gartner published a report discussing OpenTelemetry and its place in enhancing Application Performance Monitoring (APM).
Application Performance Monitoring Needs a Makeover With Digital Experience Monitoring
Virtual collaboration is the new name of the business game in 2022, with at least 25% of employees in the US predicted to be working remotely by the end of the year. As the Work-from-anywhere movement continues to grow and online meetings become the industry standard, remote employees increasingly rely on access to SaaS and mission-critical services directly from the Internet.
Top 15 Docker Container Monitoring tools in 2022
Agents of Transformation are adapting at speed to drive innovation in the experience economy
Research published today by AppDynamics highlights how the role of technologists has evolved over the last four years and reveals the skills, qualities and tools that technologists now need to reach the pinnacle of their profession and become Agents of Transformation.
Network Performance Monitoring vs. Application Performance Monitoring: What's The Difference?
Network performance monitoring (NPM) and application performance monitoring (APM) are both key pillars of an overall performance and reliability management strategy, especially when dealing with complex, distributed infrastructure across cloud-native environments. NPM and APM also complement each other, in the sense that NPM can serve as an additional source of truth and observability for application performance.
ManageEngine recognized in the Gartner® Magic Quadrant for Application Performance Monitoring and Observability
7000+ GitHub stars, DIY Query Builder & UX improvements - SigNal 14
Shape the future of apps with AppDynamics Cloud
geeks+gurus: Sumo Logic's Debut in the Gartner APM (&O!) Magic Quadrant
Seven.One Entertainment uses Datadog to stream live experiences to millions, with confidence
Full Lifecycle Application Performance Monitoring is a Money-Saving Hack
IT experts and techies are constantly devising new ways to do more with less in our rapidly evolving world. Traditional platforms monitoring and modern technological maintenance take a large portion of a conventional organization’s IT budget. This leaves limited resources to develop new standards-based and adaptive applications that fulfill core business demands.
Prometheus vs InfluxDB - Key Differences, concepts, and similarities
NodeJs OpenTelemetry - Implementing Distributed Tracing in a NodeJS Application using OpenTelemetry
Python Instrumentation - Monitor your Python application using OpenTelemetry and SigNoz
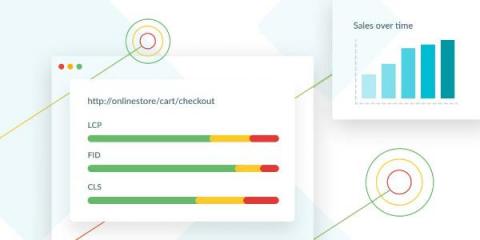
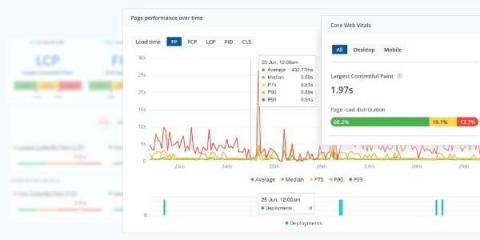
How Core Web Vitals create business impact
What are Core Web Vitals, and why should you care? Let's power through the essentials of CWV, CX and their impact on $$$. This is written with the busy software executive in mind - so we're sticking to a clear, big-picture view of metrics, user experience and revenue. Chances are, if you've heard about Core Web Vitals (CWV), it's been in the form of a stick: something Google is enforcing that can hurt your search engine visibility. We're here to go over the carrot - a quick explainer of Core Web Vitals, and how they can help you connect with customers and drive lasting innovation.


