Operations | Monitoring | ITSM | DevOps | Cloud
March 2023
Implementing OpenTelemetry in React applications
Enhanced GPU Monitoring with eG Enterprise v7.2
I’m delighted to be able to share that the v7.2 release of eG Enterprise has added a number of significant enhancements to extend or support for GPUs in the datacenter and cloud. New GPU Monitoring Capabilities in eG Enterprise v7.2 include.
IGEL Disrupt 2023 - Monitoring IGEL EUC Deployments End-to-End
eG Innovations is an IGEL Ready partner, and I’m delighted to let you all know that we are sponsoring the IGEL DISRUPT End User Computing (EUC) Forum taking place in Nashville, April 3-5, 2023. DISRUPT is a major global event focused on end user computing and the delivery of secure, high-performance digital workspaces to increasingly distributed hybrid workforces, from the cloud. To explore the agenda for the DISRUPT23 Nashville, click here.
Datadog on Data Engineering Pipelines: Apache Spark at Scale
Essential digital experience metrics for development teams
Redis Monitoring with OpenTelemetry and SigNoz
Mobile Real User Monitoring Crash Analysis
Control and Audit Remote Control Actions for Security
In an article a few months ago, my colleague covered the functionality within eG Enterprise that ensures secure and traceable audit trails for both users and admins of eG Enterprise allowing automated auditing and reporting for regulatory compliance and security, see Auditing Capabilities in IT Monitoring Tools | eG Innovations. Today, I will follow from this article and cover how eG Enterprise also controls and audits the execution of Remote Control Actions and scripts.
Introduction to Kubernetes Observability
Datadog Cost Optimization: 7 Cost-Saving Best Practices
From Dial-Up to the Cloud: Why APM is Not Enough in the Age of the Internet
What would you be doing right now if the Internet didn't exist? The world wide web as we know it is only a few decades old, but it's hard to imagine life without it. I fondly recall the early days of the "personal" Internet, when I used a 56k modem and waited anxiously for that oh-so-familiar connecting sound to access my AOL account and check if I had mail. We've come a long way from those humble beginnings.
New One-click Dashboard Templates in eG Enterprise v7.2
One-click dashboard templates are among a number of tools available within eG Enterprise to allow organizations to rapidly set up targeted and bespoke views for a wide range of audiences across their organizations, whilst avoid the costs and inconsistencies of building and maintaining many individual dashboards.
Monitoring Android applications with Elastic APM
People are handling more and more matters on their smartphones through mobile apps both privately and professionally. With thousands or even millions of users, ensuring great performance and reliability is a key challenge for providers and operators of mobile apps and related backend services.
Observing an application with Elastic Observability APM
OpenTelemetry Browser Instrumentation Complete Tutorial
Why Glovo Chose Database Monitoring to Gain Context for Troubleshooting Issues
Why Restaurant Brands International Chose Datadog for Detailed Insights That Solve Problems
Python Elasticsearch Tutorial - How to use Python Elasticsearch client
How to Protect your IT Ops from Cloud Outages
Over the past few months, I’ve written a couple of blogs analyzing significant Azure outages that affected multiple services. These articles covered detecting cloud outages long before Microsoft confirmed them and provided details of symptoms we saw. You can read these articles about a September 2022 outage and another in January 2023.
Why Seven.One Entertainment Group Chose Datadog RUM for Client-side Observability
Performance and User Experience Monitoring for Citrix Linux Workspaces
Citrix for Linux VDI and DaaS options allow organizations to deploy Linux digital workspaces and Linux applications that can then be accessed by end-users from Linux or non-Linux endpoints. This allows organizations to deploy applications optimized for Linux OSs to users using mobile, Mac, Windows, and BYOD (Bring Your Own Device) endpoints as well as those using native Linux.
OpenTelemetry vs Datadog - Choosing between OpenTelemetry and Datadog
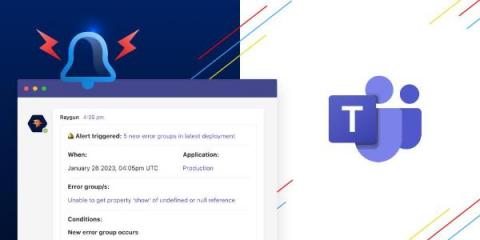
Microsoft Teams for Alerting has landed
Datadog On Reliability Engineering
Why Whatnot Chose Datadog Synthetic Monitoring to Automate Backend Testing
New compact views in Logs tab, improved correlation between signals, and 2000+ community members - SigNal 22
7 Myths of Java Memory Leaks: What SREs Need to Know and Communicate
Consider the scenario – You are an SRE (Site Reliability Engineer) joining a team to take charge of their Java applications. It has been reported that a Java application is very flaky in terms of memory issues.
Is M365 Down? - Proactive Alerting for Microsoft Azure Outages
A few months ago, I wrote an article about a serious outage of Azure and how eG Enterprise enabled us and our customers to understand the issue long before Microsoft had confirmed the issue and updated their service status pages.
The New APM: Actionable, Affordable, and Actually Built For Developers
The observability landscape - specifically your traditional Application Performance Monitoring (APM) offerings are failing modern-day developers. These legacy tools are made for ops and infra teams to keep their infrastructure and services up and running. But when it comes to helping the people that actually write the code to find and fix latency issues, these tools - which often come with massive price tags - leave developers hunting for issues causing slowdowns.
C# Performance tips and tricks
At Raygun, we’re a pretty polyglot group of developers. Various parts of our code base are written in different languages and frameworks — whatever is best for the job. That said, large parts of Raygun written with.NET, and we’re big.NET fans. Given the prevalence of C# applications (C# has been in the top 5 on the TIOBE index for about 10 years!) and the massive scale of data Raygun deals with, we’re often called on to do C# optimization work.


