Operations | Monitoring | ITSM | DevOps | Cloud

December 2023

Kubernetes Events Monitoring with OpenTelemetry | Complete Tutorial

Events in Kubernetes are objects that provide insights into the state changes within the Kubernetes cluster. Kubernetes events monitoring is critical to provide real-time insights into the operational state of a Kubernetes cluster. It enables administrators to quickly identify and respond to issues, optimize resource allocation, and ensure the smooth and efficient functioning of their containerized applications.

OpenTelemetry ECS Tutorial - Monitor AWS ECS metrics [Step-By-Step Guide]

OpenTelemetry can be used to monitor ECS clusters. In this tutorial, you will install OpenTelemetry Collector to collect ECS metrics and then send the collected data to SigNoz for monitoring and visualization. In this tutorial, we cover: If you want to jump straight into implementation, start with this Pre-requisites section.

How Toyota is using Datadog and AI/ML to invent new ways for humans to be more mobile #datadog

Toyota is best known for making great cars and trucks, and as a leader in technology and mobility, they are on a mission to build a better future where everyone has the freedom to move. By partnering with Datadog, Toyota is taking advantage of the latest AI/ML to innovate and invent new ways for humans to be more mobile, while future proofing Toyota’s tech stack.

2024 Unveiled: Catchpoint's Predictions for APM, ITOM, OTel & Beyond

As the holiday season rolls in, it’s not just about festive cheer and resolutions; it’s also time for industry leaders to cast their predictions for the new year. This year, Catchpoint’s thought leaders have stepped up with their hottest takes for 2024. Catchpoint experts are envisioning a transformative shift in the monitoring technologies, a heightened focus on performance as a key metric, and an integrated strategy for managing digital performance management.

Top 11 Kubernetes Monitoring Tools[Includes Free & Open-Source] in 2024

Are you looking for Kubernetes monitoring tools? Then you have come to the right place. Kubernetes has grown to become the container orchestration platform of choice. It simplifies managing your containerized workloads. You get the power of automating deployments, scaling resources, and keeping your applications running smoothly. But with great power comes added responsibility. And like any complex system, Kubernetes needs monitoring.

Key considerations when choosing the right application performance monitoring tool for your business

In today’s technology-driven world, applications are the lifeblood of businesses and the cornerstone of user interactions. From e-commerce platforms to social media networks, flawless application performance is no longer a mere expectation but a fundamental requirement for user satisfaction and business success. However, lurking beneath the surface of seemingly smooth operations lie potential pitfalls that can quickly transform a positive user experience into a nightmare.

Scaling Up, One Network Bottleneck at a Time #shorts #datadog

Processing data at scale involves moving packets through a network—but what happens when that network isn't cooperative? Anatole Beuzon, a Software Engineer at Datadog, discusses how he investigated and resolved network issues in Datadog’s larger data-processing apps and how you can apply these same methods to your own production workloads.

Three Pillars of Observability [And Beyond]

Observability is often defined in the context of three pillars: logs, metrics, and traces. Modern-day cloud-native applications are complex and dynamic. To avoid surprises and performance issues, you need a robust observability stack. But is observability limited to collecting logs, metrics, and traces? How is observability evolving to make our systems more observable? In this tutorial, we cover.

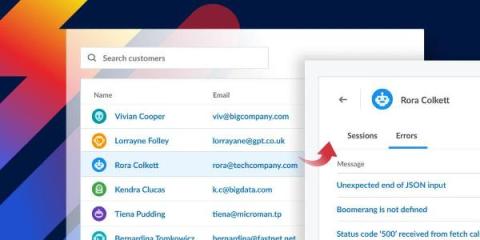
3 secure ways to handle user data in Raygun

You know the feeling: You’re right in the middle of cracking a really convoluted coding problem, when an urgent support ticket pops up. It’s not just any ticket; it’s from a VIP customer with a high-severity issue demanding resolution within an hour. You have to drop what you’re doing and scramble, completely context-switching and losing all your momentum.

Detecting PowerShell Exploitation

In today’s digital landscape, cybersecurity is a top priority for organizations. Hackers are continuously finding new ways to exploit vulnerabilities and compromise systems. PowerShell, a powerful scripting language and automation framework developed by Microsoft, has unfortunately become a favored tool among attackers due to its capability to run.NET code and execute dynamic code downloaded from another system (or the internet) and execute it in memory without ever touching disk.

Analyze Transaction Scores to understand the impact of increased user activity

An increase in user activity can create a larger impact of degraded performance, should the systems not be fully tuned properly. A small problem could easily lead to an exponential one if not addressed quickly. The AppDynamics Transaction Scorecard helps you focus on any issue that grows as user access grows by providing a simple yet effective indication of how transactions perform according to one of five categories: normal, slow, very slow, stalled, or those that have errors.

Building an Internal Development Platform (IDP): A Journey of Innovation and Growth #shorts

As your organization grows, the increased number of engineers and services can put a strain on your infrastructure and ops teams. As Latin America’s largest online commerce and payments ecosystem, MercadoLibre needed to solve this scaling challenge. So we embarked on a mission to build an Internal Development Platform (IDP). We’ll highlight our transformative journey and how the IDP grew to manage over 26,000 microservices, while delivering a highly productive environment to MercadoLibre’s 12,000+ developers. In this session, you’ll learn about the challenges and solutions required to successfully build your own IDP.

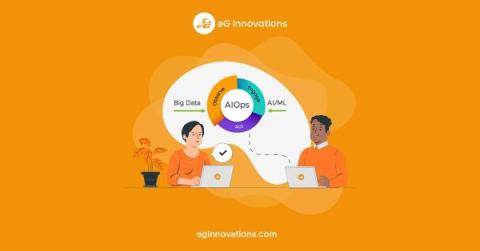
5 Ways AIOps Monitoring Benefits EUC Environments

The adoption of AIOps monitoring technologies has been somewhat slower in EUC than many other areas of IT. The legacy VDI and DaaS vendor tools set expectations low for many. It is still relatively common for us to come across potential customers who are using legacy tools and manually exporting 6 months of data into an excel spreadsheet to try and work out average and peak usage of resources such as CPU to then manually calculate alert thresholds.

Using OpenTelemetry Collector Loki Receiver to Send Logs to SigNoz [Code Tutorial]

In this tutorial, you will learn how to collect logs using the Loki receiver in OpenTelemetry Collector to send logs to SigNoz. If you’re using Promtail to collect logs, you can send them to SigNoz instead of Loki via the OpenTelemetry Collector. In this tutorial, we cover: If you want to jump straight into implementation, start with this prerequisites section.

OpenTelemetry vs Jaeger : Comparing Apple and Oranges

Open telemetry works with all the three signals i.e. it help in generating all the three signals while Jaeger only focuses on one signal (traces). The second key difference is Jaeger doesn't worry about generating data. It's more focused on the UI visualization long term storage of traces data while OpenTelemetry primarily focused on generating traces data.

Monitor HAProxy Metrics and Logs with OpenTelemetry [Step By Step Guide]

For extremely high throughput web applications, it is important to load balance the traffic across multiple servers. However, load balancing the traffic alone is not enough at times. The reverse proxy server that handles the workload needs to be performant, too. In our previous article, we discussed the NGINX reverse proxy server and understood how to monitor it. In this article, we set up monitoring for an even more performant reverse proxy server - HAProxy.

FinOps and Cloud Cost Optimization #shorts #datadog #cloudservices

As companies scale, it’s become increasingly important to keep cloud cost management and optimization top of mind. In this talk, Yuval Yogev from Sygnia walks you through Sygnia’s optimization journey of cutting their total cloud costs in half. Yogev also shares insights into how you can optimize your own organization’s cloud usage and spend.

Is your Java Observability tool Lambda Expressions aware?

Most SREs and IT Ops manage Java applications without source code access or communication with AppDev teams. When applications have performance issues those SREs or IT Ops teams deploying and maintaining the infrastructure often have to prove that it is the application at fault and supply information to the app supplier which provides evidence of the issue.

The art of software engineering management

Like any leadership role, leading an engineering team in a mature, compact company like Raygun comes with both honor and responsibility. Leading a major development project is a bit like conducting a symphony orchestra, where every individual plays a crucial role and has a great impact on the work they release to customers and end-users.
Sponsored Post

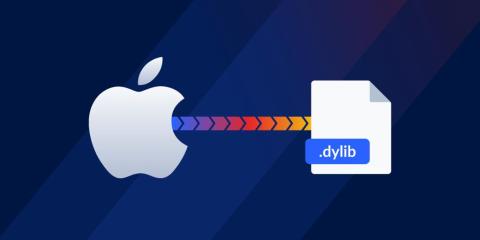
Symbolicating stack traces from Apple system libraries

In the world of software development, quickly finding and fixing errors drives better experiences for both end-users and developers. One key tool in this process is the symbol map, which records debugging information that was lost in the compilation process. Symbol maps (or source maps if we're talking JavaScript) connect the code developers write to the minified code in production, making it easier to decipher crashes by pinpointing the exact source code that caused the error.

CTO Fireside Chat #cto #asana #datadog #leadership #ml #ai #shorts

Building large scale technical systems is hard, but building and scaling high performing technical organizations is even more difficult. In this session, Datadog Co-founder and CTO Alexis Lê-Quôc will sit down with Prashant Pandey, Head of Engineering at Asana, to discuss their approach to engineering leadership. They’ll share the hard-learned lessons from their long careers to help you cultivate better technical teams, covering topics from staying in tune with new technologies, enabling innovation , shipping modern ML and AI-based features, and scaling teams.

OpenTelemetry Auto & Manual Instrumentation Explained with a Sample Python App

OpenTelemetry is an open-source observability project that provides a set of APIs, SDKs, and tooling for collecting, generating, and exporting telemetry data. It provides instrumentation libraries in all major programming languages. In this article, we will demonstrate the automatic and manual instrumentation of Python applications. In this tutorial, we cover: If you want to jump straight into implementation, start with this prerequisites section.

57% of UK consumers say digital bliss a must for festive fun, Cisco survey reveals

A recent survey by Cisco highlights the pivotal role of digital applications and services in enhancing the holiday season experience. With a global increase in application usage anticipated, the report underscores the need for brands to ensure optimal performance of their digital services or risk dampening the festive spirit.

Mocha vs Jasmine, Chai, Sinon & Cucumber in 2024

Javascript has been enabling browsers for years, and for better or for worse, the internet is made of JS. NodeJS brought it to the server side. TypeScript has wrapped familiar object-oriented, statically-typed syntax around it. Anywhere you look, you’ll find Javascript: on the client, server, mobile, and embedded systems.

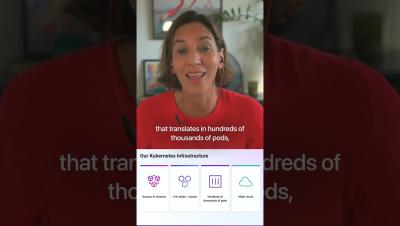
Datadog on Kubernetes Node Management #datadog #kubernetes #observability #infrastructure #shorts

Datadog, the observability platform used by thousands of companies, runs on dozens of self-managed Kubernetes clusters in a multi-#cloud environment, adding up to tens of thousands of nodes, or hundreds of thousands of pods. This infrastructure is used by a wide variety of engineering teams at Datadog, with different feature and capacity needs.

Detect and diagnose purchase abandonment with automation

By using the Experience Journey Map, users can quickly see where in the browser and mobile journey users are dropping, or where in the conversion process are users most likely having issues. Dive deeper into what may be an underlying cause, perhaps geographic or by device type rather than due to an application fault. Reduce the amount of investigative work and fix what matters most importantly, by pinpointing where and why the user experiences issues.

re:Invent Recap Livestream

Did you miss this year’s re:Invent? Or maybe you were onsite but too busy deep diving on certifications, new products, and networking. Don’t worry – the Datadog team is streaming right to your home on December 5th to recap all of the highlights from the event. Join Andrew Krug from Datadog’s Technical Community and a host of AWS guests LIVE to hear about exciting announcements from AWS re:Invent 2023, Datadog’s latest product launches, and a run-down of the best On Demand sessions that you’ll want to make sure to tune into.

Health Check Monitoring With OpenTelemetry | Complete Code Tutorial

In this tutorial, you will learn how HTTP endpoints can be monitored with OpenTelemetry. You will use the OpenTelemetry Collector to collect metrics from the target endpoint and send them to SigNoz for monitoring and visualization. In this tutorial, we cover: If you want to jump straight into implementation, start with this prerequisites section.

Amazon EKS Monitoring with OpenTelemetry [Step By Step Guide]

Effective EKS monitoring is crucial for maintaining the health and performance of containerized applications deployed in the cluster. In this tutorial, we will set up EKS monitoring with OpenTelemetry. We will build monitoring dashboards for node and pod-level metrics with data collected by OpenTelemetry. We will use SigNoz, an open-source OpenTelemetry-native APM, as a storage and visualization layer for setting up dashboards.

How Toyota Connected uses Datadog Workflow Automation to reduce time to resolution #datadog #shorts

Hear from Toyota Connected’s DevOps Engineers about how Datadog Workflow Automation helps them easily automate their infrastructure tasks, thereby reducing the time needed to resolve incidents and disruptions.

Apica Ascent Triumphs in 2023 SoftwareReviews APM Report

Apica’s Ascent has achieved remarkable results in the 2023 Application Performance Management Data Quadrant Report published by SoftwareReviews, a notable source for insights on the software provider landscape. The report gathers extensive customer experience data from business and IT professionals, offering detailed and authentic insights into the experience of evaluating and purchasing enterprise software.

Spring Boot Monitoring with Open-Source Tools

Spring Boot Monitoring aims to provide real-time insights into various aspects of a Spring Boot application. Spring Boot provides useful libraries like the Spring Boot Actuator and Micrometer to aid in monitoring. But in order to set up effective monitoring, you need to use a tool where you can send the monitoring data for storage and visualization. In this tutorial, we cover: In this tutorial, you will learn how to monitor a Spring Boot application with SigNoz and OpenTelemetry.

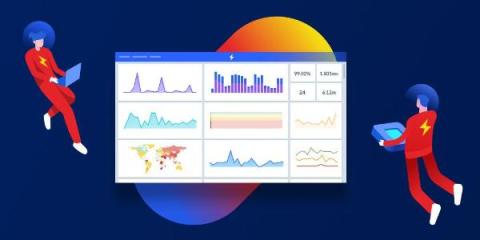
7 Million Docker Downloads, uPlot Charting Library, and Improvements in Dashboard - SigNal 31

Welcome to the 31st edition of our monthly product newsletter - SigNal 31! We shipped a lot of improvements in our dashboard user experience and crossed 7 million Docker downloads. Let’s see what the humans of SigNoz did in the month of November 2023.

Nginx Metrics and Logs Monitoring with OpenTelemetry

Nginx metrics and logs monitoring are important to ensure that Nginx is performing as expected and to identify and resolve problems quickly. In this tutorial, you will install OpenTelemetry Collector to collect Nginx metrics and logs and then send the collected data to SigNoz for monitoring and visualization. In this tutorial, we cover: If you want to jump straight into implementation, start with this pre-requisites section.