Operations | Monitoring | ITSM | DevOps | Cloud
May 2021
How to alert on high cardinality data with Grafana Loki
Amnon is a Software Engineer at ScyllaDB. Amnon has 15 years of experience in software development of large-scale systems. Previously he worked at Convergin, which was acquired by Oracle. Amnon holds a BA and MSc in Computer Science from the Technion-Machon Technologi Le' Israel and an MBA from Tel Aviv University. Many products that report internal metrics live in the gap between reporting too little and reporting too much.
Meet the New Splunk Lantern
Splunk Lantern, your go-to source for outcome-oriented, actionable Splunk content, just got a makeover. You can now more easily navigate with a new interface, take advantage of new features to help you find the content you need, and access new content types to achieve your goals.
Use Logz.io to Instrument Kubernetes with OpenTelemetry & Helm
Logz.io is always looking to improve the user experience when it comes to Kubernetes and monitoring your K8s architecture. We’ve taken another step with that, adding OpenTelemetry instrumentation with Helm charts. We have made Helm charts available before, previously with editions suitable for Metricbeat and for Prometheus operators.
Analyze your logs easier with log field analytics
We know that developers or operators troubleshooting applications and systems have a lot of data to sort through while getting to the root cause of issues. Often there are fields like error response codes that are critical for finding answers and resolving those issues. Today, we’re proud to announce log field analytics in Cloud Logging, a new way to search, filter and understand the structure of your logs so you can find answers faster and easier than ever before.
You've Installed Graylog - What's Next
Why Elasticsearch is an indispensable component of the Adyen stack
At Adyen, we use Elasticsearch to power various parts of our payments platform. This includes payment search, monitoring, and log search. Let’s take a look at how we use Elastic for these different use cases and see how we capitalize on the power of Elasticsearch. We recently did a talk about some of our Elasticsearch adventures at an Elastic meetup. You can find a recording here.
Using LogDNA To Troubleshoot In Production
In 1946, a moth found its way to a relay of the Mark II computer in the Computation Laboratory where Grace Hopper was employed. Since that time, software engineers and operations specialists have been plagued by “bugs.” In the age of DevOps, we can catch many bugs before they escape into a production environment. Still, occasionally they do, and they can spawn all kinds of unexpected problems when they do.
Using LogDNA and your Logs to QA and Stage
An organization’s logging platform is a critical infrastructure component. Its purpose is to provide comprehensive and relevant information about the system, to specific parties, while it's running or when it's being built. For example, developers would require detailed and accurate logs when building and implementing services locally or in remote environments so that they can test new features.
Using LogDNA to Debug in Development
Developing scalable and reliable applications is a serious business. It requires precision, accuracy, effective teamwork, and convenient tooling. During the software construction phase, developers employ numerous techniques to debug and resolve issues within their programs. One of these techniques is to leverage monitoring and logging libraries to discover how the application behaves in edge cases or under load.
How to use Cloud Logging to detect security breaches
King & Wood Mallesons CISO relies on Elastic to "spot and identify" security threats
King & Wood Mallesons (KWM) is among the world’s most innovative law firms and is represented by 2,400 lawyers in 28 locations across the globe. The international law firm, based in Australia, helps clients flourish in Asian markets by helping them understand and navigate local challenges and by delivering solutions that provide clients with a competitive advantage.
Using Audit Logs For Security and Compliance
Developers, network specialists, system administrators, and even IT helpdesk use audit log in their jobs. It’s an integral part of maintaining security and compliance. It can even be used as a diagnostic tool for error resolution. With cybersecurity threats looming more than ever before, audit logs gained even more importance in monitoring. Before we get to how you can use audit logs for security and compliance, let’s take a moment to really understand what they are and what they can do.
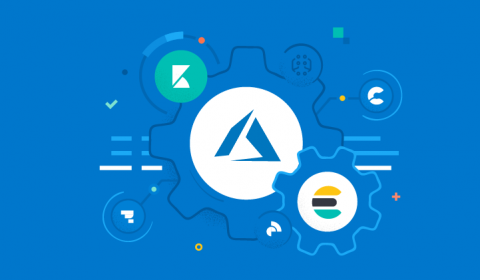
How to deploy and manage Elastic on Microsoft Azure
We recently announced that users can find, deploy, and manage Elasticsearch from within the Azure portal. This new integration provides a simplified onboarding experience, all with the Azure portal and tooling you already know, so you can easily deploy Elastic without having to sign up for an external service or configure billing information.
Elastic 7.13.0 released: Search and store more data on Elastic
We are pleased to announce the general availability (GA) of Elastic 7.13. This release brings a broad set of new capabilities to our Elastic Enterprise Search, Observability, and Security solutions, which are built into the Elastic Stack — Elasticsearch and Kibana. This release enables customers to search petabytes of data in minutes cost-effectively by leveraging searchable snapshots and the new frozen tier.
Why You Should Migrate from Legacy Apps to IT Essentials Work
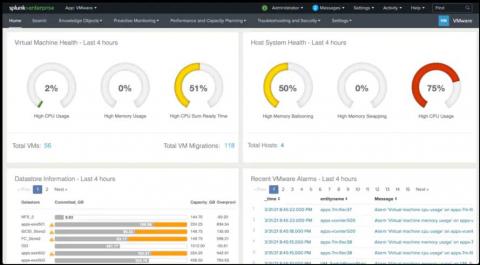
If you were using the Splunk App for Infrastructure (SAI) and / or other Splunk apps for infrastructure — *nix, Windows, and VMware — you’ve probably enjoyed the ease and quickness these apps offered to get started with basic infrastructure monitoring tasks.
Sumo Logic + DFLabs: Cloud SIEM Combined with SOAR Automates Threat Detection and Incident Response
The Importance of Log Management - Guide & Best Practices
Log management encompasses the processes of managing this trove of computer-generated event log data, including: There are two ways that IT teams typically approach event log management. Using a log management tool, you can filter and discard events you don’t need, only gathering relevant information – eliminating noise and redundancy at the point of ingestion.
Advanced Link Analysis, Part 3 - Visualizing Trillion Events, One Insight at a Time
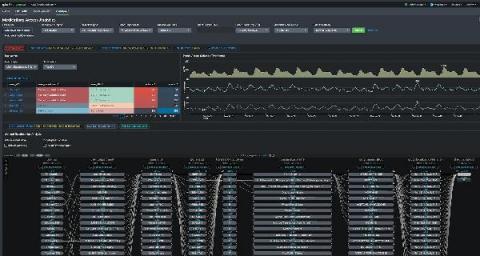
This is Part 3 of the Advanced Link Analysis series, which showcases the interactive visualization of advanced link analysis with Splunk partner, SigBay. The biggest challenge for any data analytics solution is how it can handle huge amounts of data for demanding business users. This also puts pressure on data visualization tools. This is because a data visualization tool is expected to represent reasonably large amounts of data in an intelligent, understandable and interactive manner.
Why Midsized SecOps Teams Should Consider Security Log Analytics Instead of Security and Information Event Management
Why Logging Matters Throughout the Software Development Life Cycle (SDLC)
There are multiple phases in the software development process that need to be completed before the software can be released into production. Those phases, which are typically iterative, are part of what we call the software development life cycle, or SDLC. During this cycle, developers and software analysts also aim to satisfy nonfunctional requirements like reliability, maintainability, and performance.
Tutorial: Set Up a Linux Source
Logz.io Now Supports AWS App Runner
Logz.io now natively supports AWS App Runner. AWS has launched an innovative service called App Runner. This service builds upon Fargate, the AWS service that runs containers on Kubernetes without manual maintenance, patching, and upkeep of the containers or Kubernetes itself. App Runner takes this to the next level. It creates additional automation of and capabilities to deploy, run, and scale containerized workloads in concert with continuous deployment.
Grafana Loki: Open Source Log Aggregation Inspired by Prometheus
Logging solutions are a must-have for any company with software systems. They are necessary to monitor your software solution’s health, prevent issues before they happen, and troubleshoot existing problems. The market has many solutions which all focus on different aspects of the logging problem. These solutions include both open source and proprietary software and tools built into cloud provider platforms, and give a variety of different features to meet your specific needs.
Storing Metrics in Sumo Logic
Log Management & Managed Open Distro ELK Platform, Logit.io Launch New Teams & Users UI
Security Log Management Done Right: Collect the Right Data
Nearly all security experts agree that event log data gives you visibility into and documentation over threats facing your environment. Even knowing this, many security professionals don’t have the time to collect, manage, and correlate log data because they don’t have the right solution. The key to security log management is to collect the correct data so your security team can get better alerts to detect, investigate, and respond to threats faster.
Announcing the LogDNA and Sysdig Alert Integration
LogDNA Alerts are an important vehicle for relaying critical real-time pieces of log data within developer and SRE workflows. From Slack to PagerDuty, these Alert integrations help users understand if something unexpected is happening or simply if their logs need attention. This allows for shorter MTTD (mean time to detection) and improved productivity.
How Cloudflare Logs Provide Traffic, Performance, and Security Insights with Coralogix
Cloudflare secures and ensures the reliability of your external-facing resources such as websites, APIs, and applications. It protects your internal resources such as behind-the-firewall applications, teams, and devices. This post will show you how Coralogix can provide analytics and insights for your Cloudflare log data – including traffic, performance, and security insights.
What Is the OpenTelemetry Project and Why Is It Important?
The OpenTelemetry project is an ambitious endeavor with of goal of bringing together various technologies to form a vendor neutral observability platform. Within the past year, many of the biggest names in tech provide native support within their commercial projects.
Is "Vendor-Owned" Open Source an Oxymoron?
Open source is eating the world. Companies have realized and embraced that, and ever more companies today are built around a successful open source project. But there’s also a disturbing counter-movement: vendors relicensing popular open source projects to restrict usage. Last week it was Grafana Labs which announced relicensing Grafana, Loki and Tempo, its popular open source monitoring tools, from Apache2.0 to the more restrictive GNU AGPLv3 license.
How to do network traffic analysis with VPC Flow Logs on Google Cloud
Network traffic analysis is one of the core ways an organization can understand how workloads are performing, optimize network behavior and costs, and conduct troubleshooting—a must when running mission-critical applications in production. VPC Flow Logs is one such enterprise-grade network traffic analysis tool, providing information about TCP and UDP traffic flow to and from VM instances on Google Cloud, including the instances used as Google Kubernetes Engine (GKE) nodes.
Cyber Defense Magazine Names ChaosSearch "Cutting Edge" in Cybersecurity Analytics
How to correlate Graphite metrics and Loki logs
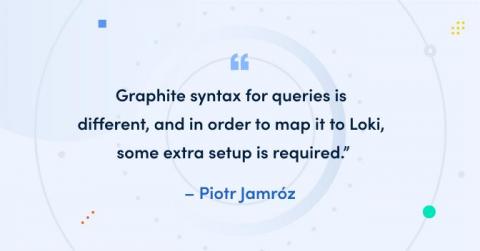
Grafana Explore makes correlating metrics and logs easy. Prometheus queries are automatically transformed into Loki queries . And we will be extending this feature in Grafana 8.0 to support smooth logs correlation not only from Prometheus, but also from Graphite metrics. Prometheus and Loki have almost the same query syntax, so transforming between them is very natural. However, Graphite syntax for queries is different, and in order to map it to Loki, some extra setup is required.
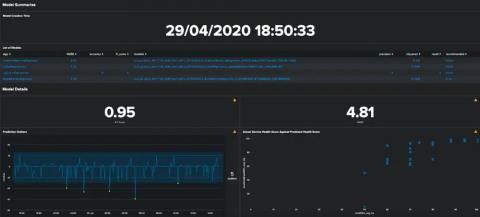
Monitoring Model Drift in ITSI
I’m sure many of you will have tried out the predictive features in ITSI, and you may even have a model or two running in production to predict potential outages before they occur. While we present a lot of useful metrics about the models’ performance at the time of training, how can you make sure that it is still generating accurate predictions? Inaccuracy in models as the underlying data or systems change over time is natural.
What's New: Splunk Enterprise 8.2
Welcome back to another day in paradise. Today we are announcing the release of Splunk Enterprise 8.2. Since our last release of Splunk Enterprise 8.1 at .conf20, we have continued development of new and enhanced capabilities for our twice a year release cadence. In Splunk Enterprise 8.2, we have focused our development offers across a number of themes: insights, admin productivity, data infrastructure, and performance.
Distributed Tracing vs. Application Monitoring
Log Management and SIEM Overview: Using Both for Enterprise CyberSecurity
Executive Orders, Graylog, and You
In the last six months, multiple major cyber attacks have severely impacted hundreds of organizations in both the public and private sectors, and disrupted the daily lives of tens of thousands of their employees and customers.
Customize your LogDNA Webhook Alerts
LogDNA Alerts are a key feature for developers and SREs to stay on top of their systems and applications, as it notifies them of important changes in their log data. However, with so many different workflows to account for, it was important to enable a flexible solution that could connect to any team’s toolkit.
Monitor Cloudflare logs and metrics with Datadog
Cloudflare is a content delivery network (CDN) that organizations across industries use to secure the reliability of their websites, applications, and APIs. With a wide array of security, networking, and performance-management tools, millions of web applications employ Cloudflare’s DDoS protection, load balancing, and serverless compute-monitoring features to maintain high performance and uptime.
Debugging with Dashbird: Lambda not logging to CloudWatch
Lambda not logging to CloudWatch? It’s actually one of the most common issues that come up. Let’s briefly go over why this problem needs to be solved. CloudWatch is the central logging and monitoring service of the AWS cloud platform. It gives you insights into all the AWS services. Even if you can’t deploy and test serverless systems locally, CloudWatch tells you what’s happening to them.
Micro Lesson: Managing Organization's Credit Allocation
What is the Coralogix Security Traffic Analyzer (STA), and Why Do I Need It?
The wide-spread adoption of cloud infrastructure has proven to be highly beneficial, but has also introduced new challenges and added costs – especially when it comes to security. As organizations migrate to the cloud, they relinquish access to their servers and all information that flows between them and the outside world. This data is fundamental to both security and observability.
Set Up a Cloudflare Source
Micro Lesson: Creating a Child Org
SolarWinds Papertrail Overview
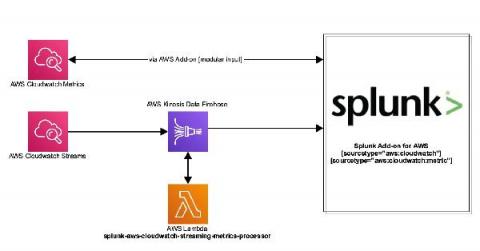
Stream Your AWS Services Metrics to Splunk
Amazon Web Services (AWS) recently announced the launch of CloudWatch Metric Streams. Cloudwatch Streams can stream metrics from a number of different AWS resources using Amazon Kinesis Data Firehose to target destinations. The new service is different from the current architecture. Instead of polling, metrics are delivered via an Amazon Kinesis Data Firehose stream. This is a highly scalable and far more efficient way to retrieve AWS service metrics.
Boards | LogDNA and SREs
Views | LogDNA and SREs
The Essential Guide to PHP Error Logging
PHP has been one of the top (if not best) server-side scripting languages in the world for decades. However, let’s be honest – error logging in PHP is not the most straightforward or intuitive. It involves tweaking a few configuration options plus some playing around to get used to.
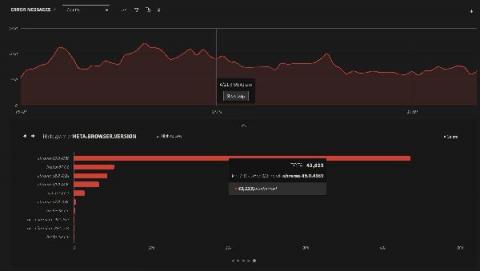
Introducing Browser Logger - Unlocking the Power of Frontend Logs
Modern web applications are more reliant on the frontend than ever before. While there are many benefits to this approach, one downside is that developers can lose visibility into issues when things go wrong. When the application experience is degraded, engineers are left waiting for users to report issues and share browser logs. Otherwise, they might be left in the dark and unaware that any issues exist in the first place.
The Value of Ingesting Firewall Logs
In this article, we are going to explore the process of ingesting logs into your data lake, and the value of importing your firewall logs into Coralogix. To understand the value of the firewall logs, we must first understand what data is being exported. A typical layer 3 firewall will export the source IP address, destination IP address, ports and the action for example allow or deny. A layer 7 firewall will add more metadata to the logs including application, user, location, and more.
From Distributed Tracing to APM: Taking OpenTelemetry & Jaeger Up a Level
It’s no secret that Jaeger and OpenTelemetry are known and loved by the open source community — and for good reason. As part of the Cloud Native Computing Foundation (CNCF), they offer one the most popular open source distributed tracing solutions out there as well as standardization for all telemetry data types.
How to search logs in Loki without worrying about the case
Whether it’s during an incident to find the root cause of the problem or during development to troubleshoot what your code is doing, at some point you’ll have an issue that requires you to search for the proverbial needle in your haystack of logs. Loki’s main use case is to search logs within your system. The best way to do this is to use LogQL’s line filters. However, most operators are case sensitive.
Splunk Log Observer: Log analysis built for DevOps
Observability: It's Not What You Think
Observability is a mindset that enables you to answer any question about your entire business through collection and analysis of data.


