Operations | Monitoring | ITSM | DevOps | Cloud
February 2023
2023 is When More FinOps Practices will Shift Left and Cost Optimization around Logging will Get Central Stage
Effective troubleshooting and resolution of critical production issues require DevOps and R&D teams to utilize logging and observability. However, selecting the right logging solution can be challenging, given the wide range of available options and associated costs. Additionally, the strategy for logging usage should be tailored to the needs of different personas and use cases, such as DevOps engineers versus developers.
Accelerate EO 14028 Compliance While Controlling Log Ingestion Costs
Cribl Stream 4.0: New Features, New User Interface, and Much More
Using Cribl Search for Anomaly Detection: Finding Statistical Outliers in Host CPU Busy Percentage
How the All in One Worker Group Fits Into the Cribl Stream Reference Architecture
How CCP Games Used Honeycomb to Modernize and Migrate its Codebase
Imagine a universe in which a massively multiplayer online role-playing game (MMORPG) sets Guinness World Records for the size of its online space battles—and that game is built on 20-year-old code. Well, imagine no more. Welcome to the world of EVE Online, where hundreds of thousands of players interact across 7,800+ star systems and participate in more than one million daily market transactions.
SolarWinds Expands Global Reach of World-Class SaaS Observability Solution to Help Customers Accelerate Digital Transformation and Reduce IT Complexity
FinOps Observability: Monitoring Kubernetes Cost
With the current financial climate, cost reduction is top of mind for everyone. IT is one of the biggest cost centers in organizations, and understanding what drives those costs is critical. Many simply don’t understand the cost of their Kubernetes workloads, or even have observability into basic units of cost. This is where FinOps comes into play, and organizations are beginning to implement those best practice standards to understand their cost.
SumUp Uses Honeycomb to Improve Service Quality and Strengthen Customer Loyalty
Growing pains can be a natural consequence of meteoric success. We were reminded of that in our recent panel discussion with SumUp’s observability engineering lead, Blake Irvin, and senior software engineer Matouš Dzivjak. They shared how SumUp’s rapid growth spurt compelled them to change their resolution process—both logistically and culturally—to ensure a service level quality that reflects their customer obsession.
Deciding Whether to Buy or Build an Observability Pipeline
In today's digital landscape, organizations rely on software applications to meet the demands of their customers. To ensure the performance and reliability of these applications, observability pipelines play a crucial role. These pipelines gather, process, and analyze real-time data on software system behavior, helping organizations detect and solve issues before they become more significant problems. The result is a data-driven decision-making process that provides a competitive edge.
Fixing Security's Data Problem: Strategies and Solutions with Cribl and CDW
How Database Observability Increases Operational Reliability
Bracing for Impact: Why a Robust Observability Pipeline is Critical for Security Professionals in 2023
2023 is well underway and now more than ever it’s important to stay ahead of data trends and security concerns that are ever mounting. With the cost of catastrophic cyber attacks estimated to be ten times that of all other disasters combined, businesses need to take proactive measures to implement a security data pipeline to protect their data and comply with security and retention requirements.
Introducing OpenTelemetry Support: Take Action on Your Observability Data
As an open source company that grew out of a side project in 2008 to an application and performance monitoring platform (APM) used by over 3.5 million developers, Sentry is committed to open source and the community of developers maintaining and building in the open. Similarly, we take a public approach to building our software, which is why it’s a natural extension of our values to announce our support for OpenTelemetry (or OTel), the leading open standard for observability.
Discovering Efficiency Through 2 Steps Synthetic Monitoring for Splunk
You're probably familiar with Splunk. It's one of the most popular big data solutions organisations worldwide use to monitor their systems in real-time. But you may not know that Splunk also offers synthetic monitoring solutions via 2 Steps. 2 Steps Synthetic Monitoring for Splunk is a powerful tool that can help you speed up your application troubleshooting process. Today we'll take a closer look at what it is and how it can benefit your organisation.
Understand user journeys with AppDynamics Business iQ
How We Manage Incident Response at Honeycomb
When I joined Honeycomb two years ago, we were entering a phase of growth where we could no longer expect to have the time to prevent or fix all issues before things got bad. All the early parts of the system needed to scale, but we would not have the bandwidth to tackle some of them graciously. We’d have to choose some fires to fight, and some to let burn.
Save 40-70% of Your Observability Costs with Coralogix TCO
Introducing the Cribl Stream Reference Architecture
Peeking into Rails apps using OpenTelemetry
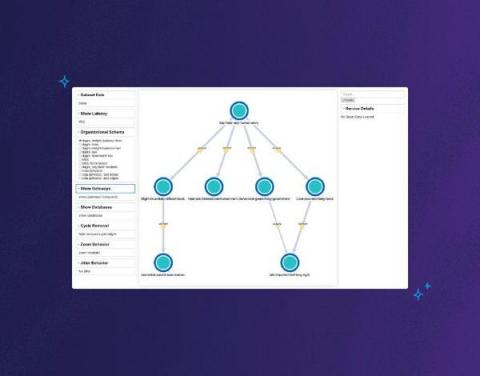
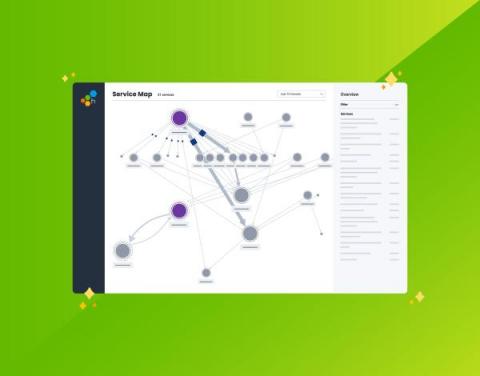
Iterating Our Way Toward a Service Map
For a long time at Honeycomb, we envisioned using the tracing data you send us to generate a service map. If you’re unfamiliar, a service map is a graph-like visualization of your system architecture that shows all of its components and dependencies. We didn’t want it to be a static service map, though—the kind you’d view once before going “huh, neat”—and then never looking at it again.
Symantec Edge SWG (formerly ProxySG) Performance Monitoring: Gain Full Observability with DX NetOps and AppNeta
For teams running secure web gateways (SWGs), also referred to as proxies, in today’s complex, dynamic network environments, extensive observability is a must have. Symantec offers a range of flexible deployment options for its SWGs, offering support for cloud, edge, and hybrid approaches. This blog explores a Broadcom solution that provides comprehensive observability for the Symantec edge offering, Symantec Edge SWG (formerly ProxySG).
Webinar Recap: Observability Data Orchestration
Today, businesses are generating more data than ever before. However, with this data explosion comes a new set of challenges, including increased complexity, higher costs, and difficulty extracting value. With this in mind, how can organizations effectively manage this data to extract value and solve the challenges of the modern data stack?
"I can now sleep at night." How Corevist Achieved Single-Pane-of-Glass Observability
Empowering SecOps Admins: Getting the Most Value from CrowdStrike FDR Data with Cribl Stream
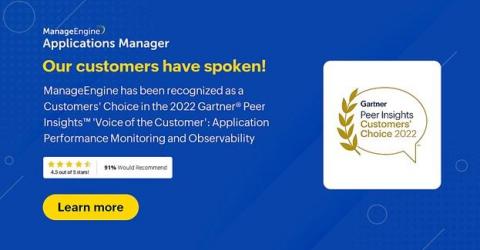
Our customers have spoken!
Observability vs Monitoring - The difference explained with an example
Splunk Incident Intelligence
Why EVERYONE Needs DataPrime
In modern observability, Lucene is the most commonly used language for log analysis. Lucene has earned its place as a query language. Still, as the industry demands change and the challenge of observability grows more difficult, Lucene’s limitations become more obvious.
Watch: How to pair Grafana Faro and Grafana k6 for frontend observability
Grafana Faro and xk6-browser are both new tools within the Grafana Labs open source ecosystem, but the pairing is already showing a lot of potential in terms of frontend monitoring and performance testing. Faro, which was announced last November, includes a highly configurable SDK that instruments web apps to capture observability signals that can then be correlated with backend and infrastructure data.
It's time for government to move beyond monitoring and into observability
When thinking about holistic end-to-end observability, it can help to start with what you already have. Many government agencies are already strategically ingesting and storing logs — a key component of observability. More than a year and a half after the release of M-21-31, US government agencies continue to work through the logging maturity models outlined in the memorandum.
The Evolution of Applications and Current Trends To Know
How Security Engineers Use Observability Pipelines
In data management, numerous roles rely on and regularly use telemetry data. The security engineer is one of these roles. Security engineers are the vigilant sentries, working diligently to identify and address vulnerabilities in the software applications and systems we use and enjoy today. Whether it’s by building an entirely new system or applying current best practices to enhance an existing one, security engineers ensure that your systems and data are always protected.
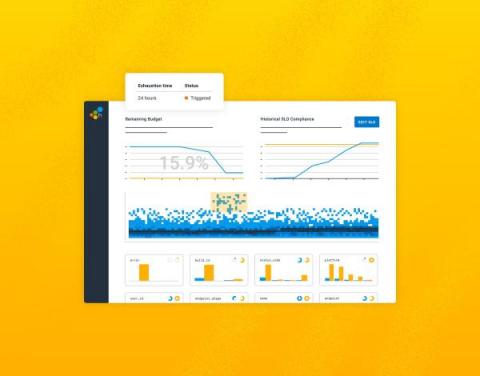
The Case for SLOs
With one key practice, it’s possible to help your engineers sleep more, reduce friction between engineering and management, and simplify your monitoring to save money. No, really. We’re here to make the case that setting service level objectives (SLOs) is the game changer your team has been looking for.
A Snapshot of our IT Ops Predictions for 2023
Today executives and customers expect IT and digital services to be available and performant at all times; compromised availability or performance is no longer tolerable. Think about it; when was the last time a digital service was unavailable and it didn’t make the news or social media? When was the last time you visited a website that was unavailable and you waited for the outage to be over, rather than finding an alternative in the moment?
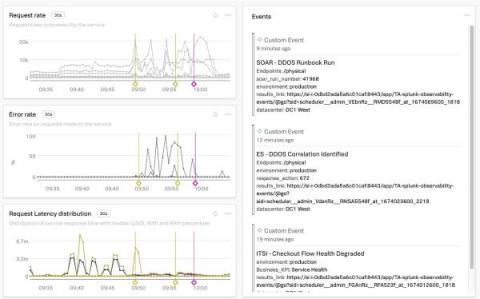
Communicating Context Across Splunk Products With Splunk Observability Events
When an IT or Security issue impacts a development team’s software how are they notified? Is your organization still relying on mass emails that lack context and most engineers have probably already filtered out of their inbox? Communicating between siloed tools and teams can be difficult. How would you like to put IT, Security, legacy processes, and business notifications specific to development teams right into one of their most important tools? Now you can!
Connecting OpenTelemetry to AWS Fargate
OpenTelemetry is an open-source observability framework that provides a vendor-neutral and language-agnostic way to collect and analyze telemetry data. This tutorial will show you how to integrate OpenTelemetry with Amazon AWS Fargate, a container orchestration service that allows you to run and scale containerized applications without managing the underlying infrastructure.
Root cause log analysis with Elastic Observability and machine learning
With more and more applications moving to the cloud, an increasing amount of telemetry data (logs, metrics, traces) is being collected, which can help improve application performance, operational efficiencies, and business KPIs. However, analyzing this data is extremely tedious and time consuming given the tremendous amounts of data being generated. Traditional methods of alerting and simple pattern matching (visual or simple searching etc) are not sufficient for IT Operations teams and SREs.
In a Toxic Relationship with Your Current Observability Search Tool? There's Other Fish in the Sea
IT tools are similar to romantic relationships. Over time, you tend to fall into the same old dull routines, like Rupert Holme’s song Escape (The Piña Colada Song). That routine — collect dataset, route, ingest ($$) and then search, collect dataset, route, ingest, then search, … this approach is not only breaking your heart but your budget too.
Get the Big Picture: Learn How to Visually Debug Your Systems with Service Map-Now Available in Sandbox
Honeycomb recently announced the launch of Service Map, a new feature that gives users the ability to quickly unravel and make sense of the interconnectivity between services in highly complex and intricate environments.
Cribl's Zachary Kilpatrick Awarded 2023 Channel Chief Award from CRN for Second Consecutive Year
The Cribl Partner Program is designed to be a comprehensive solution for organizations looking to grow their customer relationships and revenue streams, while also enabling a fast deployment of observability solutions to serve customers. Our partners receive extensive training, tools, and support to unlock the full potential of observability data for their customers.
Profiling: Buzzword or Critical Observability Tool? | Snack of the Week
Cyber Resilience: The Key to Security in an Unpredictable World
Autocatalytic Adoption: Harnessing Patterns to Promote Honeycomb in Your Organization
When an organization signs up for Honeycomb at the Enterprise account level, part of their support package is an assigned Technical Customer Success Manager. As one of these TCSMs, part of my responsibilities is helping a central observability team develop a strategy to help their colleagues learn how to make use of the product.
Ingesting custom application logs into Elastic Observability
Complete observability & monitoring of your integration infrastructure
Integration is a fundamental part of any IT infrastructure. It allows organizations to connect different systems and applications together in order to share data and information. As organizations become more complex and interconnected, they need to ensure they have complete observability and monitoring of their integration architecture. This is essential in order to discover, understand and fix any issues that can arise.
SolarWinds Observability: Helping to Accelerate Application Development
Best Practices for Enriching Network Telemetry to Support Network Observability
Network observability is critical. You need the ability to answer any question about your network—across clouds, on-prem, edge locations, and user devices—quickly and easily. But network observability is not always easy. To be successful, you need to collect network telemetry, and that telemetry needs to be extensive and diverse. And once you have that raw telemetry data, you need to interpret it.


