Operations | Monitoring | ITSM | DevOps | Cloud
October 2023
Grappling with a Nightmare on Helm Street
Do you find yourself lying awake late at night, worried that your greatest observability fears will materialize as one of the most horrific specters of Kubernetes-driven chaos reaches up through your mattress to consume your very soul?
How to Avoid Paying for Honeycomb
You probably know that we have a generous free plan that allows you to send 20 million events per month. This is enough for many of our customers. In fact, some have developed neat techniques to keep themselves underneath the event limit. I’m going to share one way here—hopefully no one at Honeycomb notices!
Security Observability - Vulnerability Dashboard and Risk Scorecard
Effortless Engineering: Quick Tips for Crafting Prompts
Large Language Models (LLMs) are all the rage in software development, and for good reason: they provide crucial opportunities to positively enhance our software. At Honeycomb, we saw an opportunity in the form of Query Assistant, a feature that can help engineers ask questions of their systems in plain English.
AppDynamics Talks Optimized Self-healing with Full-stack Observability, Auto-remediation
From an IT perspective, technologists generally agree that the ability to monitor and have visibility into the IT stack across every one of their applications is essential with the now-permanent remote and hybrid work models. It also stems from the fact that digital transformation and IT growth has accelerated by seven years since the pandemic in 2020, analysts say.
What is Observability? An Introduction
Speedscale vs. Observability tools | API World
Unlocking IT Transformation: Synergizing ITIL and AIOps for Enhanced Monitoring and Observability
Logz.io's Open 360 Observability Platform Release Updates, 2023 Q3
Logz.io is always growing and evolving based on customer usage and feedback. We add new features and quality of life improvements all the time. Here’s the round up of what we released in 2023 Q3.
Sumo Logic - Customer Brown Bag - Observability - Open Telemetry - October 24th, 2023
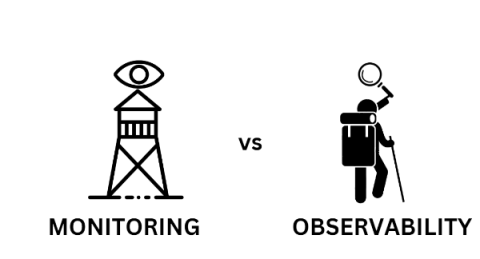
Monitoring vs Observability: What Engineers Need to Know
As systems increasingly shift towards distributed architectures to deliver application services, the roles of monitoring and observability have never been more crucial. Monitoring delivers the situational awareness you need to detect issues, while observability goes a step further, offering the analytical depth to understand the root cause of those issues. Understanding the nuanced differences between monitoring and observability is crucial for anyone responsible for system health and performance.
Challenge Met: Adopting Intelligent Observability Pipelines
Over the last year or so, the unavoidable topic of overwhelming cost has emerged as the number one issue among today’s observability practitioners. Whether it is in conversations among end users, feedback from customers and prospects, industry chatter or the coverage of experts including Gartner, the issue of massive telemetry data volumes driving unsustainable observability budgets prevails.
Start with Traces, not with Logs: How Honeycomb Helped Massdriver Reduce Alert Fatigue
Massdriver is a cloud operations platform that makes it easier for engineering teams to build, deploy, and scale cloud-native applications. While many companies use this lofty language to make similar promises, Dave Williams, CTO and co-founder at Massdriver, means it. Before Massdriver, Dave worked in product engineering where he was constantly bogged down with DevOps toil. He spent his time doing everything except what he was hired to do: write software.
Git and Get Going
Transforming Observability with Elastic AI Assistant: A Proactive, AI-Driven Approach
How to deploy a Hello World web app with Elastic Observability on Azure Container Apps
Elastic Observability is the optimal tool to provide visibility into your running web apps. Microsoft Azure Container Apps is a fully managed environment that enables you to run containerized applications on a serverless platform so that your applications scale up and down. This allows you to accomplish the dual objective of serving every customer’s need for availability while meeting your needs to do so as efficiently as possible.
Live Debugging for Critical Systems
Live debugging refers to debugging software while running in production without causing any downtime. It has gained popularity in modern software development practices, which drives many critical systems across businesses and industries. In the context of always-on, cloud-native applications, unearthing severe bugs and fixing them in real time is only possible through live debugging. Therefore, live debugging becomes an integral part of any developer’s skill set.
Cribl Stream Demo with Max Weber
Winning Big with eG Observability
Why Real-Time Debugging Becomes Essential in Platform Engineering
Platform engineering has been one of the hottest keywords in the software community in recent years. As a natural extension of DevOps and the shift-left mentality it fosters, platform engineering is a subfield within software engineering that focuses on building and maintaining tools, workflows, and frameworks that allow developers to build and test their applications efficiently.
Your Guide to Prometheus Observability
Imagine you’re piloting a spaceship through the cosmos, embarking on a thrilling journey to explore the far reaches of the universe. As the captain of this ship, you need a dashboard that displays critical information about your vessel, such as fuel levels, navigation data, and life support systems. This dashboard is your lifeline, providing you with real-time insights about the health and performance of various systems within your ship, so you can quickly make critical decisions.
Troubleshooting Cloud Native Applications at Runtime
Organizations are moving to micro-services and container-based architectures because these modern environments enable speed, efficiency, availability, and the power to innovate and scale more quickly. However, when it comes to troubleshooting distributed cloud native applications, teams face a unique set of challenges due to the dynamic and decentralized nature of these systems.
How to Parse with Regex in BindPlane
Do you need better cloud observability - or AI-powered cloud visibility?
Maybe you’re still using monolithic applications, built and refined over many years. You understand that shifting to microservices or containerized architectures is a huge and daunting task. You’re probably grappling with the limitations of legacy systems—maybe they’re slow, tough to update, or can’t scale as you’d like. And you’re likely using more traditional IT monitoring tools or even some cloud observability tools.
Breaking Through the Observability Wall: Scaling Your Telemetry Architecture
OpenTelemetry For Humans
Who is software for? It’s an interesting question, because there’s an obvious answer. It’s for the users, right? If your job is to write software, then it’s implied that the most important thing you should care about is the experience people have when they use your software.
Datadog On Maintaining eBPF at Scale
Unlocking Observability - Dive into OpenTelemetry's Top Use Cases
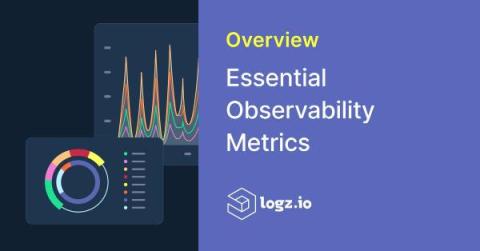
An Overview of the Essential Observability Metrics
Metrics are closely associated with cloud infrastructure monitoring or application performance monitoring – we monitor metrics like infrastructure CPU and request latency to understand how our services are responding to changes in the system, which is a good way to surface new production issues. As many teams transition to observability, collecting metric data isn’t enough.
What Happens to DevOps when the Kubernetes Adrenaline Rush Ends?
Kubernetes has been around for nearly 10 years now. In the past five years, we’ve seen a drastic increase in adoption by engineering teams of all sizes. The promise of standardization of deployments and scaling across different types of applications, from static websites to full-blown microservice solutions, has fueled this sharp increase.
A Vicious Cycle: Data Hidden Behind Lock and Key
Understanding production has historically been reserved for software developers and engineers. After all, those folks are the ones building, maintaining, and fixing everything they deliver into production. However, the value of software doesn't stop the moment it makes it to production. Software systems have users, and there are often teams dedicated to their support.
Ingesting and analyzing Prometheus metrics with Elastic Observability
In the world of monitoring and observability, Prometheus has grown into the de-facto standard for monitoring in cloud-native environments because of its robust data collection mechanism, flexible querying capabilities, and integration with other tools for rich dashboarding and visualization.
Debugging Modern Applications: Advanced Techniques
Today’s applications are designed to be always available and serve users 24/7. Performing live debugging on such applications is akin to doctors operating on a patient. Since the advent of the “as a service” model, software is like a living, breathing entity, akin to an anatomical system. Operating on such entities requires more dexterity on the developer’s part, to ensure that the software application lives on while being debugged and improved continuously.
Full Stack Observability Guide - Examples and Technologies
As modern software systems become increasingly distributed, interconnected, and complex, ensuring production reliability and performance is becoming harder and more stressful. Seemingly nondescript changes to our infrastructure or application can have massive impacts on system uptime, health, and performance, all while the cost of production incidents continues to grow.
Future-Proof Your Observability Strategy With CrowdStrike and Cribl
Traditional logging tools are struggling to keep up with the explosive pace of data growth. Data collection isn’t the most straightforward process — so deploying and configuring all the tools necessary to manage this growth is more difficult than ever, and navigating evolving logging and monitoring requirements only adds another layer of complexity to the situation.
Auto Optimize Your Observability with a Time-Based Collection Strategy
Observability has become one of the largest line items in the IT budget, second only to cloud costs. A main reason for this is teams are often stuck collecting significantly more data than they need. This is where Circonus Passport helps. Rather than filter data after it’s collected like current observability data pipeline management tools, Passport is used to filter data before it’s collected.
Maximize the campus experience with next generation observability
See how higher education institutions can leverage full-stack observability to provide the best possible application experiences for students, staff and faculty. Now more than ever, delivering a superior user experience is fundamental to digital transformation — and not just in the corporate world. Higher education has discovered the value of digital experiences for engaging and supporting students, keeping faculty productive and satisfied and creating efficiencies that save money.
The Single Pane of Glass in Modern Observability
Recently I caught up with Jamie Allen on Episode 67 of the Slight Reliability podcast to discuss the idea of a single pane of glass (SPOG). Jamie had written an article titled The Single Pain of Glass which coincidentally was what I titled Slight Reliability Episode 10. I thought given our shared use of puns and this topic that it was worth a conversation! So, what is a single pane of glass? Is it an idea with practical application? How does it fit into the world of modern observability?
meshIQ - Seeking Partners to Deliver Observability Across Integration MESH
In today's rapidly evolving technological and business landscapes, staying competitive requires more than just a great product or service. It demands a technological edge that can drive efficiency, innovation, and overall growth. This is where partnering comes into play - it's like turbocharging your business engine. Today, meshIQ is looking to turbocharge our sales teams, processes, and reach by adding power via partnerships.
Effective Remote Debugging in PyCharm
In a previous post, we looked at the remote debugging features of Visual Studio Code and how Lightrun takes the remote debugging experience to the next level. This post will examine how Lightrun enables Python remote debugging in PyCharm, the Python IDE from JetBrains.
Virtana Named in Prestigious Industry Research by Gartner
Virtana’s AI-powered platform is at the forefront of IT infrastructure management, offering a comprehensive suite of tools and services that empower IT leaders to make informed decisions on how to forecast demand and streamline operations. The rapid evolution of technology has ushered in an era of complexity and dynamism that IT leaders must navigate effectively.
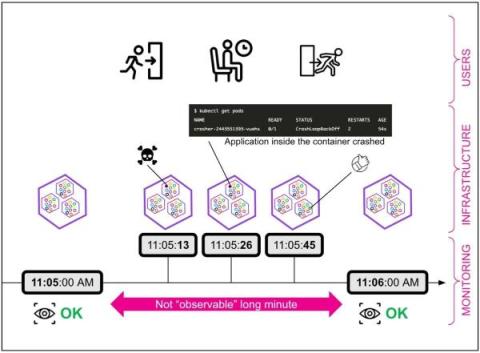
Tracing Your Steps Toward Full Kubernetes Observability
Kubernetes is one of the most important and influential technologies for building and operating software today because it’s so incredibly capable. It’s flexible, available, resilient, scalable, feature-rich and backed by a global community of innovators — that’s a pretty impressive list of intangibles to apply to any particular capability.
Observability-OSS vs Paid vs Managed OSS with Hosted Graphite
Observability is a critical aspect of modern software development and infrastructure management. It involves the ability to gain insights into the internal workings of your systems, applications, and services through monitoring and collecting relevant data. With the increasing complexity of technology stacks and the need for real-time visibility, observability has become a fundamental requirement for businesses across various industries.
How to deploy a Hello World web app with Elastic Observability on AWS App Runner
Elastic Observability is the premiere tool to provide visibility into web apps running in your environment. AWS App Runner is the serverless platform of choice to run your web apps that need to scale up and down massively to meet demand or minimize costs. Elastic Observability combined with AWS App Runner is the perfect solution for developers to deploy web apps that are auto-scaled with fully observable operations, in a way that’s straightforward to implement and manage.
When and How to Use Aggregators
Why Does Observability Need OTel?
Top 11 Splunk Alternatives in 2023
So We Shipped an AI Product. Did it Work?
Like many companies, earlier this year we saw an opportunity with LLMs and quickly (but thoughtfully) started building a capability. About a month later, we released Query Assistant to all customers as an experimental feature. We then iterated on it, using data from production to inform a multitude of additional enhancements, and ultimately took Query Assistant out of experimentation and turned it into a core product offering.


