Operations | Monitoring | ITSM | DevOps | Cloud

Go

Save up to 14 percent CPU with continuous profile-guided optimization for Go

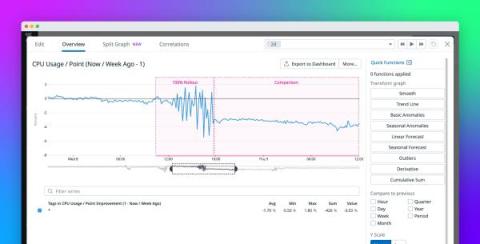
We are excited to release our tooling for continuous profile-guided optimization (PGO) for Go. You can now reduce the CPU usage of your Go services by up to 14 percent by adding the following one line before the go build step in your CI pipeline: You will also need to supply a DD_API_KEY and a DD_APP_KEY in your environment. Please check our documentation for more details on setting this up securely.

Go fixes its 7th code execution bug in the same feature

If there’s one Go programming language feature that just doesn’t seem to catch a break when it comes to security, it’s the CFLAGS and LDFLAGS handling in cgo. This is a feature that lets parts of Go source code control the compiler and linker flags that are used to build that same code.

Migrating from Elastic's Go APM agent to OpenTelemetry Go SDK

As we’ve already shared, Elastic is committed to helping OpenTelemetry (OTel) succeed, which means, in some cases, building distributions of language SDKs. Elastic is strategically standardizing on OTel for observability and security data collection. Additionally, Elastic is committed to working with the OTel community to become the best data collection infrastructure for the observability ecosystem.

How to use Tailscale for gRPC authentication in Golang

Friends of this blog know that I am a big fan of building internal tools, or as we call them, "tools that help scale people". As the name suggests, internal tools are used, well, internally and as such usually will require their access to be restricted to the company's staff and network. In the past, I've written about how to use Tailscale for authentication of internal tools using HTTP. In this post, I will show you how to use Tailscale for gRPC authentication in Golang.

How to use PGO and Grafana Pyroscope to optimize Go applications

Profile-guided optimization (PGO) is a compiler feature that uses runtime profiling data to optimize code. Now fully integrated in Go 1.21+, PGO is a powerful tool to boost application performance — and with Grafana Pyroscope, our open source continuous profiling database, you can significantly magnify the value of PGO. In this post, we’ll explore what PGO is, how the Pyroscope team has used it internally to improve performance, and how you can use PGO to make your own programs faster.

Patching Go's leaky HTTP clients

In November 2023 we discovered an issue in the Go standard library’s net/http.Client that allowed an attacker who controls redirect targets on a server to exfiltrate authentication secrets. Soon after, we discovered a similar issue in net/http/cookiejar.Jar. The issues, collectively designated CVE-2023-45289, have now been fixed in Go 1.22.1 and Go 1.21.8, released on March 5, 2024. This blog post dives into the technical details behind those two bugs and the patch that addresses them.

Go memory metrics demystified

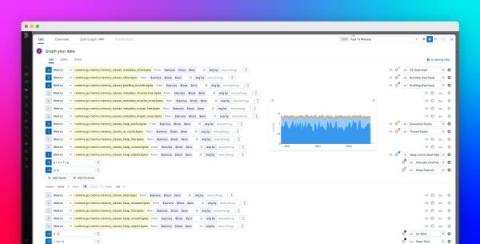
For engineers in charge of supporting Go applications, diagnosing and resolving memory issues such as OOM kills or memory leaks can be a daunting task. Practical and easy-to-understand information about Go memory metrics is hard to come by, so it’s often challenging to reconcile your system metrics—such as process resident set size (RSS)—with the metrics provided by the old runtime.MemStats, with the newer runtime/metrics, or with profiling data.

Debugging Go compiler performance in a large codebase

As we’ve talked about before, our app is a monolith: all our backend code lives together and gets compiled into a single binary. One of the reasons I prefer monolithic architectures is that they make it much easier to focus on shipping features without having to spend much time thinking about where code should live and how to get all the data you need together quickly. However, I’m not going to claim there aren’t disadvantages too. One of those is compile times.