Operations | Monitoring | ITSM | DevOps | Cloud

Java

Introducing the Elastic distribution of the OpenTelemetry Java Agent

As Elastic continues its commitment to OpenTelemetry (OTel), we are excited to announce the Elastic distribution of the OTel Java Agent. In this blog post, we will explore the rationale behind our unique distribution, detailing the powerful additional features it brings to the table. We will provide an overview of how these enhancements can be utilized with our distribution, the standard OTel SDK, or the vanilla OTel Java agent.

Instrumenting using the Java OpenTelemetry OTLP

Java has long been a foundational pillar in application development, its versatility and robustness serving as key drivers behind its widespread adoption. Since its inception, Java has evolved to meet the ever-changing demands of scalable deployments, offering a reliable platform for creating everything from web applications to complex, server-side systems.

A Guide to Log4j for Logging in Java

Log4j is a logging framework for Java, facilitating the systematic recording of runtime information in software applications. Developed by the Apache Software Foundation, Log4j has become a standard tool in Java development since its inception in 1996. Its primary purpose is to generate log messages that provide insights into the application's execution, aiding developers in debugging, monitoring, and analysing software behaviour.

Demystifying Java Lambda Expressions

SRE and IT Operations play a critical role in ensuring reliable, high-performance applications. Yet, SREs (Site Reliability Engineers) often face ‘thrown-over-the-wall’ code deployments to operate without having insights into the code-level features. In my previous article (“Is your Java Observability tool Lambda Expressions aware?”), I delved into one such code-level feature: Java lambda expressions which replace anonymous inner classes.

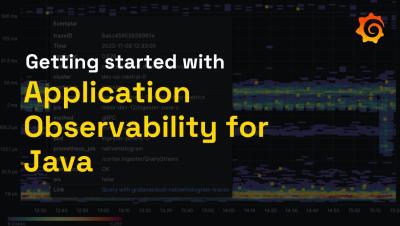
Getting started with Application Observability for Java

Links: Description: Get started with instrumenting Java applications with Grafana Cloud to observe them, detect anomalies, and find root causes. In this video, Grafana Developer Advocate Leandro Melendez outlines how to quickly get started with Application Observability for Java based on these three easy steps: Download the Grafana instrumentation agent Instrument an application and send telemetry data to the Grafana Cloud OTLP Endpoint Observe the service in Application Observability.

Detect Java code-level issues with Seagence and Datadog

In Java applications, concurrency issues can be difficult to reproduce and debug. Because work is scheduled nondeterministically across threads, the conditions that have led to an error in one execution of the program may not trigger the same issue the next time around. Exceptions that are silently handled—also known as swallowed exceptions—can also be challenging to debug because they typically do not leave any trace in the logs.

Is your Java Observability tool Lambda Expressions aware?

Most SREs and IT Ops manage Java applications without source code access or communication with AppDev teams. When applications have performance issues those SREs or IT Ops teams deploying and maintaining the infrastructure often have to prove that it is the application at fault and supply information to the app supplier which provides evidence of the issue.

Spring Boot Monitoring with Open-Source Tools

Spring Boot Monitoring aims to provide real-time insights into various aspects of a Spring Boot application. Spring Boot provides useful libraries like the Spring Boot Actuator and Micrometer to aid in monitoring. But in order to set up effective monitoring, you need to use a tool where you can send the monitoring data for storage and visualization. In this tutorial, we cover: In this tutorial, you will learn how to monitor a Spring Boot application with SigNoz and OpenTelemetry.