Operations | Monitoring | ITSM | DevOps | Cloud

Fleet Monitoring with Netdata

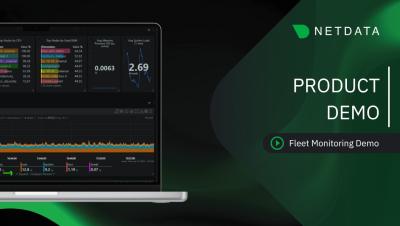
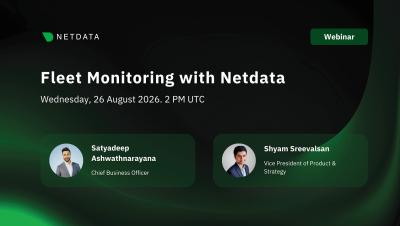
Modern infrastructure doesn't only live in data centers anymore. It's in retail stores, factory floors, vehicles, cell sites, kiosks, and robots, thousands of nodes across hundreds of locations, connected over links you don't control, in places your team can't easily reach. Traditional observability wasn't built for this. Centralizing every metric from every device gets expensive fast, degrades over constrained links, and goes blind exactly when a remote node needs attention most. In this webinar, we'll show how Netdata inverts the model by putting intelligence at the edge.

Netdata Network Topology: Live SNMP Discovery & Container Connection Maps

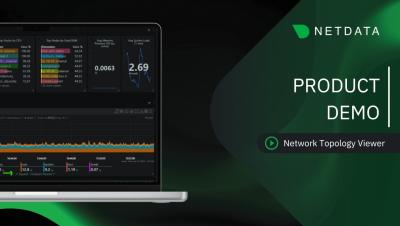
Netdata now builds live network topology maps directly in the agent: no scheduled scans, no stale picture the next morning. In this walkthrough, we cover both sides of the new Topology view: Network device discovery (SNMP): Container & process network connections.

Netdata AI & MCP: Root cause in one investigation

An alert tells you what changed. It rarely tells you why. That answer usually lives somewhere else: the pull request that shipped minutes earlier, the incident already open in PagerDuty, the runbook sitting in Confluence. Netdata AI can now reach those systems directly. Through the Model Context Protocol, it connects to the tools your team already runs and reads from them while it investigates. It pulls that context alongside the metrics, logs and anomalies Netdata detects on every node, then reasons across both.

Network Device Monitoring: Topology Maps and NetFlow

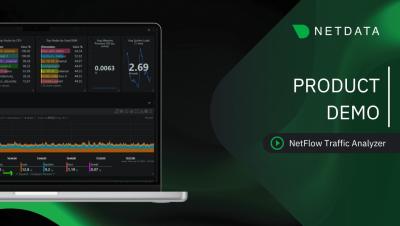
Most teams run one tool for SNMP polling, another for topology, and a third for flow analysis, then spend their time stitching the views together. This webinar shows how Netdata brings all three into a single dashboard, with 100+ vendor profiles out of the box, automatic Layer 2 topology mapping, and a flow collector that auto-detects NetFlow, IPFIX, and sFlow on a single port.

OpenTelemetry Monitoring with Netdata

If you've standardized on OpenTelemetry (or you're heading that way), you probably know the collector gets your data out, but where it lands and how useful it is once it gets there are separate problems. Netdata now ingests both OTLP metrics and OTLP logs natively, so your OTel pipelines feed directly into the same monitoring experience as everything else in your infrastructure: same dashboards, same alerting, same query interface. No separate backends, no context switching.

Release v2.10: Secrets Management, Nagios Plugin Collector, Azure Monitor, and more

What’s New in Netdata v2.10 In this release, Netdata brings powerful new capabilities to help you monitor, troubleshoot, and understand your infrastructure faster without complexity. In this video, we walk through the key updates: Secrets Management – Securely manage sensitive configuration data Nagios Plugins Collector – Extend monitoring using existing Nagios plugins Azure Monitor – Bring Azure metrics into Netdata for unified visibility.