Operations | Monitoring | ITSM | DevOps | Cloud

eBPF Linux Command Line Tools

eBPF is a powerful technology used by many observability solutions, including Coroot. While web-based observability tools like Coroot are invaluable, there’s a specific class of eBPF tools that often go overlooked (besides Brendan Gregg of course): eBPF Linux Command Line Tools. These tools are essential for diving deep into complex performance issues. But first – why would you need those at all if you have convenient observability focused web applications?

runqlat and runqslower - eBPF command line tools

In this blog post we will look at runqlat and runqslower commands. They are available in both BCC and bpftrace tool collections. One of the core functions of Linux operating system is to schedule processes across available CPUs. When service gets a request, Linux typically will need to schedule the process, processing that request to run on one of CPUs. This might be very quick process if idle CPU is available or it can take significant time, if all CPUs are currently busy running different processes.


The four pillars of observability

When discussing the technical foundations of observability, several key components, often referred to as the “pillars,” emerge. While there is no universally agreed-upon number of pillars, this post will focus on four fundamental elements: metrics, logs, traces, and profiles. Due to the vast amount of data generated by metrics, logs, and traces, sampling is often employed to reduce data volume while maintaining representative information.

Coroot v1.4: Data Transfer Cost Monitoring and More

We’re excited to announce the release of Coroot v1.4! Along with various UI improvements, this update brings a new feature: network traffic monitoring. Now, you can easily see how much data is being transferred between your applications and, more importantly, how much it costs. Let’s dive into the details. In this post, we’ll explore the enhancements and new features included in this release.

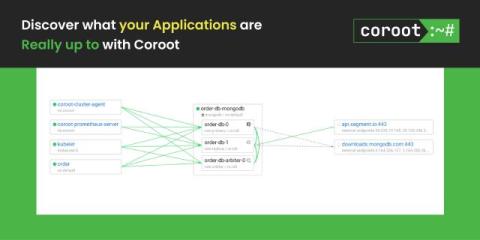
Discover what your applications are really up to with Coroot

Modern Applications can use a lot of external services, some of those interactions are expected, others not so much. There could be many reasons for those unexpected interactions, ranging from security vulnerabilities and various malware to outdated code and various reporting and statistics software may report to its creator or a third party. These unexpected interactions can be a security risk, and may also raise privacy concerns.

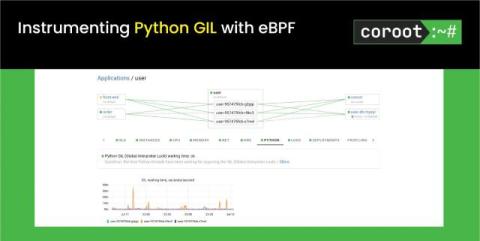
Instrumenting Python GIL with eBPF

Every Python developer has heard about the GIL (Global Interpreter Lock) This lock simplifies memory management and ensures thread safety, but it also limits the performance of multi-threaded, CPU-bound programs because threads can’t run Python code in parallel. Here is a great explanation of why Python requires the GIL by Python’s creator, Guido van Rossum: Guido van Rossum: Will Python ever remove the GIL? | Lex Fridman Podcast Clips.

What Developers Should Know about Observability

Peter is a serial entrepreneur and co-founder of Percona, FerretDB, and other tech companies. As a leading expert in open-source strategy and database optimization, Peter has applied his technical knowledge and entrepreneurial drive to contribute as a board member and advisor to several open-source startups. His insights into performance optimization and system reliability play a crucial role in shaping Coroot’s functionality.

Why should you care about DNS Observability?

If you look at typical Application interaction with service point it tends to happen in two stages – first we connect to the Service and when we are interfacing through that established connection. In this description though one thing stays invisible – you can’t simply connect to the Service through the hostname – that host name needs to be resolved into an IP address, and if this name resolution process does not work or does not perform, the application suffers.

It is the time to simplify Observability!

I come from the database world where observability, or monitoring as we used to call it, was always really important to keep databases up and running and operating well. Thousands of data points would be collected and displayed in countless graphs. As an expert DBA, you can see every detail about internal database operations and feel very good about yourself being able to put all this data together and resolve the puzzle.

Coroot v1.0: Unified Observability for Heterogeneous Infrastructures

In the current cloud-native era, almost every organization has one or more Kubernetes clusters in their production infrastructures. However, only a small percentage of companies, especially enterprise-level ones, can claim that they are fully committed to running everything exclusively on Kubernetes. The most typical scenario is that new stateless services are deployed on Kubernetes, while legacy applications, third-party services, and databases continue to run on dedicated VMs or bare-metal nodes.