Operations | Monitoring | ITSM | DevOps | Cloud
June 2022
Why the partner ecosystem is critical to full-stack observability
The best way to provide full-stack observability across applications, network and infrastructure is by offering a comprehensive partner ecosystem. Here's how to do it.
Open Source Single Pane of Glass Monitoring | SigNoz
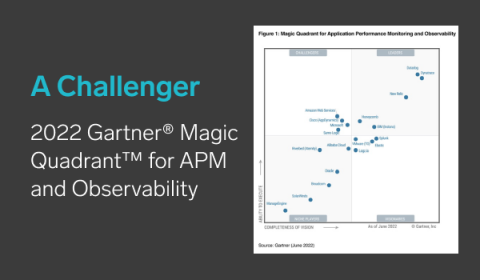
We're thrilled to be positioned in the 2022 Gartner Magic Quadrant for Application Performance Monitoring and Observability!
We are elated to announce that ManageEngine has been recognized in the Gartner® Magic Quadrant™ for Application Performance Monitoring and Observability for the tenth time! The applications performance monitoring industry has grown tremendously over the past decade and the wide range of vendors highlights this growth.
Monitoring Moodle Applications to Deliver High Quality Educational Services
In this article, we will cover a case study of one of our higher education customers using eG Enterprise to proactively monitor and troubleshoot their Moodle applications to ensure service availability and performance for their staff and students.
This Month in Datadog: Episode 12
NextJS - Monitoring your NextJS application using OpenTelemetry and SigNoz
Elixir - Monitor your Elixir Application with OpenTelemetry and SigNoz
Docker Stats | Understand how to monitor Docker Metrics with docker stats
Partners and Customers are excited about AppDynamics Cloud
VP, Global Channels and Strategic Alliances AppDynamics Mark Maslach discusses the excitement around AppDynamics Cloud and how we’re helping our partners and their customers deliver exceptional application experiences.
.NET - Monitor a .NET Application with OpenTelemetry and SigNoz
FastAPI - Monitoring your FastAPI Application using OpenTelemetry with SigNoz
Express - Monitoring your Express Application using OpenTelemetry and SigNoz
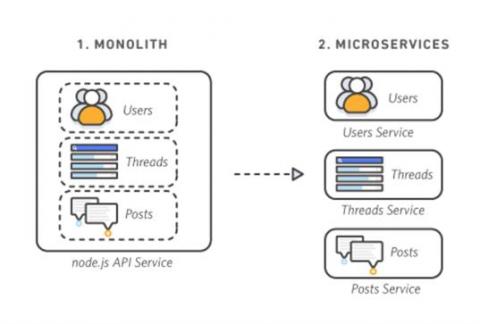
The Ultimate Crash Course on Microservices: The 5 Key Questions and Answers to Know in 2022
Over the past decade, organizations have reinvented themselves through digital transformation. Nowadays, this journey is well in its second chapter and gaining momentum – also driven by the explosion of app and service deployment, data and intelligence, digital reach, and post-pandemic customer expectations. And the newest cutting-edge technological trends – such as hybrid infrastructure and edge computing – are making it particularly difficult for traditional tools to keep up.
Choosing an OpenTelemetry backend - Things to keep in mind
Agents of Transformation: Helping IT teams achieve greatness at The University of Texas at San Antonio
With a broad, cross-functional mindset and a boost from AppDynamics, The University of Texas at San Antonio’s (UTSA) IT team has morphed from an error-resolving group into an innovation machine. Here's how they did it.
Retrace Power User Tips and Tricks - Extending APM
Retrace is the full lifecycle APM solution that includes tools and capabilities far beyond your typical APM tool. With sophisticated log management, detailed code tracing, deployment tracking and more, Retrace delivers what your DevOps team needs most to resolve issues before impacting users. By extending usability beyond traditional APM functionality, Retrace provides greater value than competitive products. But where would Retrace be without robust APM functionality?
How The Washington Post uses Datadog to detect and respond to traffic spikes early
APM Vision for Open Source and Security
Earlier this month, we shared exciting news with our first placement in the 2022 Gartner® Magic Quadrant™ for Application Performance Monitoring and Observability: we are in the Visionary Quadrant. This research is near to my heart, as I led this research for four years; so, I wanted to reflect on why this is an accurate placement for Logz.io. The Visionary Quadrant is designated for those organizations who are pushing the boundaries of a specific market and technology.
Leverage business insights for faster app security prioritization
We’re near the tipping point where without the right tools, siloed application development and security prioritization can hinder essential business transactions. Here’s what you need to know.
Supporting Circular IT and Zero Waste Strategies with Flexible Licensing
Circular IT and Zero Waste Strategies are vital goals for eG Innovations. To support this initiative, we offer flexible licensing options that meet the needs of clients regardless of the solution they choose to employ.
Ruby - Tracing a Ruby application with OpenTelemetry for performance monitoring
NestJS - Monitoring your NestJS Application using OpenTelemetry and SigNoz
Prometheus vs Elasticsearch stack - Key concepts, features, and differences
Integrate with AppDynamics | Moogsoft Product Videos & How-Tos
Three Key AppDynamics Takeaways from Cisco Live 2022
AppDynamics had some big news to share at Cisco Live 2022. Here's a quick recap of what we announced and why it matters.
Rust - Implementing OpenTelemetry in a Rust application for performance monitoring
PHP - Monitoring a PHP application with OpenTelemetry and SigNoz
How to improve your Crash Free Users score in minutes
Using High Availability Capabilities to Make Migration of the Monitoring System Simple
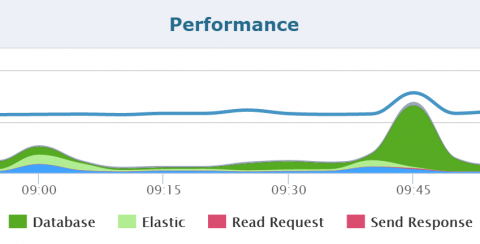
A monitoring tool and its backend database Monitoring platforms such as eG Enterprise collect large numbers of metrics and data points about the applications and infrastructure being monitored. As the complexity of the applications, the number of tiers and the scale of the infrastructure grows, so do the number of metrics that need to be analyzed. Even in a mid-sized IT infrastructure, there may be over 100s of thousands of metrics collected and analyzed over time.
AppDynamics Cloud launches at Cisco Live
Cisco debuts AppDynamics' all-new observability platform that cuts through the complexity of modern applications to give technologists a seamless, unified view of their cloud native technology landscape.
Key Takeaways - Logz.io Named a Visionary in 2022 Gartner Magic Quadrant for Application Performance Monitoring and Observability
I’m thrilled to announce today that Logz.io has been named a Visionary in the 2022 Gartner® Magic Quadrant™ for Application Performance Monitoring and Observability. Gaining this recognition from these leading industry experts, in my opinion, is an outstanding accomplishment for our entire organization – the product of years of hard work and putting the needs of our 1,300-plus customers first.
Implementing OpenTelemetry in React applications | Tutorial
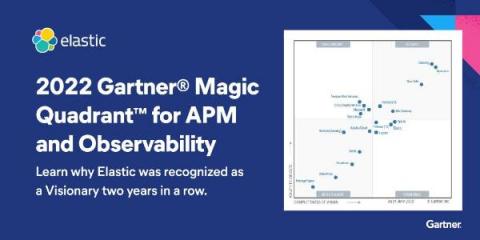
Elastic recognized as a Visionary in the 2022 Gartner Magic Quadrant for APM and Observability for the second consecutive year
We are excited to announce that Elastic has been recognized as a Visionary in the 2022 Gartner Magic Quadrant for APM and Observability for the second year in a row. In addition, the Elastic solution scored among the Top 3 vendors in five out of six use cases in the 2022 Gartner Critical Capabilities for APM and Observability.
Datadog named Leader in 2022 Gartner Magic Quadrant for APM and Observability
Gartner® has published the 2022 Magic Quadrant™ for APM and Observability, an annual report that evaluates vendors in this category. We’re honored that Datadog has been recognized as a “Leader” within this Magic Quadrant report for the second consecutive year, with the highest position for Ability to Execute.
1000+ Community Members, Async APIs for retention settings & improved UI - SigNal 13
OpenTelemetry PHP | Monitoring a PHP application with OpenTelemetry
What's on our radar: OpenTelemetry experts share their A-list OTel content
Snapshot of the content that AppDynamics’ OpenTelemetry experts, Erwan Paccard and Severin Neumann find valuable.
How to Monitor IT Infrastructure when adopting IaC for VDI and Digital Workspaces
IaC (Infrastructure-as-Code) is becoming ubiquitous in the EUC (End User Computing) community and within the datacenter. Automation and declarative infrastructure for on-premises VDI and cloud digital workspaces, such as Microsoft AVD (Azure Virtual Desktop) or AWS WorkSpaces, is now mainstream. Vendors such as Citrix now advocate the use of technologies such as Terraform and Ansible for deployments.
Sumo Logic - Challenging the status quo
Regression testing your Java Agent Plugin
For developers who’ve created their own instrumentation with the Java Agent plugin, the next phase of the process is regression testing. By performing regression testing, you can ensure that your plugin functions the way it’s supposed to after you’ve made code changes or updates. You’ll have your own plugin, but to illustrate regression testing in this article, I’ll use the plugin in our example repo.
Go instrumentation - OpenTelemetry in Go applications : Complete Tutorial with SigNoz
MEVN stack tutorial | Build a CRUD app using Vue 3, Node, Express & MongoDB
Business Application Monitoring: Why Your Company Needs APM
Imagine this scenario. Your company has been laboring for months on an application and is finally releasing it. Your team has worked out all the potential issues and has created an all-encompassing project, but something is not right. There is an issue, and your team is getting some much-needed R&R. You come the next day and see a ton of irate emails. You have to go back to the drawing boards to figure out what went wrong before you release a fix. What I explained was a nightmare.
Auditing Capabilities in IT Monitoring Tools for Security and Compliance
It is critical that access to any configuration changes or management actions made to monitoring platforms are logged and traceably audited. In this article, I will help you learn how to discover the auditing capabilities in IT monitoring tools. You will learn how to audit and manage the monitoring platform itself and make sure that it is being used appropriately.


