Operations | Monitoring | ITSM | DevOps | Cloud

August 2023

Why every developer needs to learn about source maps (right now)

You did it! Sure, it might be four weeks overdue and late on a Friday, but you’ve finally finished deploying a long-awaited update to the web app. However, your celebrations are cut short as your phone vibrates off the table. Picking it up, you’re confronted with a developer’s worst nightmare. You’re getting flooded with messages that the login is no longer working. Was it your deployment? This is bad. Nobody can use the site if they can’t log in.

Shift Left Monitoring: A Pathway to Optimized Cloud Applications

I recently worked on a customer project to migrate an in-house application to the cloud, using a shift-left monitoring and testing strategy. The original application was developed with LAMP architecture and was being migrated to Spring Boot to modernize it and then run it on the cloud. I was fortunate to be part of the conversation during the day-0 talks. Not all IT managers do this.

This Month in Datadog: DASH 2023 Recap, featuring Bits AI, Single-Step APM Instrumentation, and more

Datadog is constantly elevating the approach to cloud monitoring and security. This Month in Datadog updates you on our newest product features, announcements, resources, and events. This month, we’re recapping DASH 2023..

Datadog On Mobile Software Development

Understanding the health and user experience of your mobile application is critical in order to avoid user frustration, understand application crashes, and reduce bugs mean time to resolution. To help with that task, Datadog has a mobile monitoring solution that allows developers to better understand and improve their application. But what are the things to take into account when building observability mobile SDKs? How can we gather the right telemetry without affecting the underlying application?

The Top 4 Use Cases for Generative AI in Customer Experience

Up until recently, machines mainly focused on analyzing large, existing amounts of data and finding patterns for a multitude of use cases. This is called “traditional AI.” But lately, machines have also started creating new content. And this is now known as “generative AI.” And given the rise of ChatGPT and its peers, generative artificial intelligence (AI) has quickly emerged as one of the most transformative technologies in recent years.

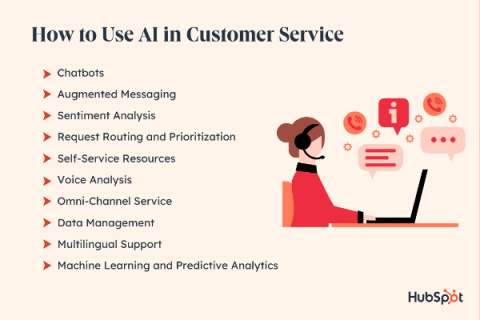
6 Underutilized Ways to Use AI in Customer Service in 2023

Artificial Intelligence (AI) is surely revolutionizing numerous industries. The AI market is projected to grow from $150 billion in 2023 to $1,345 billion in 2030, at a whopping 36.8% Compound Annual Growth Rate (CAGR). And at least 35% of companies are already using AI in their business, and an additional 42% are exploring it. However, the exhaustive list of AI business applications is still in the early stages.

The 10-Step Guide To Your Online Presence with Squarespace

Currently, there are about 1.13 billion websites around the world. Actually, 3 new websites are created every second. Even more so, it has become particularly powerful to pair a website with an ecommerce platform, thereby broadening customer reach and 24/7 accessibility. And this global e-commerce market is expected to total a whopping$6.3 trillion in 2023. 79% of shoppers already shop online at least once a month.

The Leading APM Use Cases

The majority of users continually depend on a variety of web applications to meet their everyday needs, so a business’s success is now often proportionate to the success of its application performance. As a result, the importance of using an appropriate APM solution has become even greater to businesses globally. Application Performance Monitoring (APM) still continues to grow in popularity and is now considered a must for observing the health and performance of your organization's applications.

12 Best Application Performance Monitoring (APM) Tools

In today’s fast-paced world, applications are vital for driving businesses forward. However, without proper monitoring and insights into your application’s performance, you can’t identify what causes slow response times, high CPU usage, or database bottlenecks. But with an Application Performance Monitoring (APM) tool, you can gain deep visibility into your application’s performance by tracking critical metrics.

Introducing Error Groups to the Raygun API

We’re excited to announce an important extension to our API. After rigorous research, testing, and feedback, we’ve launched the Error Groups endpoints. This powerful new addition aims to enhance your monitoring experience and better handle errors across your applications. Our primary aim with the introduction of these endpoints is to offer you a more detailed view into your applications’ error groups, and to offer a way to update their statuses using the API.

25 Essential Salesforce Monitoring Strategies for Optimal Performance and Security

In this definitive guide, we present to you the “25 Essential Salesforce Monitoring Strategies for Optimal Performance and Security.” The health of your CRM environment is pivotal to your organizational success. From analyzing user activity to optimizing API usage, from monitoring data quality to fortifying compliance measures, we’re here to equip you with the tools and knowledge to thrive.

How a Globoplay engineer discovered the power of SigNoz, with Paulo Henrique de Morais Santiago

We sit down with Globo engineer and DevOps wizard Paulo Henrique de Morais Santiago, who along with experimenting with SigNoz as a New Relic alternative for Observability, is also the author of one of the top DevOps courses on Udemy. Check out his course at More about SigNoz.

How eG Enterprise IT Monitoring Licensing is Cost-Effective and Flexible

IT monitoring tools are often complex to license and their licensing models are not always cost-effective. Today, I’ll cover some of the licensing models you may encounter as you evaluate IT monitoring tools. I will also highlight how eG Enterprise licensing makes it a cost-effective, affordable and flexible choice for our customers using our monitoring and observability platform.

Using Traces for Testing - SigNoz Community Call with TraceTest and DevOps Educator Paulo

This week we welcomed the TraceTest team to talk about how TraceTest can use your OpenTelemetry Traces to do truly deep end-to-end tracing of your stack. We also had Globo engineer and DevOps wizard Paulo Henrique de Morais Santiago, who along with experimenting with SigNoz as a New Relic alternative for Observability, is also the author of one of the top DevOps courses on Udemy. Check out his course at.

OpenTelemetry Webinars - Getting Started with OpenTelemetry

We often get asked, what's the best place to get started with OpenTelemetry - host metrics, traces, or even logs? Hosts Nočnica Mellifera and Pranay will talk about taking your first steps to gathering OpenTelemetry data Below is the recording and an edited transcript of the conversation. Find the conversation transcript below.

Parsing logs with the OpenTelemetry Collector

This guide is for anyone who is getting started monitoring their application with OpenTelemetry, and is generating unstructured logs. As is well understood at this point, structured logs are ideal for post-hoc incident analysis and broad-range querying of your data. However, it’s not always feasible to implement highly structured logging at the code level.

Part two: 7 must-know object-oriented software patterns (and their pitfalls)

Dr. Panos Patros, CPEng This is the second and final part in our exploration of must-know OOP patterns, and covers the composite bridge pattern, iterator pattern, and lock design pattern. Find part one here covering extension, singleton, exception shielding and object pool patterns. Object-oriented design is a fundamental part of modern software engineering that all developers need to understand.

Top Microsoft Azure Cloud Services Explained with Use Cases

Microsoft Azure is one of the most comprehensive and broadly adopted cloud service providers in the industry, offering over 200 fully featured services from data centers globally. A wide spectrum of organizations across all verticals use Azure – to lower costs, become more agile and innovate faster. Tight integrations with the Microsoft ecosystem and product portfolio make Azure highly attractive to many.

Generative AI and Observability Automation - Sajid Mehmood & Michael Gerstenhaber

One of the biggest challenges in observability is separating the signal from the noise. As artificial intelligence (AI) tools become more powerful and accessible, it has generated a lot of buzz around the role of AI with respect to the performance and reliability of our technical systems and the teams that build and operate them. In this fireside chat, Michael Gertenhaber (Datadog VP of Product) and Sajid Mehmood (Datadog VP of Engineering) will sift through the hype to chat about what generative AI and Large Language Models (LLMs) will really mean for the future of observability and how it can benefit your teams today.

Optimizing cloud resources and cost with APM metadata in Elastic Observability

Application performance monitoring (APM) is much more than capturing and tracking errors and stack traces. Today’s cloud-based businesses deploy applications across various regions and even cloud providers. So, harnessing the power of metadata provided by the Elastic APM agents becomes more critical. Leveraging the metadata, including crucial information like cloud region, provider, and machine type, allows us to track costs across the application stack.

CTO Fireside Chat

Building large scale technical systems is hard, but building and scaling high performing technical organizations is even more difficult. In this session, Datadog Co-founder and CTO Alexis Lê-Quôc will sit down with Prashant Pandey, Head of Engineering at Asana, to discuss their approach to engineering leadership. They’ll share the hard-learned lessons from their long careers to help you cultivate better technical teams, covering topics from staying in tune with new technologies, enabling innovation, shipping modern ML and AI-based features, and scaling teams.

Efficiency and Effectiveness

WIth unlimited money, most technology problems become easy to solve. But how do you design, build, and operate large scale, performant systems without breaking the bank? In this session, Chandru Subramanian (Director of Engineering, Runtime Efficiency at Datadog) and Neil Innes (Sr. Engineering Manager, DevOps at FanDuel) will discuss how they balance efficiency and effectiveness to save money while also meeting key goals.

OpenTelemetry Webinars - Gathering data with the OpenTelemetry Collector

Join Nočnica Mellifera and Pranay as they discuss architecting and collecting data with the OpenTelemetry Collector. We discuss using Apache Kafka queues to handle OTLP data, and why you probably shouldn't push OTel data straight to Postgres. Below is the recording and an edited transcript of the conversation. Find the conversation transcript below.👇 Nica: Hi everybody! If you're seeing this we're starting up we'll get started in just a moment here.

The Benefits of Using Application Performance Monitoring Software for Website Performance Optimization

Website performance optimization has become critical for businesses in this digital era. If you want to maintain a competitive edge and ensure exceptional user experiences, application performance software is necessary. This indispensable tool empowers businesses to monitor, analyze, and optimize their website and application performance proactively. This article will explore the seven key benefits of implementing APM software for website performance optimization.

Right Size, Right Performance, Right Time

It’s been said that, “premature optimization is the root of all evil.” Contrarily, many engineers have also had to work with software riddled with so much technical debt and inefficiency that optimization is practically impossible and a complete rewrite is required. So when is the right time? In this panel session, we’ll talk with engineering leaders and architects about their approach to software optimization, when to do it, and how to design systems that scale and stay performant.

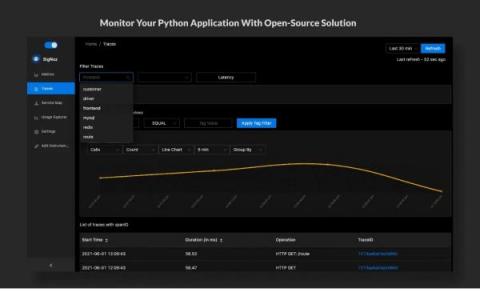
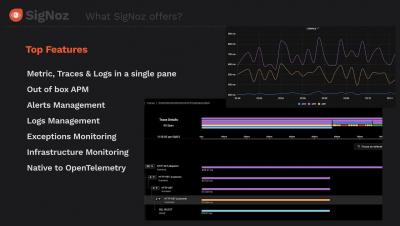
SigNoz Demo - Application Monitoring (APM), distributed tracing, Logs Management, Exceptions, Alerts

Chapters More about SigNoz: SigNoz - Monitor your applications and troubleshoot problems in your deployed applications, an open-source alternative to DataDog, New Relic, etc. Backed by Y Combinator. SigNoz helps developers monitor applications and troubleshoot problems in their deployed applications. SigNoz uses distributed tracing to gain visibility into your software stack. If you need any clarification or find something missing, feel free to raise a GitHub issue with the label documentation or reach out to us at the community slack channel.

Dashboards, Metrics & Alerts management in SigNoz

More about SigNoz: SigNoz - Monitor your applications and troubleshoot problems in your deployed applications, an open-source alternative to DataDog, New Relic, etc. Backed by Y Combinator. SigNoz helps developers monitor applications and troubleshoot problems in their deployed applications. SigNoz uses distributed tracing to gain visibility into your software stack. If you need any clarification or find something missing, feel free to raise a GitHub issue with the label documentation or reach out to us at the community slack channel.

Exceptions Monitoring in SigNoz

More about SigNoz: SigNoz - Monitor your applications and troubleshoot problems in your deployed applications, an open-source alternative to DataDog, New Relic, etc. Backed by Y Combinator. SigNoz helps developers monitor applications and troubleshoot problems in their deployed applications. SigNoz uses distributed tracing to gain visibility into your software stack. If you need any clarification or find something missing, feel free to raise a GitHub issue with the label documentation or reach out to us at the community slack channel.

Query Builder Capabilities in SigNoz

More about SigNoz: SigNoz - Monitor your applications and troubleshoot problems in your deployed applications, an open-source alternative to DataDog, New Relic, etc. Backed by Y Combinator. SigNoz helps developers monitor applications and troubleshoot problems in their deployed applications. SigNoz uses distributed tracing to gain visibility into your software stack. If you need any clarification or find something missing, feel free to raise a GitHub issue with the label documentation or reach out to us at the community slack channel.

OpenTelemetry - Why it's important?

More about SigNoz: SigNoz - Monitor your applications and troubleshoot problems in your deployed applications, an open-source alternative to DataDog, New Relic, etc. Backed by Y Combinator. SigNoz helps developers monitor applications and troubleshoot problems in their deployed applications. SigNoz uses distributed tracing to gain visibility into your software stack. If you need any clarification or find something missing, feel free to raise a GitHub issue with the label documentation or reach out to us at the community slack channel.

APM & Distributed Tracing in SigNoz

More about SigNoz: SigNoz - Monitor your applications and troubleshoot problems in your deployed applications, an open-source alternative to DataDog, New Relic, etc. Backed by Y Combinator. SigNoz helps developers monitor applications and troubleshoot problems in their deployed applications. SigNoz uses distributed tracing to gain visibility into your software stack. If you need any clarification or find something missing, feel free to raise a GitHub issue with the label documentation or reach out to us at the community slack channel.

Logs Management & Correlating Logs with Traces in SigNoz

More about SigNoz: SigNoz - Monitor your applications and troubleshoot problems in your deployed applications, an open-source alternative to DataDog, New Relic, etc. Backed by Y Combinator. SigNoz helps developers monitor applications and troubleshoot problems in their deployed applications. SigNoz uses distributed tracing to gain visibility into your software stack. If you need any clarification or find something missing, feel free to raise a GitHub issue with the label documentation or reach out to us at the community slack channel.

Monitoring Django Performance with Scout APM: A Step-by-Step Guide

Django is one of the most popular web frameworks for building applications. Its elegance and flexibility make it a favorite among developers, enabling them to craft intricate applications with ease. However, as applications grow in complexity and user traffic grows, the need for active performance monitoring becomes imperative.

New Raygun JS provider v2.27.0 to support performance timing

The popular chromium based browser ecosystem has recently changed how performance metrics can be collected in relation to performance.timing. Before we get into the details, the TLDR is: if you use the Raygun CDN for raygun4js, you’re up to date. If you self-host raygun4js and use Raygun Real User Monitoring, you’ll want to upgrade to version 2.27.0.

10 Best Dynatrace Alternatives [2023 Comparison]

Dynatrace has established itself as a prominent player in the field of application performance management, but given that Dynatrace is an expensive solution aimed at large enterprises, exploring your options is essential. This comprehensive article presents a handpicked selection of the top 10 Dynatrace alternatives, each offering distinct advantages and capabilities.

The Darkside of GraphQL

GraphQL is a query language for APIs that provides a powerful and efficient way to query and manipulate data. As powerful and versatile as GraphQL is, its downside is that it can be vulnerable to certain security threats. In this presentation, we will discuss the security vulnerabilities associated with GraphQL, from the basics to more advanced threats, and how to best protect against them. After this presentation, attendees will have a better understanding of security vulnerabilities in GraphQL, as well as an understanding of the steps needed to protect against them.

Innovating with Faster, Safer Experimentation

Experimentation is the key to innovation. But experiments come with risks, not just of failure, but of wasted time, effort, and money. I’ll share the experimental approach that NTT DOCOMO, Japan’s largest wireless provider, takes to build digital products that customers love. I’ll also present examples from experiments we performed on NTT DOCOMO’s Smart-life website that improved the user experience and significantly increased conversion rates. In this session, you’ll learn how to reduce the risk of experiments and iterate faster to improve your services.

Fixing Citrix Issues with eG Enterprise's Automation

Without any ability to self-heal, fixing Citrix usually requires manual intervention to remediate problems. This leads to time spent on mundane tasks managing the care and feeding of Citrix. Automation of these tasks for fixing Citrix provides: In our latest release, eG Enterprise v7.2, we have added new auto-correction and auto-remediation capabilities for Citrix administrators that remove the need for scripting. There are a few issues that can be a cause of constant frustration for admins.

Container Security Fundamentals - Linux Namespaces (Part 4): The User Namespace

In this video we continue our examination of Linux namespaces by looking at some details of how the user namespace can be used to de-couple the user ID inside a container from the user ID on the host, allowing a container to run as the root user without the risks of being root on the host. To learn more, read our blog on Datadog’s Security Labs site.

Diving in to OpenTelemetry data with our new Trace and Logs Explorer

The team at SigNoz would like to share recent developments released this month that greatly enhance the ability to dynamically query your trace and log data. With these tools anyone can explore complex OpenTelemetry data and gain insight into their stack.

Measuring the time between spans in an OpenTelemetry trace with a Clickhouse query

In a recent conversation on our SigNoz community Slack, a user shared their query that asks a deceptively simple question: what is the average time between two spans in a trace? The usefulness of this answer is evident if you think about how often the total trace time does not highlight the time you care about most. This could mean any number of things: that the total trace time of handling a web request might include lots of spans after a satisfying response was sent to the user.

SRE in Transition: From Startup to Enterprise

"Startups are defined by “ship or die”. As a result, SRE teams at a startup should be focused on enabling product engineers to ship features as quickly as possible. As your startup transitions from “we’ll run out of money in the next 18 months” to “we have more than 1000 engineers”, how should the SRE organization evolve and provide the best value through that transition (including booting one up if you don’t have one)? I will discuss specific ways the organization needs to evolve to meet this challenge, how the SRE org can advocate for and support this change (both in direct actions and in “influence”), and how the overhang of startup technical and cultural debt can make this shift more challenging (but also more necessary).

From On-call to Non-call: Resolving Incidents Before They Even Happen

Artificial intelligence has captured the attention of the world, with tools like ChatGPT and large language models (LLMs) driving the conversation. But you don’t need to wait for the future or new features powered by LLMs to start working smarter—the tech industry has been investing in intelligent, automated tools for years and they’re ready for production now. In this talk, you’ll learn how the engineering teams at Toyota Connected use tools like Datadog Watchdog, Anomaly Detection, and Workflows to make our lives easier and keep our platform stable.

From Solution to Startup

Before Datadog was a widely adopted SaaS platform, it was a tool developed to solve our founders’ own monitoring needs. As technology-oriented people, we often build solutions for our own problems, then discover those problems are widespread. But how do you know when your solution should be something more? In this panel session, we’ll talk with tech startup founders to hear their stories and advice for turning tools into businesses.

Deliver exceptional digital experiences with Cisco Cloud Native Application Observability

From the application layer down to your Kubernetes® infrastructure, Cisco Cloud Native Application Observability delivers cross-domain visibility with correlated MELT data and AI/ML-driven insights to simplify the complexity of observing the performance of modern applications, multi-cloud Kubernetes, and hybrid cloud infrastructure.

A guide to single-page application performance

Many of us have heard single-page applications (SPAs) hailed as the future of web applications. Proponents of SPAs point to increased code reusability and development velocity, and the advantage SPAs can give when it comes to delivering a fast and seamless user experience. Massive sites like Facebook, AirBnB and Trello are all built as SPAs. On the flipside, monitoring SPAs for performance is pretty challenging.

Elastic APM - Automatic .NET Instrumentation with OpenTelemetry

Check out this YouTube video on Elastic Application Performance Monitoring (APM) and its integration with OpenTelemetry for.NET! In this informative and practical tutorial, we delve into the world of APM and demonstrate how to effectively instrument your.NET applications using OpenTelemetry with Elastic APM. Additional Resources: Connect with us on social media.

What is Garbage Collection in Java: Detailed Guide

The Garbage Collection (GC) feature in the Java Virtual Machine (JVM) is truly remarkable. It automatically identifies and cleans up unused Java objects without burdening developers with manual allocation and deallocation of memory. As an SRE or Java Administrator you need a strong understanding of the Java Garbage Collection mechanism to ensure optimal performance and stability of your Java applications.

What Is APM and How Can It Help Your Services/Applications?

APM is one of those buzzwords that is slowly becoming a necessity. Most people are still unsure what APM means and how it can help their services. But what is it? What does it stand for? And how can it help your services or digital products? This blog will answer your questions—and more.

Dive Deeper into your Trace and Logs Data with Query Builder - Community Call Aug 1

This week for our community call we show our new Trace explorer with a GUI for creating queries, custom dashboards, and alert thresholds. Great participation from the community, thank you so much for participating. SigNoz - Monitor your applications and troubleshoot problems in your deployed applications, an open-source alternative to DataDog, New Relic, etc. Backed by Y Combinator. SigNoz helps developers monitor applications and troubleshoot problems in their deployed applications. SigNoz uses distributed tracing to gain visibility into your software stack.
Monitor gRPC calls with OpenTelemetry - explained with a Golang example

gRPC (Google Remote Procedure Call) is a high-performance, open-source universal RPC framework that Google developed to achieve high-speed communication between microservices. gRPC has Protobuf (protocol buffers) by default which would format or serialize the messages to a specific format that will be highly packed, highly efficient data. By its virtue of being a lightweight RPC, gRPC is suited for many use-cases. gRPC can be considered a successor to RPC, which is light in weight.

New Logs Explorer & Query Builder

We recently released 🛳️ updated logs explorer page and query builder in SigNoz to make experience of our logs product much more intuitive and seamless. Some of the key features: More about SigNoz: SigNoz - Monitor your applications and troubleshoot problems in your deployed applications, an open-source alternative to DataDog, New Relic, etc. Backed by Y Combinator. SigNoz helps developers monitor applications and troubleshoot problems in their deployed applications. SigNoz uses distributed tracing to gain visibility into your software stack.