Operations | Monitoring | ITSM | DevOps | Cloud
February 2021
12 Best Docker Container Monitoring Tools
Monitoring systems help DevOps teams detect and solve performance issues faster. With Docker and Kubernetes steadily on the rise, it’s important to get container monitoring and log management right from the start. This is no easy feat. Monitoring Docker containers is very complex. Developing a strategy and building an appropriate monitoring system is not simple at all.
Troubleshooting services on Google Kubernetes Engine by example
Applications fail. Containers crash. It’s a fact of life that SRE and DevOps teams know all too well. To help navigate life’s hiccups, we’ve previously shared how to debug applications running on Google Kubernetes Engine (GKE). We’ve also updated the GKE dashboard with new easier-to-use troubleshooting flows. Today, we go one step further and show you how you can use these flows to quickly find and resolve issues in your applications and infrastructure.
With SRE, failing to plan is planning to fail
People sometimes think that implementing Site Reliability Engineering (or DevOps for that matter) will magically make everything better. Just sprinkle a little bit of SRE fairy dust on your organization and your services will be more reliable, more profitable, and your IT, product and engineering teams will be happy. It’s easy to see why people think this way. Some of the world’s most reliable and scalable services run with the help of an SRE team, Google being the prime example.
Will Azure Blob Storage Rule the Unstructured Data Storage Space?
Lesson 5: Version your Kubernetes manifests WITH Helm charts
Lesson 6: Don't replicate steps, create reusable pipelines!
Getting Started with Helm and Cloudsmith
Finance: Why Getting Answers From Engineering About Your AWS Bill Is So Difficult
The Best Software Deployment Tools For 2021
Software deployment tools allow developers to ensure that software is properly installed with it’s required packages and implementation steps conducted in the correct order. Using these tools is a vital requirement for any business that creates its own software in-house. There is a variety of software that can assist developers in launching their latest code with new ones (such as GitHub Actions) arriving to the forefront of many growing consideration lists.
Announcing Updated Analytics Filters to Dive Even Deeper into your Historic Incident Data
After successfully implementing a conditional evaluation engine into Runbooks, we started looking at other places in FireHydrant that would be improved with this engine. After hearing a lot of feedback from you, we’ve implemented conditions into our Analytics page. Let’s dive in and see what new things are possible with this new filtering.
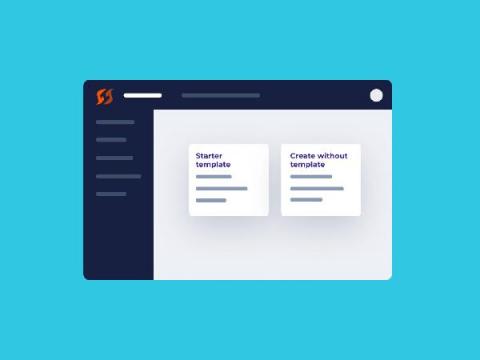
Product Updates: Creating a New Runbook Just Got Easier with Templates
Starting out with runbooks can be daunting, we've built a way to implement our best practices into a runbook that can be implemented in a single click. On top of this, there's now even more ways to attach runbooks to your incidents and a much easier way to test out the runbook that you're currently working on.
Build Trust with a Custom Domain
Security in software is now everyone’s problem. We can no longer simply rely on InfoSec teams or your equivalent Gary “he-likes-security” to handle security-related processes and issues. All software, tools, infrastructure, and services need to be trusted. It is important to us at Cloudsmith to provide you with the ability to build that trust within your teams or with your customers. Cloudsmith allows you to use your own domain name for your repositories.
What is virtualisation? The basics
Virtualisation plays a huge role in almost all of today’s fastest-growing software-based industries. It is the foundation for most cloud computing, the go-to methodology for cross-platform development, and has made its way all the way to ‘the edge’; the eponymous IoT. This article is the first in a series where we explain what virtualisation is and how it works. Here, we start with the broad strokes.
How DevOps Practices Strengthen Security & Compliance?
Companies worldwide these days make use of DevOps with a view to attain better profit and progress. Despite its increased use, DevOps can lead to higher risks if not properly handled. There should be an integration of security and development process form the beginning in order to have a risk-free progress. The entire organization will be at risk if proper security check is not practiced in each stage, as cyberattacks are increasing each day.
Civo Online Meetup #6 - Beyond the KUBE100 beta
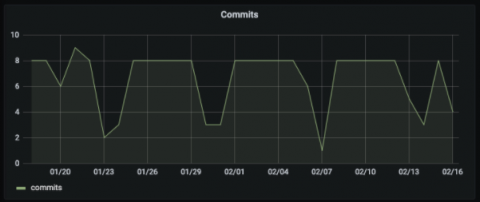
Troubleshoot problems using GitLab activity data with the new plugin for Grafana
GitLab is one of the most popular web-based DevOps life-cycle tools in the world, used by millions as a Git-repository manager and for issue tracking, continuous integration, and deployment purposes. Today, we’re pleased to announce the first beta release of the GitLab data source plugin, which is intended to help users find interesting insights from their GitLab activity data.
Coralogix - On-Demand Webinar: Drive DevOps with Machine Learning
Introduction to the ImGui C++ Library with Conan
Should We Template or Patch Kubernetes Manifests? ][#Helm vs #Kustomize side by side comparison]
6 Surprising insights from the 2020 Python survey to make you a better dev
Only Autonomous Anomaly Detection Scales
Say you’re looking for a smart product to detect anomalies in your organization’s IT environment. A sales rep drops by and shows you all kinds of great artificial intelligence (AI) features with fancy-sounding algorithms. It sounds very impressive and seems like there is a lot of very valuable AI in the product. But, in fact, the opposite is true. This is a manual AI product wrapped in a deceiving jacket. Let me tell you more.
Microservices Asynchronous Communication and Messaging | JFrog Xray
Is Your Cloud Cost Report Missing Critical Information?
Worldwide end-user spending on public cloud services is forecast to grow 18.4% in 2021, with the cloud projected to make up 14.2% of the total global enterprise IT spending market in 2024, up from 9.1% in 2020, according to Gartner. Enterprises are, therefore, rightly concerned about controlling their public cloud costs—to ensure they’re getting all the value they’re paying for.
What is MEC ? The telco edge.
MEC, as ETSI defines it, stands for Multi-access Edge Computing and is sometimes referred to as Mobile edge computing. MEC is a solution that gives content providers and software developers cloud-computing capabilities which are close to the end users. This micro cloud deployed in the edge of mobile operators’ networks has ultra low latency and high bandwidth which enables new types of applications and business use cases.
DFI and Canonical offer risk-free system updates and reduced software lead times for the IoT ecosystem
Feb. 25, 2021 – DFI and Canonical signed the Ubuntu IoT Hardware Certification Partner Program. DFI is the world’s first industrial computer manufacturer to join the program aimed at offering Ubuntu-certified IoT hardware ready for the over-the-air software update. The online update mechanism of and the authorized DFI online application store combines with DFI’s products’ application flexibility, to reduce software and hardware development time to deploy new services.
AIOps for Managed Service Providers: modernize and monetize your monitoring offering
Legacy monitoring tools weren’t built for visibility into the cloud and can obstruct your ability to compete and grow your business. Interlink Software works with MSPs to define, monetize and deliver AIOps monitoring solutions that meet the requirement for high-performing business services and hybrid cloud infrastructures that digital enterprises rely on.
Announcing Support for GKE Autopilot
Google Kubernetes Engine (GKE) is the preferred way to run Kubernetes on Google Cloud as it removes the operational overhead of managing the control plane. Earlier today, Google Cloud announced the general availability of GKE Autopilot, which manages your cluster’s entire infrastructure—both the control plane and worker nodes—so that you can spend more time building your applications.
Why Monitoring Should be a Part of Your DevOps Strategy
DevOps came about as a result of ever-growing lags between development and operation. It’s a framework that deals with communication bottlenecks, allowing for smooth change management. DevOps monitoring is a crucial element and a necessity for this framework to succeed. Monitoring plays a vital role in realizing the underlying goals of DevOps. DevOps is all about eliminating technical inefficiencies and improving the speed of the whole cycle from development to deployment.
Enhance your secrets management strategy with Puppet + HashiCorp Vault
Security is paramount in today's digital world. Bad actors can use sensitive data to wreak havoc across thousands of machines in minutes if organizations do not have a solid cybersecurity strategy. Compliance requirements and regulations are increasingly calling for key management and strong encryption as part of a business's cybersecurity strategy. These are no longer optional but mandatory security requirements as DevOps also gains in popularity for agile development and application deployment.
Tanzu Tuesdays - Modern Application Configuration in Tanzu with Craig Walls
VMware Tanzu RabbitMQ for Kubernetes
What is CircleCI?
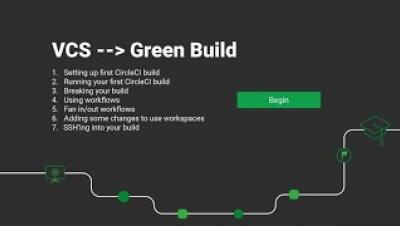
How to get your first green build on CircleCI
Is my CI pipeline vulnerable?
Your continuous integration (CI) pipelines are at the core of the change management process for your applications. When set up correctly, the CI pipeline can automate many manual tasks to ensure that your application and the environments it runs in are consistent and repeatable. This pipeline can be an integral part of your security strategy if you use it to scan applications, containers, and infrastructure configuration for vulnerabilities.
The path to production: how and where to segregate test environments
Bringing a new tool into an organization is no small task. Adopting a CI/CD tool, or any other tool should follow a period of research, analysis and alignment within your organization. In my last post, I explained how the precursor to any successful tool adoption is about people: alignment on purpose, getting some “before” metrics to support your assessment, and setting expectations appropriately.
Using the CircleCI API to build a deployment summary dashboard
The CircleCI API provides a gateway for developers to retrieve detailed information about their pipelines, projects, and workflows, including which users are triggering the pipelines. This gives developers great control over their CI/CD process by supplying endpoints that can be called to fetch information and trigger processes remotely from the user’s applications or automation systems.
Kaptain Is Aboard: v. 1.0 Is GA!
AI and Machine Learning (ML) are key priorities for enterprises, with a recent survey showing that 72% of CIOs expect to be heavy or moderate users of the technology. Unfortunately, other research has found that the vast majority—87%—of AI projects never make it into production. And even those that do often take 90 days or more to get there. Why this disconnect between intent and outcome? What are the roadblocks to enterprise ML? And what can be done about them?
Product Update: Netreo On-prem Version 12.2.26 and Netreo SaaS Upgrade
With the recent release of Netreo On-prem v12.2.26, your premiere solution for full-stack IT management and AIOps is even better! Your latest release includes powerful new features and enhancements that simplify IT management with a single source of truth about the status of your entire infrastructure.
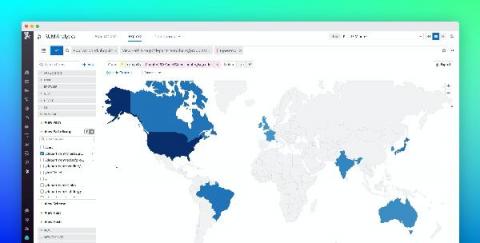
Use Datadog geomaps to visualize your app data by location
Being able to track and aggregate data by region is important when monitoring your application. It can provide visibility into where errors and latency might be occurring, where security threats might be originating, and more. Now, you can use Datadog geomaps to visualize data on a color-coded world map. This helps you understand geographic patterns at a glance, including where users are experiencing outages, app revenue by country, or if a surge in requests is coming from one particular location.
SREview Issue #10 February 2021
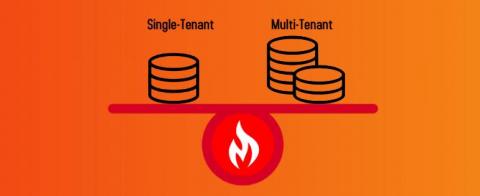
Single-Tenant Cloud vs Multi-Tenant Cloud
In this article, we shall talk about the advantages and disadvantages of single-tenant cloud and multi-tenant cloud. So let us get started! In the past decade adoption of cloud computing has been off the charts. For a long time most companies (primarily enterprises) managed their own IT infrastructure and they could reap the benefits of isolation, privacy and greater management control. This is what is known as a single tenant cloud architecture i.e.
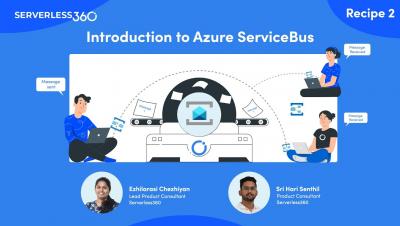
Introduction to Azure Service Bus | Serverless360
Accelerating support to Microsoft Azure Serverless resources | Serverless360 #webinar
Overview of Incident Lifecycle in SRE
Applying the Roles and Profiles Method to Compliance Code
Most of you are familiar with the roles and profiles method of writing and classifying Puppet code. However, the roles and profiles method doesn’t have to exist only in your control repository. In fact, as I’ve been developing Puppet code centered around compliance, I’ve found that adapting the roles and profiles method into a design pattern to Puppet modules makes the code more auditable, reusable, and maintainable!
JFrog Platform on AWS
Run private cloud and on-premises jobs with CircleCI runner
CircleCI has released a new feature called CircleCI runner. The runner feature augments and extends the CircleCI platform capabilities and enables developers to diversify their build/workload environments. Diversifying build environments satisfies some of the specific edge cases mentioned in our CircleCI runner announcement.
Did Something Change About FireHydrant?
If you've been familiar with FireHydrant previously, you've probably started to notice some strange things going on with the FireHydrant brand over the past several months. New pages? New content? New messaging? New colors? Yes, your eyes do not deceive you, we've been making some changes!
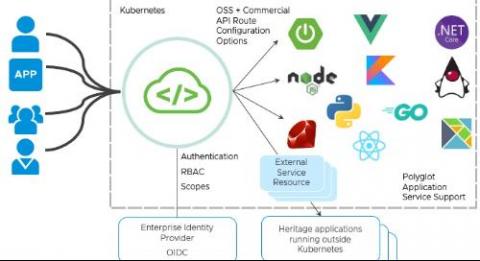
VMware Spring Cloud Gateway for Kubernetes, the Distributed API Gateway Developers Love, Is Now GA
For all the talk of digital transformation, there’s one workflow that tends to hinder release velocity: changes to API routing rules. But while—much to the consternation of enterprise developers everywhere—this process has historically remained stubbornly ticket-based, Spring Cloud Gateway removes this bottleneck. The open source project provides a developer-friendly way to route, secure, and monitor API requests.
How We Use Blameless for Deploying While Remote
All You Need To Know About Cloud Interconnection
Webinar - Step Up Your DevOps Game with 4 Key Integrations for Jira & Bitbucket
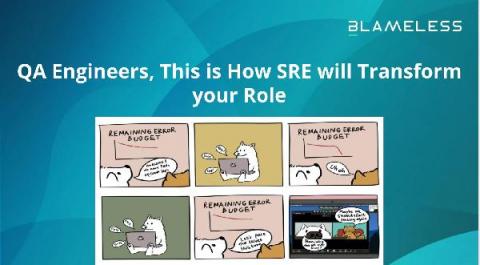
QA Engineers, This is How SRE will Transform your Role
Bringing value to our members through automation using Ocean by Spot
Accelerate your Kubernetes journey with D2iQ
Maximize your Google Cloud Investment with LogicMonitor
Enterprise App Modernisation for AKS
The next Big Thing in Azure Database Monitoring Landscape
Feature Spotlight: Golden Signals
As a team we have spent many years troubleshooting performance problems in production systems. Applications have gotten so complex you need a standard methodology to understand performance. Fortunately right now there are a couple of common frameworks we can borrow from: Despite using different acronyms and terms, they fortunately are all different ways of describing the same thing.
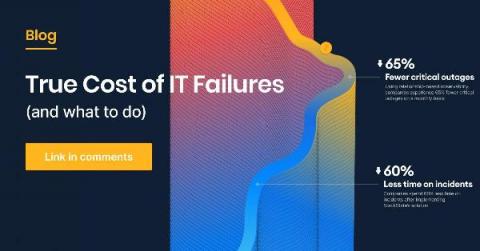
The True Cost of IT Failures (and What to Do Instead)
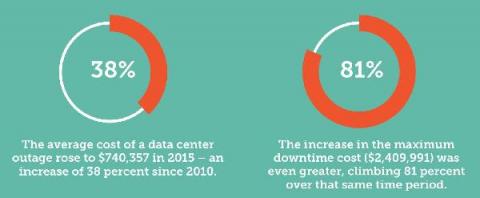
In this age of digital transformation, any issues with your IT infrastructure can cause major disruptions to your business. On top of this, IT environments that support critical business applications continue to get more complex and dynamic. As failures, outages, and incidents increase in volume and cost, the risk of an outage within your company becomes a very expensive one.
AI Chihuahua! Part II
With build-or-buy decisions, it often comes down to an all-in-one platform or a mixture of best-of-breed technologies. With open-source technology companies can actually get the best of everything. So, why not roll your own platform based on top-notch technologies? The real question is whether enterprises can afford to. Open-source software is free to use, but teams have to invest quite a bit in selecting, introducing, using, and maintaining these technologies.
Building and running FIPS containers on Ubuntu Pro FIPS
Canonical provides customers Ubuntu Pro images AWS Marketplace. Ubuntu Pro for AWS is a premium AMI designed by Canonical to provide additional coverage for production environments running in the cloud. It includes security and compliance services, enabled by default, in a form suitable for small to large-scale Linux enterprise operations — with no contract needed.
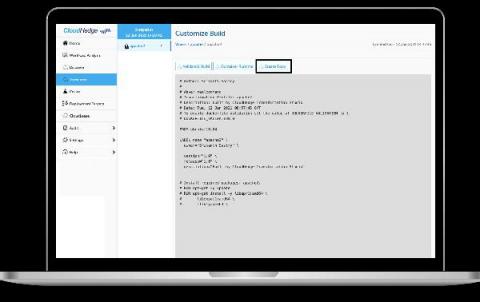
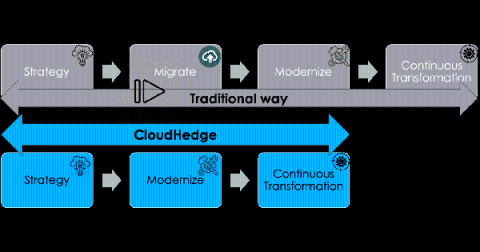
Customizing Containers during App Modernization using CloudHedge
CloudHedge Transform provides the user with the option of modifying the data that goes into the container. It uses the data gathered from the X-Ray, a part of the CloudHedge Discover module that has been performed on the process. Using the Transform Platform, the user can currently: The Edit Dockerfile feature can be used to: And the File Selection feature can be used to.
Galileo Observatory Reveal
Surveying the Tides of Cloud-Native & Open Source Observability
We can plausibly say the enterprise development market turned the tide on cloud-native development in 2020, as most net-new software and serious overhaul projects started moving toward microservices architectures, with Kubernetes as the preferred platform.
Hosted Prometheus vs. Hosted Graphite
In this article, we will discuss major features, differences, and similarities of the open-source monitoring tools known as Prometheus and Graphite. We will then dive into how you can benefit from MetricFire’s hosted Prometheus and Graphite. Lastly, we will explain why, given the choice, hosted Graphite could be a better monitoring option for you. MetricFire provides comprehensive monitoring solutions with Hosted Prometheus and Hosted Graphite.
How to reduce your AWS bill up to 60%
Let’s face it. Once you have consumed your free credit, AWS costs an arm and a leg. This is the price to pay for high-quality services. But how can you reduce your costs without sacrificing quality? This post will show you how to reduce your bill by up to 60% by combining four built-in features in Qovery. There are three categories of costs on AWS. The “data transfer”, the “compute”, and the “storage” costs.
Making CI/CD work with serverless
“Serverless computing is a cloud-computing execution model in which the cloud provider runs the server, and dynamically manages the allocation of machine resources. Pricing is based on the actual amount of resources consumed by an application.” — “Serverless Computing”, Wikipedia This mundane description of serverless is perhaps an understatement of one of the major shifts in recent years.
Azure Cost Optimization: 10 Ways to Save on Azure
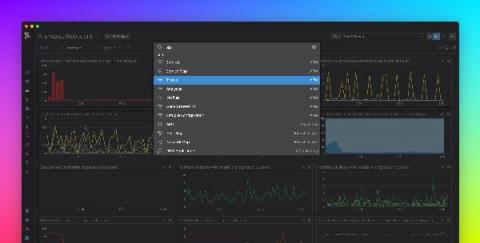
Introducing the Datadog quick nav menu
Datadog’s features give you full visibility into every part of your application environment, so it’s likely you have many resources to switch between as part of your troubleshooting and development workflows. For example, you might switch from the host map to investigate a performance issue with your services in APM, or jump between dashboards to correlate metrics and troubleshoot a problem with your CI/CD pipeline.
Taloflow raises new funding and joins Y Combinator W21 Batch
We're excited to share some updates on what we've been working on at Taloflow. We've come a long way since we launched Tim - AWS cost management for developers, which was a finalist for Product Hunt Dev Tool of the Year. Since launch, we've had the opportunity to work with nearly 100 companies and developers. We've helped digital native companies like NS1, Bluecore and Modusbox save money, improve performance, and get a better grasp of their marginal costs on the cloud.
Dispelling 7 SLA Myths That Keep Your DevOps Awake at Night
DevOps fits this odd niche between development and oversight. Like any “Wild West” type of position, pretty much anything goes. Your job is to think of everything including the stuff you haven’t thought of yet. You make the rules, and as long as the lights are on you’re considered a success. But alongside that freedom come the rumors and SLA myths that inspire such dread that you write them off as jokes.
SQL Server deployments: Which Redgate tools should you use?
Logging with the HAProxy Kubernetes Ingress Controller
The HAProxy Kubernetes Ingress Controller publishes two sets of logs: the ingress controller logs and the HAProxy access logs. After you install the HAProxy Kubernetes Ingress Controller, logging jumps to mind as one of the first features to configure. Logs will tell you whether the controller has started up correctly and which version of the controller you’re running, and they will assist in pinpointing any user experience issues.
How to Delete Unattached GCP Disks in 3 Easy Steps
Moving to the cloud brings benefits such as reduced infrastructure costs, increased scalability, and added redundancy. As your company takes advantage of the cloud, you may follow the trend to automate both the creation and destruction of cloud resources.
Surviving the disaster: How to identify bugs immediately & get back on track w/ Codefresh & Rookout
How to Monitor JavaScript Releases: Sentry + Eventbrite
Rancher Online Meetup - Feb 2020 - Longhorn 1.1 and Rancher
Portable CI/CD Environment as Code with Kubernetes, Kublr and Jenkins | KUBLR
Gartner's 2021 Strategic Roadmap for ITOps Monitoring highlights
Does your work involve a lot of ITOps Monitoring? If so, chances are you have developed a roadmap for 2021 that addresses digital business disruption, application and infrastructure changes, and the ongoing global pandemic… And here’s an opportunity to incorporate expert advice into your plan.
How Do You Measure Technical Debt? (and What To Do About It)
AI Chihuahua! Part I: Why Machine Learning is Dogged by Failure and Delays
AI is everywhere. Except in many enterprises. Going from a prototype to production is perilous when it comes to machine learning: most initiatives fail, and for the few models that are ever deployed, it takes many months to do so. While AI has the potential to transform and boost businesses, the reality for many companies is that machine learning only ever drips red ink on the balance sheet.
Microservices in the Financial Industry
In this episode of Coffee & Containers, North American DevOps Group‘s Jim Shilts speaks with Shipa‘s Bruno Andrade and Fiserv‘s Ken Owens. The topics covered include.
The State of Robotics - January 2021
A new start? 2020 came and went, and in the process, it left a mark in history and our lives that won’t be erased. Together, as a community, we all struggled, we all faced new challenges, we all united and did our best to help each other. We are grateful for the effort of our nurses, doctors, carers, scientific, essential workers, and innovators that have led this fight. We also take a moment to remember those that we have lost and those who have been affected the most.
Monitor Core Web Vitals with Datadog RUM and Synthetic Monitoring
In May 2020, Google introduced Core Web Vitals, a set of three metrics that serve as the gold standard for monitoring a site’s UX performance. These metrics, which focus on load performance, interactivity, and visual stability, simplify UX metric collection by signaling which frontend performance indicators matter the most.
JFrog CLI Plugin: build-report
Buying on AWS Reserved Instance Marketplace
While buying AWS Savings Plans and reserved instances can potentially reduce EC2 costs by up to 70%, the 1- or 3-year commitment required to achieve these savings can sometimes end up wasting more money than if you had stayed with on-demand pricing. In this article we will explore why AWS commitments can be tricky and how buying shorter-terms RIs on the Amazon Reserved Instance Marketplace can be done successfully.
5 DevOps best practices to reinforce with monitoring tools
As part of a modern software development team, you’re asked to do a lot. You’re supposed to build faster, release more frequently, crush bugs, and integrate testing suites along the way. You’re supposed to implement and practice a strong DevOps culture, read entire novels about SRE best practices, go agile, or add a bunch of Scrum ceremonies to everyone’s calendar.
Simplify Your Cloud-Native Development Workflow with Kublr
Introducing private orbs, from CircleCI
How to author a private orb on CircleCI
7 Things DBAs Should Do Before Going On Holiday
Our Relentless Roll: D2iQ Konvoy 1.7 and D2iQ Kommander 1.3 are GA!
The latest versions of Konvoy and Kommander are now generally available: the D2iQ Kubernetes Platform (DKP) continues on its relentless roll. DKP is the leading independent Kubernetes platform for enterprise grade production at scale and Konvoy and Kommander are the reason why. You can learn more about Konvoy here, Kommander here, and our general approach here.
A Stunning Cloud Mistake Too Many Companies Are Making
Cloud migration is, more often than not, treated as a one-way street where organizations migrate applications and workloads from on-premises to a public cloud, or less often, from one public cloud to another. But a key finding in our recent State of Hybrid Cloud survey of 350 IT professionals with cloud decision influence/authority is that a whopping 72% of participating organizations stated that they’ve had to move applications back on-premises after migrating them to the public cloud.
Ubuntu EKS Platform Images for k8s 1.19
Following the GA of Kubernetes 1.19 support in AWS, EKS-optimized Ubuntu images for 1.19 node groups have been released. The ami-id of this image for each region can be found on the official site for Ubuntu EKS images.
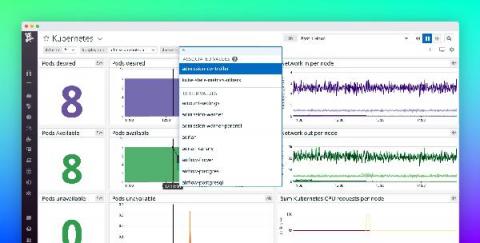
Use associated template variables to refine your dashboards
Datadog dashboards provide a foundation for monitoring and troubleshooting your infrastructure and applications, and template variables allow you to focus your dashboards on a particular subset of hosts, containers, or services based on tags or facets. We’re pleased to announce template variable associated values, which can help you speed up your troubleshooting by dynamically presenting the most relevant values for your template variables.
Monitor Red Hat Gluster Storage with Datadog
Red Hat Gluster Storage is a distributed file system, built on GlusterFS and operated by Red Hat for Linux environments. With its focus on scalability, low cost, and deployment flexibility across physical, virtual, and cloud-based environments, organizations use Gluster Storage in a variety of high-scale, unstructured data storage applications.
Getting Started as an SRE? Here are 3 Things You Need to Know.
GitHub vs GitLab
Version Control also known as Source Control, is the process of tracking and managing the changes in software. Version control software keeps track of code changes and helps development team to analyze their work, identify each change set separately, point to a change using the version number and much more. Source Control is a defacto standard right now for any development and successful deployment of your code.
Virtualization Monitoring: Answers You Were Looking For
Virtualization monitoring can ensure your virtualized infrastructure is performing at its best capacity. The chances of issues on the part of the physical server escaping your sight are quite high, as several virtual machines (VM) are sharing resources. This is why it’s important to understand everything there is to virtualization and virtualization monitoring.
Hot Telecom Super CEO Faceoff
To the cloud and beyond! Planning a multi-year data center migration
A data center migration into the cloud is often a daunting business initiative that can take years as you transition your existing hardware, software, networking, and operations into a brand new environment. In our roles with Google Cloud’s Professional Services organization, we work side by side with customers to collaboratively architect and enable data center migrations into Google Cloud. Over the years, we’ve participated in multiple migration journeys, and devised a general approach.
Cloud Analyzer's Saved Reports Deliver Optimized Reporting
As Spot by NetApp’s Cloud Analyzer usage grows, customer feedback is continuously being incorporated and added as new features and functionality. Recently, we have been adding to Cloud Analyzer’s spend analysis features, enabling more filters and options for conducting focused drill-down into spend data.
Puppet's new Scaling DevOps Service helps orgs scale DevOps practices
I’m really pleased to announce Puppet’s new Scaling DevOps Service, a pop-up consultancy inside Puppet designed to advise businesses on how to automate, streamline, and scale DevOps practices. This service was established as a result of conversations with dozens of customers who all stagnated in their DevOps evolution and turned to us for advice on how to scale that wall.
The Modern Monitoring Mullet: Business Intelligence in the Front, Machine Learning Party in the Back
Cloud 66 Feature Highlight: Team Features
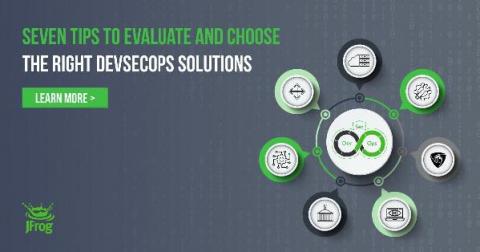
Seven Tips to Evaluate and Choose the Right DevSecOps Solutions
GitHub vs JFrog: Who Can do the Job for DevOps?
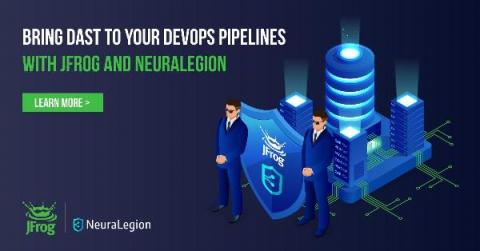
Automate DAST in DevSecOps With JFrog and NeuraLegion
Kubernetes at Scale on the Public Cloud: Q&A with Forrester Research
Today’s enterprises are pushing forward with their digital transformation initiatives to meet customer and market demand. The latest CNCF survey reports that 91% of companies are running Kubernetes and 81% of those companies are running Kubernetes in production. That’s up from 58% in 2018, and the numbers continue to ramp up quickly. There’s several approaches to how enterprises are thinking about adoption and their deployment and management of Kubernetes. I sat down with Lauren E.
AWS Lambda Container Image Support Tutorial
This is an example machine learning image recognition stack using AWS Lambda Container Images. Lambda container images can include more source assets than traditional ZIP packages (10 GB vs 250 MB image sizes), allowing for larger ML models to be used. This example contains an AWS Lambda function that uses the Open Images Dataset TensorFlow model to detect objects in an image.
How To Track Apache Server Performance
Tracking Apache server performance is important to avoid future problems. Hence, what is Apache? Apache is one of the most popular and widely used web servers. As an open source cross platform HTTP server, it can be run in a Linux, Unix, or Windows environment. Stable modular Apache architecture can be configured for multiple needs and it’s crucial to provide seamless and efficient server functionality.
Architecting Database Dev and Test Environments: Best Practices and Anti-Patterns for SQL Server
4 Things you Need to Know about Writing Better Production Readiness Checklists
Circonus Partners with Cloudbakers to Help Companies Monitor and Optimize Their Google Cloud Infrastructure
We’re excited to share today that we’ve partnered with Cloudbakers, a Google Cloud Premium Partner, in an exclusive partnership in which Cloudbakers will serve as the Google Cloud Platform reseller for Circonus, and Circonus will serve as the exclusive provider of GCP monitoring and analytics to Cloudbakers’ customers.
Graphite Dropping Metrics: MetricFire can Help!
Sometimes a seemingly well-configured and fully-functional monitoring system can malfunction and lose metrics. Subsequently, you get a distorted picture of what is happening with the monitoring object. In this article, we will look at the possible causes of Graphite dropping metrics and how to avoid it. MetricFire specializes in monitoring systems. You can use our product with minimal configuration to gain in-depth insight into your environments.
Automated browser tests EXPLAINED in code
How Puppet Supports DevOps Workflows in the Windows Ecosystem
For Windows teams that adopt a DevOps approach, augmenting their native toolset (GPO, SCCM, PowerShell) can offer reliable and repeatable processes that successfully affect change. This quick overview highlights how Puppet Enterprise can complement existing Windows tools for better visibility and transparency across the automation processes.
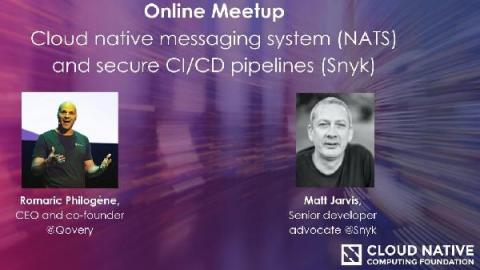
Online CNCF event: Why you should use NATS for your next Cloud native application
When building Cloud applications, we often put significant effort into breaking down our monoliths into small code pieces. They are easier to maintain but hard to make them communicate together. This is where NATS comes in. NATS is a simple and highly performant messaging system for Cloud-native apps. In this talk, I will share my experience using NATS at Qovery, why you should or should not use it, and the difference between the well-known RabbitMQ and Kafka.
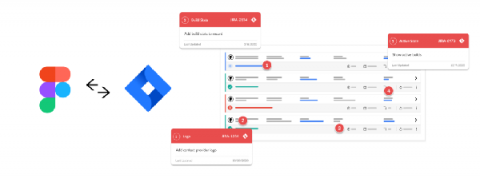
Syncing our Jira Tickets to our Designs
Are you a designer within a software company? How do you manage your tasks and collaborate on those with your team? At Codefresh we use Jira for managing all our R&D and design tasks. This post provides an overview on how we manage design related tasks in Figma and ensure the issues are visible within Figma through the use of components. If you are new to components, have a look at our previous blog post on how we use components in our Design System.
JFrog Pipelines for Shippable Customers
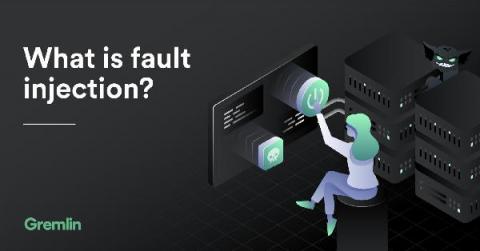
What is fault injection?
When reading about Chaos Engineering, you’ll likely hear the terms “fault injection” or “failure injection.” As the name suggests, fault injection is a technique for deliberately introducing stress or failure into a system in order to see how the system responds. But what exactly does this mean, and how does this relate to Chaos Engineering?
How to Implement Effective DevOps Change Management
A decade ago, DevOps teams were slow, lumbering behemoths with little automation and lots of manual review processes. As explained in the 2020 State of DevOps Report, new software releases were rare but required all hands on deck. Now, DevOps teams embrace Agile workflows and automation. They release often, with relatively few changes. High-quality DevOps change management is no longer a nice-to-have, it’s a must. For a lot of DevOps teams, this is easier said than done.
ZiniosEdge- The Digital Service Innovation Company in AR/VR/MR, AI/ML, Cloud, and Digital Apps.
5 Things You Need To Know About Interconnection
Top 3 approaches to monitor the health status of Azure Event Hubs
Planning an IT Automation Project
The planning of an IT automation project is crucial to success, this article takes a deep dive into areas which should be considered and addressed before embarking on an automation journey. Securing executive sponsorship and establishing governance Having the support and guidance from a senior leader within your organisation will undoubtedly benefit the delivery of your project. Implementing automation is change, and as with any change; has the potential for resistance.
Live Debug Your CI/CD Pipeline: Codefresh Quick Bites
FlashDrive Startups Program
We give entrepreneurs from around the world the opportunity to build their projects with FlashDrive, and we're grateful to be able to give back to the startup community all the help we received when we launched FlashDrive not so long ago. FlashDrive Startups Program is a free program designed for startups at various stages that provides free computational credit and dedicated support to help startups quickly get started with FlashDrive's infrastructure, innovate, and grow rapidly.
Coffee & Containers - "Application Development in the Modern World"
Talking Shipa Feb 4 2021 4
Application Development in the Modern World
In this episode of Coffee & Containers, North American DevOps Group‘s Jim Shilts speaks with Shipa‘s Bruno Andrade, VMware Tanzu‘s Gautham Pallapa, and IBM Cloud‘s Jason McGee McGee.
Using HAProxy as an API Gateway, Part 4 [Metrics]
HAProxy publishes more than 100 metrics about the traffic flowing through it. When you use HAProxy as an API gateway, these give you insight into how clients are accessing your APIs. Several metrics come to mind as particularly useful, since they can help you determine whether you’re meeting your service-level objectives and can detect issues with your services early on. Let’s discuss several that might come in handy.
All Developers Need Is a Browser - How to be more productive by having less
A quick guide to reputational risk
Virtana Migrate update Feb 2021
How CloudZero Built an Engineering Culture of Cost Autonomy
Chaos Engineering, Explained
Chaos engineering has definitely become more popular in the decade or so since Netflix introduced it to the world via its Chaos Monkey service, but it’s far from ubiquitous. However, that will almost certainly change over time as more organizations become familiar with its core concepts, adopt application patterns and infrastructure that can tolerate failure, and understand that an investment in reliability today could save millions of dollars tomorrow.
Get Unlimited Container Pulls from Docker Hub with JFrog Cloud
Security vs. Compliance: What's the difference?
The first two posts in our compliance blog series focused on managing compliance through automation. In this third post, we take a step back to explore a more foundational — but no less important — topic: What’s the difference between compliance and security? Is compliant infrastructure secure infrastructure? People often talk about compliance and security as though they’re one and the same.
Client-side load balancing in K3s Kubernetes clusters - Darren Shepherd
Your Software Is Secure Until It's Not: An Informal And Unscripted Chat On DevSecOps
CircleCI 101: Automate your development process quickly, safely, and at scale
Continuous Optimization in AWS CodePipeline using CloudFormation
For those of you who aren’t familiar with AWS CodePipeline, it’s a continuous integration and continuous delivery (CI/CD) framework that enables application development teams to deliver code updates more frequently and reliably. You may have also heard it being called a CI/CD or DevOps pipeline. These pipelines have always traditionally been used to deploy the components of a certain application whenever new code in “checked-in”.
A Day in the Life: Intelligent Observability at Work with DevOps
Thursday morning, and I’ve done some yoga, a ten-minute meditation and am at my desk in my hastily thrown up garden office with a mug of green tea by 08:30am. I’m really not missing the commute to our old HQ (now permanently closed, thanks to the pandemic) in the heart of Seattle and am enjoying an extra few minutes in bed and getting mindful before logging in.
Can AI help redefine the future of finserv?
The last few years has been a time of major disruption in the Finserv sector. Artificial Intelligence (AI) technology has emerged as an important tool for providers of financial products and services to deliver more personalised and more sophisticated services to customers faster. The financial services sector is at the beginning of an exciting journey with AI – a journey that we believe will spark a revolution and redefine financial services.
How to keep your Linux disk usage nice and tidy and save space
Everyone loves a clean, tidy home (hopefully). This also includes your other home – slash home, the Linux home directory. Disk cleanup and management utilities are extremely popular in Windows, but not so much in Linux. This means that users who want to do a bit of housekeeping in their distro may not necessarily have a quick, convenient way to figure out how to get rid of the extra cruft they have accumulated over the years. Let us walk you through the processing of slimming down your home.
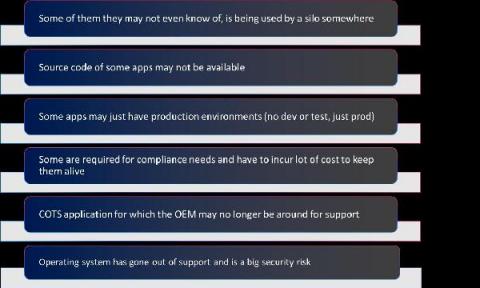
Automate Assessment and Analysis of Apps for Modernization
Thank you for reading my last blog on how to modernize age-old applications using automation. Let’s take a closer look at the available automated tools and explore the insights they extract to speed up app modernization. Assessment and Analysis The automation tool for application assessment should: There are free tools provided by cloud service providers, however, they focus more on infra (VMs and Bare Metal) and don’t focus on applications and databases (aspects mentioned above).
Customer tips for improving productivity with Redgate products
Tanzu Talk: Security is a feature
Using Puppet to detect the SolarWinds Orion compromise
SolarWinds' widely-used Orion IT platform has been the subject of a supply-chain compromise by an unidentified threat actor. The attack was discovered in December 2020, but it appears to have begun in March 2020 when the attacker used trojan malware to open a backdoor on SolarWinds customers around the world.
Ribbon Defense Solutions - IP Optical and Cloud and Edge
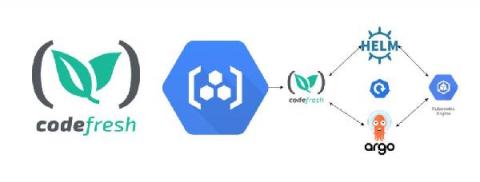
Using Google Container Registry To Invoke Codefresh Pipelines
If you are using a CI/CD tool, you likely are already familiar with workflows. Generally, workflows are a set of tasks, activities or processes that happen within a specific order. Within Codefresh, a popular workflow is to trigger Codefresh pipelines from Docker image push events. This moves the workflow forward from Continuous Integration to Continuous Deployment. Images can be promoted from one environment to the other through a variety of ways.
Enterprise DevOps: 5 Keys to Success with DevOps at Scale
How I Manage Credentials in Python Using AWS Secrets Manager
A platform-agnostic way of accessing credentials in Python. Even though AWS enables fine-grained access control via IAM roles, sometimes in our scripts we need to use credentials to external resources, not related to AWS, such as API keys, database credentials, or passwords of any kind. There are a myriad of ways of handling such sensitive data. In this article, I’ll show you an incredibly simple and effective way to manage that using AWS and Python.
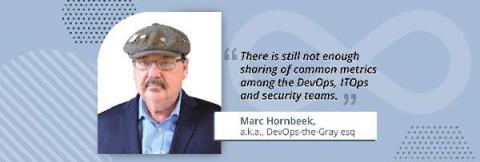
DevOps and ITOps: Come Together, Right Now
Marc Hornbeek is a DevOps consultant, author and advisor who playfully calls himself “DevOps the Gray” due to his 40-plus years of work in software development. We spoke with him about the convergence of IT operations and DevOps and what it means for the IT organization.
It's Time We Throw Out the Usage of 'Postmortem'
To put it bluntly, did someone die? In engineering, let’s hope your answer is a resounding no. So why do we continue to use the word ‘postmortem’?
Accelerate Your Container Adoption with VMware Tanzu Build Service 1.1
Building containers securely, reliably, and consistently at scale is a daunting task. Yet, it’s an imperative for organizations embracing the rapid delivery of high-quality software. This is the scenario addressed by VMware Tanzu Build Service, which can help any enterprise IT group build and update containers automatically. And it’s flexible enough to slot right into any incumbent CI/CD toolchain.
What is Chaos Engineering and How to Implement It
Chaos Engineering is one of the hottest new approaches in DevOps. Netflix first pioneered it back in 2008, and since then it’s been adopted by thousands of companies, from the biggest names in tech to small software companies. In our age of highly distributed cloud-based systems, Chaos Engineering promotes resilient system architectures by applying scientific principles. In this article, I’ll explain exactly what Chaos Engineering is and how you can make it work for your team.
4 Tips on Preparing for a [Great] Failure
What's new in Puppet 7 Platform
Hello, Puppet friends! It’s been a few months since we rolled out the latest major version of the Puppet platform, bumping PuppetDB, Puppet Server and Puppet Agent to “7.0.0.” First, we’d like to extend our gratitude to our vibrant Puppet community, who helped us immensely in locating and fixing some annoying bugs that managed to sneak through the release. We promptly provided follow-up releases, so be sure to check out the latest available versions for your operating system.
Codefresh - Platform Overview
Grafana - How to read Graphite Metrics
Before getting started on how to read Graphite metrics, let us first dive into understanding what Grafana is all about. In a nutshell, Grafana is an open source analytics and monitoring solution, developed and supported by Grafana Labs. It allows you to query, display graphs and set alerts on your time-series metrics no matter where the data is stored.
What is YAML?
YAML is a serialization language that was created in 2001, although it would take another few years before it became super popular. The acronym originally referred to Yet Another Markup Language but this was changed a few years later to YAML Ain’t Markup Language, to emphasize that developers should use it for storing data, instead of creating documents (like HTML or Markdown, for example).
Comparison: Code Analysis Tools
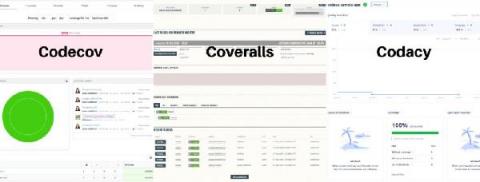
Code analysis tools are essential to gain an overview and understanding of the quality of your code. This post is going to cover the following While these tools target similar use cases, they differ in their implementation, ease of use, and documentation just to name a few. This post provides an overview of each tool as well as a detailed comparison to help analyse and decide which tool is best suited for your needs.
Do Edge Applications Need Stateful Storage?
Kubernetes applications are increasingly making their way to the edge and embedded computing. Storage will quickly follow as the applications that rely on this edge infrastructure become more advanced and naturally carry more state. According to a study by McKinsey and Company, a “connected car” processes up to 25GB of data per hour.
Solving the #1 FinOps Challenge
Cloud Native CI/CD: The Ultimate Checklist
Should You Build Your Own Cloud Cost Optimization Tool? 3 Questions To Ask Yourself
Benefits of containers for enterprises
Within just five years, Kubernetes and containers have redefined how software is deployed. Researchers expect the container market to grow by 30% year over year to become a 5 billion industry by 2022. But what is the reason behind this mass adoption of container technology in the enterprise? Download whitepaper Containers are more resource efficient than virtual machines or other legacy app architectures.
How to Modernize Applications using Automation
Automation and adoption of cloud (public and/or private) are the two key components for the success of Digital Transformation. Automation has been synonymous with the agility and scalability of applications and infrastructure. DevOps ensures quick release of apps all the way from development to test to the stage to production. Cloud ensures quick allocation of resources (Compute, Memory, Storage, Network, etc.) for the applications.
Observability vs. Monitoring in DevOps
If you strip the buzzwords and TLAs from the definition of DevOps? You’ll find that the roles and tasks involved aim mostly for more uptime and less downtime in the SDLC (software development lifecycle). The first step to achieving that is becoming aware of downtime as it happens with the help of monitoring solutions. Only then can you respond and resolve the issue in a timely manner that minimizes the dreaded and expensive downtime of software development teams.
Delivering Container Security in Complex Kubernetes Environments
You may have noticed the VMware Tanzu team talking and writing a lot about container security lately, which is no accident. As DevOps and Kubernetes adoption continue their exponential growth in the enterprise, securing container workloads consistently is among the most difficult challenges associated with that transformation. There is a term we have been seeing—and using—a lot lately that encompasses a new way of looking at container security for Kubernetes: DevSecOps.
Kubernetes Management For Dummies
Communication Tool Down? Here are 3 Ways to Handle it
5 Different Monitoring Challenges Companies are Successfully Tackling Using Circonus
At Circonus, we love hearing (and sharing) how our customers are using our platform to tackle their monitoring challenges. It’s not because we want to congratulate ourselves. Rather, it reminds us that we have to continue listening to the pains that organizations — customers and non-customers alike — are having, so we can continue to enhance our platform with the capabilities they need. This is the approach we have taken since we built Circonus.
What is MEF 3.0 and why it matters
GitOps Dashboard Overview: Codefresh Quick Bites
What is Codefresh? Platform Overview
New year, New York, new CivoStack
When we first started our managed Kubernetes beta, we knew utilising K3s as the Kubernetes distribution of choice was the right move. Not only is it light-weight and quick to deploy, K3s has features ideally suited for the scenarios we envisioned our users would encounter. It’s important for us to make sure any service we offer is 100% compatible with industry standards, and K3s allows us to do just that but with simplicity and speed for our users.
Ivanti : Automate Your App Release Pipeline with Incapptic Connect
To Build a Production App Platform with Kubernetes, Focus on Developer Experience
CircleCI Keeps Resilient Teams Ready
How to get a phone call when your API fails
How to get a phone call when your cron job fails
Yet Another Case for Using Exclude Patterns in Remote Repositories: Namespace Shadowing Attack
7 Reasons Why Serverless Encourages Useful Engineering Practices
Serverless provides benefits far beyond the ease of management…it strongly encourages “useful” engineering practices. Here’s how. It’s hard to determine what can be considered a “good” or “bad” engineering practice. We often hear about best practices, but everything really boils down to a specific use case. Therefore, I deliberately chose the word “useful” rather than “good” in the title.
Talking Shipa - "What's New in 1.2?"
Shipa is excited to launch our new webcast series, Talking Shipa. To kick this series off, we sat down with Shipa Founder and CEO, Bruno Andrade, to discuss the release of Shipa Application Management Framework for Kubernetes, version 1.2. In this video, Bruno spends a few minutes with us to talk about the new features and improvements that are packed into this new release.
Hybrid cloud - everything you need to know
Hybrid cloud allows businesses to optimise their costs associated with cloud infrastructure maintenance. It also brings many other benefits, such as business continuity, compliance, better scalability and improved agility. According to the Forrester Wave: Hybrid Cloud Management, Q4 2020, hybrid cloud is an essential technology that every modern organisation is looking for and its adoption is only expected to grow in the following years.
Beginners Guide to Incident Postmortems
Successful and blameless postmortems can turn incidents into a gift of learning and prevent repeat mistakes.
Using the Cloud Monitoring Dashboard Editor
Operationalizing Kubernetes
Organizations have now seen the value of building microservices. They are delivering applications as discrete functional parts, each of which can be delivered as a container or service and managed separately. But for every application, there are more parts to manage than ever before, especially at scale, and that’s where many turn to an orchestrator for help.
Lesson 3: Don't Couple your Application to Kubernetes Resources
Effective CI/CD with Github and the JFrog Platform
Rancher Online Meetup: January 2021 - k3d: Local Development with K3s Made Easy
Muse SDN Orchestration
Ribbon Rural Utility Solutions
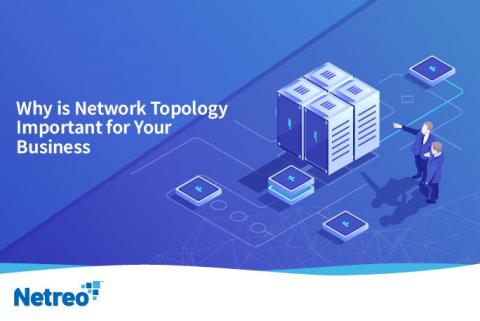
Why is Network Topology Important for Your Business?
With more and more businesses depending on technology, networking can get more and more complex. Therefore, a network topology plan, which gives you a clear oversight of what’s at stake, will always be useful. But what are the benefits of having a topology system in place? How can it help a business with its performance management in real-time? There are a variety of network monitoring tools out there that practice a topological approach to support.
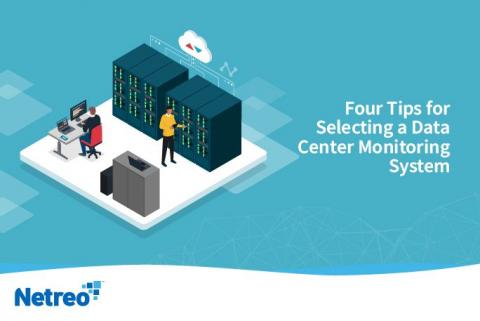
Four Tips for Selecting a Data Center Monitoring System
Data centers are some of the most critical pieces of infrastructure on the planet. Without them, many of the biggest companies would not be able to operate as they do. That’s why it is so crucial to make sure you are keeping a close eye on your data center’s performance. Data centers and server rooms are, according to some sources, getting smaller. Cloud computing, too, is moving things off-site. However, that doesn’t make them any less critical.
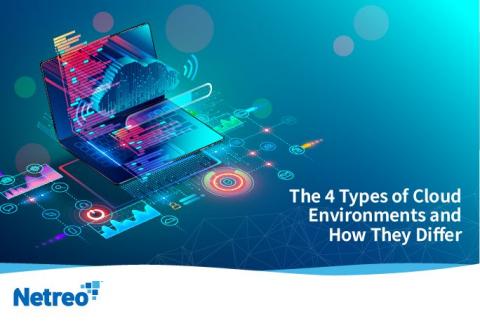
The 4 Types of Cloud Environments and How They Differ
Up to 90% of businesses are now using cloud computing to some extent. These companies are also conducting up to 60% of their work via the cloud. This data clearly shows us that cloud environments are, at last, in the mainstream. However, there is still some confusion over the different types of cloud environment. While it is easy to assume that one cloud ‘fits all,’ different types serve differing purposes.
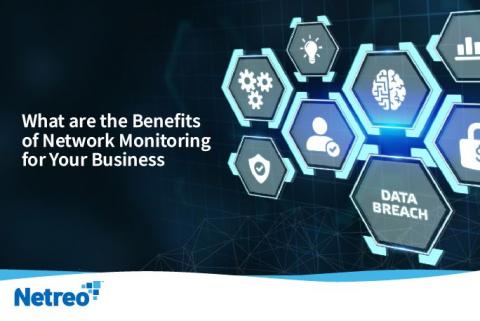
What Are the Benefits of Network Monitoring for Your Business?
In the modern age, all businesses rely on technology. Any company based in an office will depend on networking, too. But how can you be sure that your network is working hard enough for you? No matter the size or shape of your business, it pays to be careful. Without some form of monitoring solution, you, your team, and your revenue are at the mercy of your technology. For many companies, managed network monitoring solutions are essential. It is an industry that is worth $207 billion worldwide.
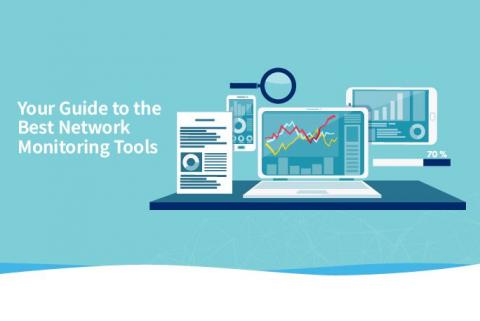
Your Guide to the Best Network Monitoring Tools
Monitoring your network is essential if you want to make sure you are protecting your productivity. However, knowing where to start is a challenge. That’s why there are multiple network monitoring tools available. But how do you necessarily know which are likely to work best for you? In this guide, we will look at some of the most popular network monitoring software available. We will also consider what each model does to help support network management in real-time.
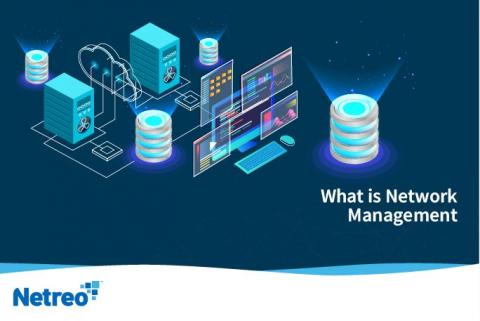
What is Network Management?
Anyone with an office in the modern age will depend on a network of some kind. Whether you are a small enterprise or a larger company, you’re likely dependent on technology. But what happens when something goes wrong with that network? Do you know how to keep track of its different components and areas? Corporate networking can be complicated. However, managing it properly is vital to make sure that you are hitting your KPIs.
Portainer recommends MicroK8s for effortless deployment
Portainer is an open source tool that allows for container deployment and management without the need to write code. In their recent publication, ‘How to deploy Portainer on MicroK8s’, the Portainer team share with the community how easy and fast it is to deploy Portainer on MicroK8s. In fact, the entire process only requires a single command! For a step-by-step walkthrough of the process, take a look at Portainer’s 5 minute video below. Install MicroK8s
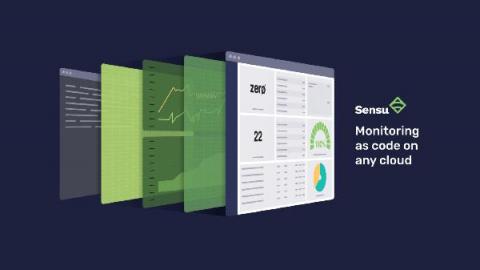
Monitoring as code: what it is and why you need it
“Everything as code” has become the status quo among leading organizations adopting DevOps and SRE practices, and yet, monitoring and observability have lagged behind the advancements made in application and infrastructure delivery. The term “monitoring as code” isn’t new by any means, but incorporating monitoring automation as part of an infrastructure as code (IaC) initiative is not the same as a complete end-to-end solution for monitoring as code.
How to diagnose why your server is down
Very often, we face situations when the website we are trying to access refuses to load. In addition, repeatedly refreshing the site also does not bring out any positive results. This is when you understand that there is something amiss with the server and that it might be down.
Air Gap Distribution in 3 Steps
The Complete Guide to Microservices
Microservices, also known as microservices architecture, refers to a method of designing and developing software systems. Microservice architecture is becoming increasingly popular as developers create larger and more advanced apps. The goal is to help enterprises become more Agile, especially as they adopt a culture of continuous testing. Here are the basic features of microservices.
Operators and Service Providers' Lucrative 5G First-Mover Opportunity
The next-generation of mobile connectivity is rapidly bringing supercharged mobile gaming, Internet of Things technology, and a smarter, better-connected world to consumers’ fingertips. As 5G rapidly evolves and brings new possibilities, it presents a wealth of opportunities for mobile network operators (MNOs) to differentiate their services with high performance applications; and for wireline operators to deliver differentiated backhaul transport services, but they need to act quickly.
Pipelines CI/CD Completes Cloud DevOps on Azure
Data Center Monitoring for Peak Performance: Challenges and Solutions
When it comes to data centers, what is ‘peak performance’? Is it a case of using a data center monitoring system so that it works to full capacity? Or, is it more a case of maximizing its potential? Data centers are complex but integral, which is why, for the average business, achieving the best results can be difficult. Challenges for data center operations will differ from firm to firm.
Machine Learning Applications for Data Center Management
The data center is a remarkably complex structure. However, they are crucial to the everyday running of even the smallest businesses and enterprises. Whether in-house, cloud, or hybrid, the average data center management requires specialist knowledge and meticulous oversight for max efficiency. That is one reason, at least, why machine learning is emerging as an ideal partner for centers of the future.
The unattainable promised land of tool consolidation
It’s on the agenda of almost every CIO, COO and CFO, and sounds like a great idea in general: tool rationalization, often trying to standardize on top of a single vendor. It can reduce costs and provide a streamlined IT Ops process through data consistency, a single pane of glass and a single source of action.
5 Things You Need To Understand To Be Successful in the Cloud
Last week my colleague, Clay Ryder, and I presented a webinar, titled No! The cloud is not someone else’s data center, in which we examined how companies can reduce the complexity of a cloud migration and accelerate the benefits of digital transformation. It’s an important topic, so as a follow-up to the session, I’ve summarized five key things you need to understand to be successful in the cloud. If you missed the session, you can listen to the full discussion at the link above.
Welcome To The Show - The Bintray Replacement
It’s finally happened. After months of whispers, JFrog have announced the sunsetting date for Bintray - their distribution add-on to their long-standing on-premises Artifactory product. It’s officially shutting down on May 1, 2021. Cloudsmith is a direct replacement for Bintray. And Artifactory. And their X-Ray product. Don’t get us wrong - JFrog has achieved a lot over the years and we would never publicly speak out against them.
Error Budgets and their Dependencies
Data Masker Headscratchers: Deterministic Data Masking
Facter 4: back to the roots
Facter is a cross platform system profiling tool. It gathers nuggets of information about a system such as its hostname, IP address and operating system. We call these nuggets of information facts and they are used by other Puppet products like Puppet, Puppet Server and Bolt to make decisions in their automation process. You can extend Facter by writing custom facts or external facts and use them in Puppet manifests.
LogicTalks: Meeting the Moment and Needs of LM Customers
Introduction to StatsD
StatsD is an industry-standard technology stack for monitoring applications and instrumenting any piece of software to deliver custom metrics. The StatsD architecture is based on delivering the metrics via UDP packets from any application to a central statsD server. Although the original StatsD server was written in Node.js, there are many implementations today, with Netdata being one of them.
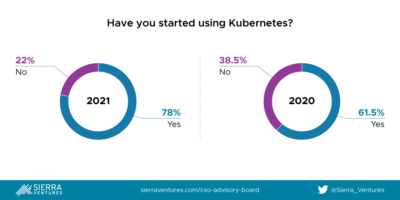
Enterprise CXO Priorities for 2021
One of the reasons we selected Sierra Ventures as one of our seed investors is because of their CXO Advisory Board. They have dozens of knowledgeable advisors across a wide variety of verticals: Healthcare, Consumer, Retail, Finance, Technology, Media and Telecom. Each year they conduct a broad survey of major trends. This kind of survey data is gold for Enterprise-focused startups.
Cloud 66 Feature Highlights: Managed Database Backups
Removing the Chaos Between Monitoring and Incident Management
The monitoring and incident management process is often chaotic and time-consuming for organizations. However, there is a better way to approach IT incidents and make your existing process function better. Topology and relationship-based observability solutions take the incident management process from chaotic to structured. Let’s look into how StackState’s solution improves and speeds up the incident resolution process.
Into the Sunset on May 1st: Bintray, JCenter, GoCenter, and ChartCenter
Cloud Suitability Analyzer: Scan and Score Your Apps' Cloud Readiness for Faster Migration
Migrating to the cloud is a significant, complicated endeavor, one that requires a realistic migration plan for any application portfolios that will be mapped out first. To get started, a detailed technical analysis of each application's cloud readiness helps determine the best cloud migration approach and strategy to take. If this sounds like a daunting process, that’s because it often is! Let's understand why.
Six Enterprises Power the Uptime of the Cloud Era with HAProxy Enterprise
"I'm Just Doing my Job," An SRE Myth
How to set AWS S3 Write Permissions with Relay
Misconfigured resources are a big contributor to compromised cloud security. If you have misconfigured Amazon S3 buckets, for example, malicious actors could access your data, then inappropriately or illegally distribute this private information, putting your company’s security at risk. Policies and regular best practices enforcement are key to reducing this security risk.
Using the SQL Change Automation PowerShell cmdlets with Jenkins
RampChat: IT Leadership In 2021 | Mark Settle | CIO Talk
How K3s implements agent tunneling in Kubernetes - Darren Shepherd
What is Ubuntu Core 20?
Standups: Don't be THAT dev
Jira Cloud Integration for Artifactory
Dead Letter Messages Streamlined - Azure Service Bus | Serverless360
Automate your Azure Monitoring Experience with Serverless360
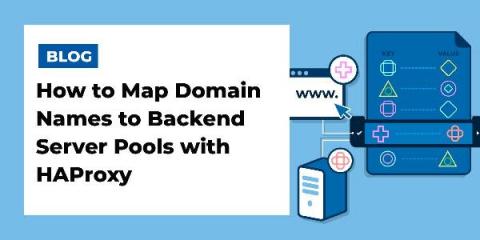
How to Map Domain Names to Backend Server Pools with HAProxy
Your HAProxy load balancer may only ever need to relay traffic for a single domain name, but HAProxy can handle two, ten, or even ten million routing rules without breaking a sweat.
Stay Alert to Security With Xray and PagerDuty
Best DevSecOps Solution: DevOps Dozen 2020 Honors JFrog Xray
Automatically debug and test CI/CD Pipeline with Dashbird
In this article, we will build a CI/CD pipeline with the AWS Cloud Development Kit (CDK) and debug a test it using Dashbird’s observability tool. In 2021, continuous integration and continuous delivery, or short CI/CD, should be part of every modern software development process. It helps deliver new features and bug fixes much faster.
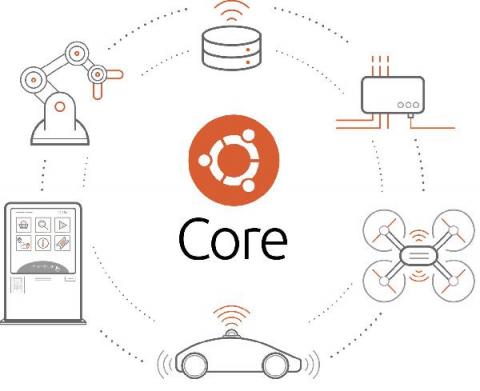
Ubuntu Core 20 secures Linux for IoT
2nd February 2021: Canonical’s Ubuntu Core 20, a minimal, containerised version of Ubuntu 20.04 LTS for IoT devices and embedded systems, is now generally available. This major version bolsters device security with secure boot, full disk encryption, and secure device recovery. Ubuntu Core builds on the Ubuntu application ecosystem to create ultra-secure smart things. “Every connected device needs guaranteed platform security and an app store” said Mark Shuttleworth.
Securing SQL Server with DoD STIGs
Redgate commits to the future of PASS
Challenges of a cloud native Spark application
Big data applications require distributed systems to process, store and analyze the massive amounts of information that companies are collecting. Apache Spark has become a go-to framework for this, powering use cases from AI and machine learning to data analysis, by providing a unified interface for distributing data processing tasks across a cluster of machines. Spark requires other services to manage the cluster, with YARN and Mesos as two well-known cluster management tools.
How to export logs from Google Cloud Logging to BigQuery
PagerDuty Xray Integration
How I Leaped Forward My Jenkins Build with JFrog Pipelines
Leap-Frog Over your Kubernetes Obstacles
In this episode of Coffee & Containers, Bruno Andrade, Founder/CEO @ Shipa and Melissa McKay, Developer Advocate @ JFrog discuss some specific Kubernetes related obstacles.
Private home directories for Ubuntu 21.04
Ubuntu has evolved a lot since its early beginnings as an easier-to-use derivative of Debian that catered primarily to the nascent Linux desktop market. Today Ubuntu is deployed beyond just your laptops at home and in the office. Nowadays you are more likely to find Ubuntu in the cloud, powering some of the world’s best known enterprises and running on various IoT devices out in the field.


