Operations | Monitoring | ITSM | DevOps | Cloud
August 2023
Dashboard Studio: How to Configure Show/Hide and Token Eval in Dashboard Studio
What's New with Fluentd & Fluent Bit
At the recent KubeCon EU, we learned the significant news of the FluentBit v2.0 major release with numerous new features. What’s new and what’s to come for this key log aggregation tool? On the latest OpenObservability Talks, I hosted Eduardo Silva, one of the maintainers of Fluentd, a creator of Fluent Bit and co-founder of Calyptia.
Accelerate your success with Splunk!
Log Data 101: What It Is & Why It Matters
Operational Intelligence: 6 Steps To Get Started
Incident Management Today: Benefits, 6-Step Process & Best Practices
Serverless Elasticsearch: Is ELK or OpenSearch Serverless Architecture Effective?
Here's the question of the hour. Can you use serverless Elasticsearch or OpenSearch effectively at scale, while keeping your budget in check? The biggest historical pain points around Elasticsearch and OpenSearch are their management complexity and costs. Despite announcements from both Elasticsearch and OpenSearch around serverless capabilities, these challenges remain. Both of these tools are not truly serverless, let alone stateless, hiding their underlying complexity and passing along higher management costs to the customer.
Resilience Training
Distributed Systems Explained
Deepening the Path from Open Source to Essential Observability
For nearly a decade, Logz.io has offered a proven pathway for organizations using the world’s most popular open source tools to monitor and analyze their cloud systems—allowing them to enlist a far more efficient and cost-effective approach.
Why Observability Architecture Matters in Modern IT Spaces
Observability architecture and design is becoming more important than ever among all types of IT teams. That’s because core elements in observability architecture are pivotal in ensuring complex software systems’ smooth functioning, reliability and resilience. And observability design can help you achieve operational excellence and deliver exceptional user experiences. In this article, we’ll delve into the vital role of observability design and architecture in IT environments.
The Quirky World of Anomaly Detection
Coralogix Deep Dive - Remote Query for Logs
High Performance Archive Queries in Coralogix
Manually Fetching Elasticsearch Metrics #devops #elasticsearch
The Leading APM Use Cases
The majority of users continually depend on a variety of web applications to meet their everyday needs, so a business’s success is now often proportionate to the success of its application performance. As a result, the importance of using an appropriate APM solution has become even greater to businesses globally. Application Performance Monitoring (APM) still continues to grow in popularity and is now considered a must for observing the health and performance of your organization's applications.
Parquet File Format: The Complete Guide
How you choose to store and process your system data can have significant implications on the cost and performance of your system. These implications are magnified when your system has data-intensive operations such as machine learning, AI, or microservices. And that’s why it’s crucial to find the right data format. For example, Parquet file format can help you save storage space and costs, without compromising on performance.
Deleting Fields with BindPlane OP
How to deploy Hello World Elastic Observability on Google Cloud Run
Elastic Cloud Observability is the premiere tool to provide visibility into your running web apps. Google Cloud Run is the serverless platform of choice to run your web apps that need to scale up massively and scale down to zero. Elastic Observability combined with Google Cloud Run is the perfect solution for developers to deploy web apps that are auto-scaled with fully observable operations, in a way that’s straightforward to implement and manage.
Blackhat 2023 Recap: How Will Advanced AI Impact Cybersecurity?
Getting started with Grafana Loki (Grafana Office Hours #09)
Mean Time to Repair (MTTR): Definition, Tips and Challenges
Coralogix Deep Dive - Events2Metrics
When Two Worlds Collide: AI and Observability Pipelines
What is a Real-Time Data Lake?
Big Data Analytics: Challenges, Benefits and Best Tools to Use
Everything You Need To Know About Log Viewers
Whatever the size of your network, as an engineer you will often notice a significant amount of log data being generated. This data will require centralizing for further analysis and management, which can be particularly challenging if you have varying log formats, such as plain text or HTML.
Coralogix vs Splunk: Support, Pricing and More
Splunk has become one of several players in the observability industry, offering a set of features and a specific focus on legacy and security use cases. That being said, how does Splunk compare to Coralogix as a complete full-stack observability solution? Let’s dive into the key differences between Coralogix vs Splunk, including customer support, pricing, cost optimization, and more.
Comparing Six Top Observability Software Platforms
When it comes to observability, your organization will have no shortage of options for tools and platforms. Between open source software and proprietary vendors, you should be able to find the right tools to fit your use case, budget and IT infrastructure. Observability should be cost-efficient, easy to implement and customers should be provided with the best support possible.
The Future of Observability: Navigating Challenges and Harnessing Opportunities
Observability solutions can easily and rapidly get complex — in terms of maintenance, time and budgetary constraints. But observability doesn’t have to be hard or expensive with the right solutions in place. The future of your observability can be a bright one.
Splunk and the Four Golden Signals
How we scaled Grafana Cloud Logs' memcached cluster to 50TB and improved reliability
Grafana Loki is an open source logs database built on object storage services in the cloud. These services are an essential component in enabling Loki to scale to tremendous levels. However, like all SaaS products, object storage services have their limits — and we started to crash into those limits in Grafana Cloud Logs, our SaaS offering of Grafana Loki.
Getting to the Root Cause of an Application Error
From Service to Seeking Opportunities: How to Translate Your Talents to the Workplace
How to get actionable insights from your data
“When you peel back business issues, more times than not, you will find that the root cause is directly tied to data problems,” says Matthew Minetola, CIO at Elastic®. In today's world, all companies, new and old, are awash in data from multiple sources — stored in multiple systems, versions, and formats — and it’s getting worse all the time.
How to Log HTTP Headers With HAProxy for Debugging Purposes
HAProxy offers a powerful logging system that allows users to capture information about HTTP transactions. As part of that, logging headers provides insight into what's happening behind the scenes, such as when a web application firewall (WAF) blocks a request because of a problematic header. It can also be helpful when an application has trouble parsing a header, allowing you to review the logged headers to ensure that they conform to a specific format.
Code, Coffee, and Unity: How a Unified Approach to Observability and Security Empowers ITOps and Engineering Teams
Data Quality Metrics: 5 Tips to Optimize Yours
Amid a big data boom, more and more information is being generated from various sources at staggering rates. But without the proper metrics for your data, businesses with large quantities of information may find it challenging to effectively and grow in competitive markets. For example, high-quality data lets you make informed decisions that are based on derived insights, enhance customer experiences, and drive sustainable growth.
IT Orchestration vs. Automation: What's the Difference?
Sumo Logic Customer Brown Bag - Observability - Alert Response - August 22, 2023
Simplifying Data Lake Management with an Observability Pipeline
Data Lakes can be difficult and costly to manage. They require skilled engineers to manage the infrastructure, keep data flowing, eliminate redundancy, and secure the data. We accept the difficulties because our data lakes house valuable information like logs, metrics, traces, etc. To add insult to injury, the data lake can be a black hole, where your data goes in but never comes out. If you are thinking there has to be a better way, we agree!
Lookup Tables and Log Analysis: Extracting Insight from Logs
Extracting insights from log and security data can be a slow and resource-intensive endeavor, which is unfavorable for our data-driven world. Fortunately, lookup tables can help accelerate the interpretation of log data, enabling analysts to swiftly make sense of logs and transform them into actionable intelligence. This article will examine lookup tables and their relationship with log analysis.
Top Elasticsearch Metrics to Monitor | Troubleshooting Common error in Elasticsearch
A Complete Guide to Tracking CDN Logs
The Content Delivery Network (CDN) market is projected to grow from 17.70 billion USD to 81.86 billion USD by 2026, according to a recent study. As more businesses adopt CDNs for their content distribution, CDN log tracking is becoming essential to achieve full-stack observability. That being said, the widespread distribution of the CDN servers can also make it challenging when you want visibility into your visitors’ behavior, optimize performance, and identify distribution issues.
Parsing logs with the OpenTelemetry Collector
What Is ITOPs? IT Operations Defined
Developing the Splunk App for Anomaly Detection
Exploring & Remediating Consumption Costs with Google Billing and BindPlane OP
BindPlane OP Architecture Overview
How Gaming Analytics and Player Interactions Enhance Mobile App Development
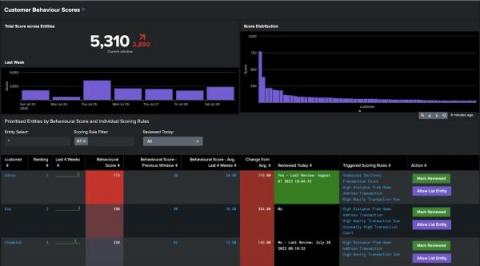
Introducing the Splunk App for Behavioral Profiling
How to Strengthen Kubernetes with Secure Observability
Kubernetes is the leading container orchestration platform and has developed into the backbone technology for many organizations’ modern applications and infrastructure. As an open source project, “K8s” is also one of the largest success stories to ever emanate from the Cloud Native Computing Foundation (CNCF). In short, Kubernetes has revolutionized the way organizations deploy, manage, and scale applications.
How to Effortlessly Deploy Cribl Edge on Windows, Linux, and Kubernetes
Collecting and processing logs, metrics, and application data from endpoints have caused many ITOps and SecOps engineers to go gray sooner than they would have liked. Delivering observability data to its proper destination from Linux and Windows machines, apps, or microservices is way more difficult than it needs to be. We created Cribl Edge to save the rest of that beautiful head of hair of yours.
What Is AI Monitoring and Why Is It Important
Artificial intelligence (AI) has emerged as a transformative force, empowering businesses and software engineers to scale and push the boundaries of what was once thought impossible. However as AI is accepted in more professional spaces, the complexity of managing AI systems seems to grow. Monitoring AI usage has become a critical practice for organizations to ensure optimal performance, resource efficiency, and provide a seamless user experience.
Unveiling Splunk UBA 5.3: Power and Precision in One Package
Getting _____________ for Less from Your Analytics Tools
Apica Acquires LOGIQ.AI to Revolutionize Observability
In the world of observability, having the right amount of data is key. For years Apica has led the way, utilizing synthetic monitoring to evaluate the performance of critical transactions and customer flows, ensuring businesses have important insight and lead time regarding potential issues.
Optimizing cloud resources and cost with APM metadata in Elastic Observability
Application performance monitoring (APM) is much more than capturing and tracking errors and stack traces. Today’s cloud-based businesses deploy applications across various regions and even cloud providers. So, harnessing the power of metadata provided by the Elastic APM agents becomes more critical. Leveraging the metadata, including crucial information like cloud region, provider, and machine type, allows us to track costs across the application stack.
Performance Testing: Types, Tools & Best Practices
Cloud Analytics 101: Uses, Benefits and Platforms
From Disruptions to Resilience: The Role of Splunk Observability in Business Continuity
Configure Google Cloud Destination
Managing your applications on Amazon ECS EC2-based clusters with Elastic Observability
In previous blogs, we explored how Elastic Observability can help you monitor various AWS services and analyze them effectively: One of the more heavily used AWS container services is Amazon ECS (Elastic Container Service). While there is a trend toward using Fargate to simplify the setup and management of ECS clusters, many users still prefer using Amazon ECS with EC2 instances.
What Does Real Time Mean?
Cindy works long hours managing a SecOps team at UltraCorp, Inc. Her team’s days are spent triaging alerts, managing incidents, and protecting the company from cyberattacks. The workload is immense, and her team relies on a popular SOAR platform to automate incident response including executing case management workflows that populate cases with relevant event data and enrichment with IOCs from their TIP, as well execute a playbook to block the source of the threat at the endpoint.
Configure Cribl Search to Explore and Catalog Petabytes of Data
If you’ve ever found yourself pondering the hidden treasures tucked away within thousands of files in Amazon S3, this is the perfect guide for you. In this blog post, we’re going to look at how you can use the Cribl Search fields feature to catalog and explore the fields in petabytes of data stored in Object Stores. In the Fields Tab within Cribl Search, all returned fields are categorized according to five different dimensions.
How to manually instrument iOS Applications with OpenTelemetry
The Evolution of the Service Model In the Data Industry
Logs Management & Correlating Logs with Traces in SigNoz
The Top 15 Application Performance Metrics
Monitoring the key metrics of your application’s performance are essential to keep your software applications running smoothly as one of the key elements underpinning application performance monitoring. In this article, we will cover many of the key metrics that you should strongly consider monitoring to ensure that your next software engineering project remains fully performant.
Enhancements To Ingest Actions Improve Usability and Expand Searchability Wherever Your Data Lives
10 Best Dynatrace Alternatives [2023 Comparison]
Dynatrace has established itself as a prominent player in the field of application performance management, but given that Dynatrace is an expensive solution aimed at large enterprises, exploring your options is essential. This comprehensive article presents a handpicked selection of the top 10 Dynatrace alternatives, each offering distinct advantages and capabilities.
Create PromQL alerts in Cloud Monitoring now in Public Preview
You can now create globally scoped alerting policies based on PromQL queries alongside yourtheir Cloud Monitoring metrics and dashboards.
Follow Splunk Down a Guided Path to Resilience
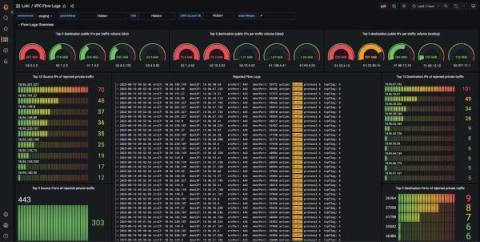
How Qonto used Grafana Loki to build its network observability platform
Christophe is a self-taught engineer from France who specializes in site reliability engineering. He spends most of his time building systems with open-source technologies. In his free time, Christophe enjoys traveling and discovering new cultures, but he would also settle for a good book by the pool with a lemon sorbet.
Splashing into Data Lakes: The Reservoir of Observability
Sumo Logic Customer Brown Bag - Logging - Data Tiers - August 9, 2023
Managing Kubernetes Log Data at Scale | Civo Navigate NA 2023
The Pleasure of Finding Things Out: Federated Search Across All Major Cloud Providers and Native Support for Amazon Security Lake
The newly released Cribl Search 4.2 brings enhancements that ease data management in today’s complex, cloud-centric environments. This update provides comprehensive compatibility with all major cloud providers – Amazon S3, Google Cloud Storage, and Azure Blob Storage. It also ushers in native support for Amazon Security Lake. In this blog post, we’ll examine how new dataset providers enhance the value that Cribl Search delivers, out of the box.
Understanding Linux Logs: Overview with Examples
Logging and program output are woven into the entire Linux system fabric. In Linux land, logs serve as a vital source of information about security incidents, application activities, and system events. Effectively managing your logs is crucial for troubleshooting and ensuring compliance. This article explores the importance of logging and the main types of logs before covering some helpful command line tools and other tips to help you manage Linux logs.
Data Retention Policy Guide
How to Monitor the Performance of Mobile-Friendly Websites
Mobile-friendly websites are a must. We are all using mobile devices more and more to access information and perform all kinds of work and tasks – shopping, banking, communication, dating, etc. Needless to say, if you operate a website, you more likely want to ensure people accessing it using mobile devices – tablets, smartphones, etc. – have a great experience.
Is Moore's Law True in 2023?
Leveraging Cribl as an Integral Part of Your M&A Strategy
One of the most exciting things about bringing products to market at Cribl is seeing customers continually find new ways to leverage them to help solve their data challenges. I recently spoke to a customer who described Cribl as the foundation of their data management strategy and a key part of their post-acquisition data engineering process. Let’s take a deeper look into how Cribl can help.
Improved cost visibility and 60 percent price drop for Managed Service for Prometheus
We’ve dropped pricing for samples ingested into Managed Service for Prometheus by 60%, and improved our metrics management interface.
Mainframe Observability with Elastic and Kyndryl
As we navigate our fast-paced digital era, organizations across various industries are in constant pursuit of strategies for efficient monitoring, performance tuning, and continuous improvement of their services. Elastic® and Kyndryl have come together to offer a solution for Mainframe Observability, engineered with an emphasis on organizations that are heavily reliant on mainframes, including the financial services industry (FSI), healthcare, retail, and manufacturing sectors.
Cribl Makes Waves at Black Hat USA 2023, Unveils Strategic Partnership with Exabeam to Accelerate Technology Adoption for Customers
One of our core values at Cribl is Customers First, Always. These aren’t just buzzwords we use to sound customer friendly; it’s ingrained in our daily communication and workload. Without our customers, we wouldn’t exist. One of the ways we’ve upheld this value is to seek out strategic partnerships with other companies aligned with our customers’ needs – both present and future.
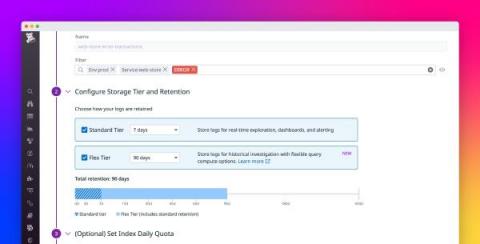
DataDog Flex Logs vs Coralogix Remote Query
While Coralogix Remote Query is a solution to constant reingestion of logs, there are few other options today that also offer customers the ability to query unindexed log data. For instance, DataDog has recently introduced Flex Logs to enable their customers to store logs in a lower cost storage tier. Let’s go over the differences between Coralogix Remote Query vs Flex Logs and see how DataDog compares. Get a strong full-stack observability platform to scale your organization now.
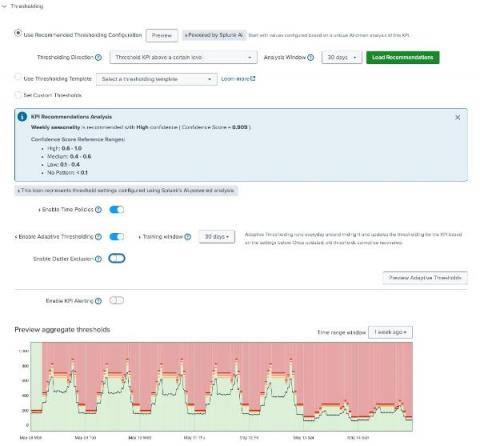
ML-Powered Assistance for Adaptive Thresholding in ITSI
IT Event Correlation: Software, Techniques and Benefits
Custom Java Instrumentation with OpenTelemetry
Elasticsearch Vs OpenSearch | Comparing Elastic and AWS Search Engines
Common API Vulnerabilities and How to Secure Them
Modeling and Unifying DevOps Data
13 Best Cloud Cost Management Tools in 2023
Businesses are increasingly turning to cloud computing to drive innovation, scalability, and cost efficiencies. For many, managing cloud costs becomes a complex and daunting task, especially as organizations scale their cloud infrastructure and workloads. In turn, cloud cost management tools can help teams gain better visibility, control, and cost optimization of their cloud spending. These tools not only provide comprehensive solutions to track and analyze, they also optimize cloud expenses.
IDC Market Perspective published on the Elastic AI Assistant
IDC published a Market Perspective report discussing implementations to leverage Generative AI. The report calls out the Elastic AI Assistant, its value, and the functionality it provides. Of the various AI Assistants launched across the industry, many of them have not been made available to the broader practitioner ecosystem and therefore have not been tested. With Elastic AI Assistant, we’ve scaled out of that trend to provide working capabilities now.
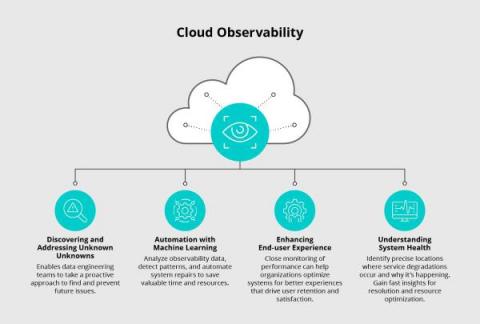
Cloud Observability: Unlocking Performance, Cost, and Security in Your Environment
A robust observability strategy forms the backbone of a successful cloud environment. By understanding cloud observability and its benefits, businesses gain the ability to closely monitor and comprehend the health and performance of various systems, applications, and services in use. This becomes particularly critical in the context of cloud computing. The resources and services are hosted in the cloud and accessed through different tools and interfaces.
4 Node.js Logging libraries which make sophisticated logging simpler
How Cribl Drives Your Business Strategy Forward | Cribl Overview Video
Coralogix Deep Dive - Alerts on the Coralogix Platform
Traces vs Spans
In the context of application performance monitoring (APM) and observability, traces and spans are fundamental concepts that help users to track and understand the flow of requests and operations within a system. They are essential in assisting users to identify bottlenecks, troubleshoot issues, and optimize application performance.
The Quixotic Expedition Into the Vastness of Edge Logs, Part 2: How to Use Cribl Search for Intrusion Detection
For today’s IT and security professionals, threats come in many forms – from external actors attempting to breach your network defenses, to internal threats like rogue employees or insecure configurations. These threats, if left undetected, can lead to serious consequences such as data loss, system downtime, and reputational damage. However, detecting these threats can be challenging, due to the sheer volume and complexity of data generated by today’s IT systems.
Integrating BindPlane Into Your Splunk Environment Part 2
Don't Drown in Your Data - Why you don't need a Data Lake
As a leader in Security Analytics, we at Elastic are often asked for our recommendations for architectures for long-term data analysis. And more often than not, the concept of Limitless Data is a novel idea. Other security analytics vendors, struggling to support long-term data retention and analysis, are perpetuating a myth that organizations have no option but to deploy a slow and unwieldy data lake (or swamp) to store data for long periods of time. Let’s bust this myth.
How to Manually Instrument .NET Applications with OpenTelemetry
Coralogix HATES Vendor Lock In
Structured logging best practices
How to Get Started with a Security Data Lake
Introducing Personalized Service Health: Upleveling incident response communications
Personalized Service Health sends custom granular alerts about Google Cloud service disruptions, and integrates with incident management tooling.
Dark Data: Discovery, Uses, and Benefits of Hidden Data
Data Lakes Explored: Benefits, Challenges, and Best Practices
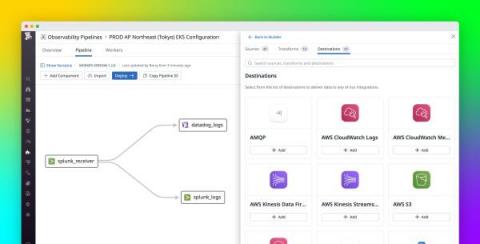
Send your logs to multiple destinations with Datadog's managed Log Pipelines and Observability Pipelines
As your infrastructure and applications scale, so does the volume of your observability data. Managing a growing suite of tooling while balancing the need to mitigate costs, avoid vendor lock-in, and maintain data quality across an organization is becoming increasingly complex. With a variety of installed agents, log forwarders, and storage tools, the mechanisms you use to collect, transform, and route data should be able to evolve and adjust to your growth and meet the unique needs of your team.
Store and analyze high-volume logs efficiently with Flex Logs
The volume of logs that organizations collect from all over their systems is growing exponentially. Sources range from distributed infrastructure to data pipelines and APIs, and different types of logs demand different treatment. As a result, logs have become increasingly difficult to manage. Organizations must reconcile conflicting needs for long-term retention, rapid access, and cost-effective storage.
Leveraging Git for Cribl Stream Config: A Backup and Tracking Solution
Having your Cribl Stream instance connected to a remote git repo is a great way to have a backup of the cribl config. It also allows for easy tracking and viewing of all Cribl Stream config changes for improved accountability and auditing. Our Goal: Get Cribl configured with a remote Git repo and also configured with git signed commits. Git signed commits are a way of using cryptography to digitally add a signature to git commits.
BindPlane Agent Resiliency
Automatic log level detection reduces your cognitive load to identify anomalies at 3 am
How to Tackle Spiraling Observability Costs
As today’s businesses increasingly rely on their digital services to drive revenue, the tolerance for software bugs, slow web experiences, crashed apps, and other digital service interruptions is next to zero. Developers and engineers bear the immense burden of quickly resolving production issues before they impact customer experience.
Crafting Prompt Sandwiches for Generative AI
Large Language Models (LLMs) can give notoriously inconsistent responses when asked the same question multiple times. For example, if you ask for help writing an Elasticsearch query, sometimes the generated query may be wrapped by an API call, even though we didn’t ask for it. This sometimes subtle, other times dramatic variability adds complexity when integrating generative AI into analyst workflows that expect specifically-formatted responses, like queries.
Dive Deeper into your Trace and Logs Data with Query Builder - Community Call Aug 1
Pipeline Efficiency: Best Practices for Optimizing your Data Pipeline
The Uphill Battle of Consolidating Security Platforms
A recently conducted survey of 51 CISOs and other security leaders a series of questions about the current demand for cybersecurity solutions, spending intentions, security posture strategies, tool preferences, and vendor consolidation expectations. While the report highlights the trends around platform consolidation over the short run, 82% of respondents stated they expect to increase the number of vendors in the next 2-3 years.
Announcing Easy Connect - The Fastest Path to Full Observability
Logz.io is excited to announce Easy Connect, which will enable our customers to go from zero to full observability in minutes. By automating service discovery and application instrumentation, Easy Connect provides nearly instant visibility into any component in your Kubernetes-based environment – from your infrastructure to your applications. Since applications have been monitored, collecting logs, metrics, and traces have often been siloed and complex.
Enable and use GKE Control plane logs
Why we generate & collect logs: About the usability & cost of modern logging systems
Logs and log management have been around far longer than monitoring and it is easy to forget just how useful and essential they can be for modern observability. Most of you will know us for VictoriaMetrics, our open source time series database and monitoring solution. Metrics are our “thing”; but as engineers, we’ve had our fair share of frustrations in the past caused by modern logging systems that tend to create further complexity, rather than removing it.


