Operations | Monitoring | ITSM | DevOps | Cloud
September 2021
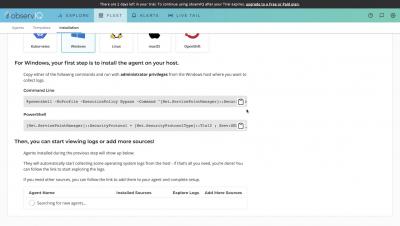
Why Windows service monitoring is vital for optimal network performance
A network service is an application running at the network application layer and above that provides data storage, manipulation, presentation, or communication. It is often implemented using client-server or peer-to-peer architecture based on application-layer network protocols. Windows services are critical processes that support vital server functionality. Sometimes these services fail to start or they stop working.
Rollbar Pro Tips: Telemetry
ScienceLogic Acquires Restorepoint, Expanding Portfolio Into NetOps & SecOps Domains
Hi, my name is Erik Rudin, and I have the privilege of leading our technical alliances and ecosystem team here at ScienceLogic. We are excited to announce that ScienceLogic has acquired the network configuration and change management vendor Restorepoint. With this acquisition, we’re expanding our IT operations business into the Network Operations (NetOps) and Security Operations (SecOps) domains.
AppDynamics vs. Datadog vs. Scout APM
Currently, the world generates an unprecedented amount of data. Research shows that the world generated more data in the last two years than the amount of data produced in the history of the human race. The most critical part of this entails analyzing the generated data and observing trends. It's at this point where tools like Scout APM, Datadog, and AppDynamics become crucial. Working with an unprecedented amount of data means tackling millions/thousands of distinct data points.
ADS 11.4 - Built with Your Feedback
The new release of Kemp Flowmon ADS 11.4 brings you the most frequently requested features.
Optimizing Microsoft Teams Voice When Returning to the Office Only Complicates Things
Learn more about Microsoft Teams Monitoring: https://martellotech.com/solutions/microsoft-teams-monitoring/
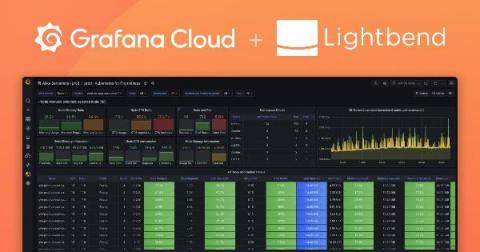
How Lightbend uses Grafana Cloud to monitor a platform-as-a-service launch
When top companies have needed platforms for their demanding, globally distributed, cloud native application environments and streaming data pipelines, they’ve turned to Akka, the most popular implementation of the Actor Model for cloud native applications running on Kubernetes. The company behind Akka is Lightbend, a leader in the world of cloud native applications and architectures.
We are growing ... and hiring. Come join us!
We are GripMatix and believe in no-nonsense tooling to help organizations leveraging the quality of their IT infrastructure and applications and ensure Business Continuity. We think that quality tooling does not need too much explanation. What you see is what you get. We provide CITRIX® Ready Monitoring and because we have a lot of experience in IT consulting for many years ourselves, we provide value by offering tooling made by the experts, for the experts.
Q3 Roundup - What's New With Logs? Let's Log About It!
How to Troubleshoot Clinician Issues with George Spiers
Remediation of Incidents Detected by LogicMonitor
Evolve hybrid cloud security to meet COVID-19 challenges
Remote work poses new demands for hybrid cloud security. Here’s how organizations can protect themselves from security threats in this complex landscape.With employees continuing to work from home to meet the social distancing requirements of COVID-19, more people are juggling business with personal engagements, at times outside normal business hours. Often, they’re using their mobile business laptop, as well as a plethora of additional wireless mobile devices.
Salesforce Application Performance Monitoring
Can you imagine trying to keep track of all your prospect- and customer-related activities on a spreadsheet? What about ye olde days of rolodexes (do people still remember what those are?!)? Thank goodness for Salesforce, the Customer Relationship Management (CRM) solution that revolutionized sales, marketing, and customer care - and how we interact with customers in general. Salesforce is a critical component for many businesses.
Planning Ahead to Maximize the Value of Attending VMworld
The difference between attending as magnificent an event as VMworld with, versus without, a plan of attack is a night versus day experience. I’ve had the good fortune of attending this event as both a speaker and an attendee, and I look back with fondness on the interactions and experience. However, both those visits were in person. As I prepared to attend VMworld virtually for the first time, I wondered if my plan of attack would change? Turned out, not so much.
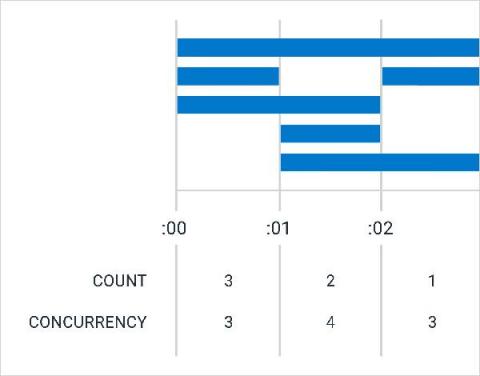
Understanding Lambda Sleep Cycles With CONCURRENCY
It started with a simple question: Why did one query take 10 seconds, while another almost identical query took 5? At Honeycomb, we use AWS Lambda to accelerate our query processing. It mostly works well, but it can be hard to understand and led us to wonder: What was really going on inside this box called Lambda? These questions kicked off the development of CONCURRENCY, a new aggregate in the Query Builder that lets us look at how many spans are active at once.
Updated: Let's Encrypt's root certificate expiry and what it means
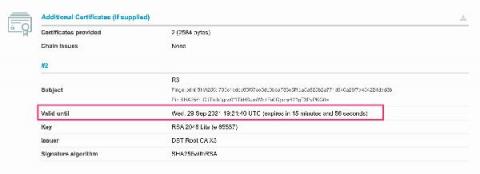
You might have seen the name “Let’s Encrypt” across the internet for the past week and it’s because their root certificate expires on 30th September. It’s been planned for a good long while, with Let’s Encrypt providing users with updates on the expiry and new certificate since 2020.
The Complete Guide to Server Monitoring
IT structures form the backbone of many companies in today's world. Servers allow connected devices to share information within a network by analyzing, processing, and recording information. They store all the company's data and enable users to access their information from any computer connected to the network. It is essential to use server monitoring tools that ensure the servers keep running effectively and smoothly to prevent crashes and keep data safe.
Announcing Support for AWS Lambda Functions running on AWS Graviton2 processors
AWS Graviton2 processors use the Arm architecture to provide high-efficiency, low-cost computing. AWS already offers the ability to provision EC2 instances powered by Graviton2, and Datadog is proud to partner with them for the launch of new Graviton2 compute resources for Lambda functions. In this post, we’ll discuss how Datadog can provide deep visibility into your Lambda functions across whichever platform you’re using.
What is OpenTelemetry: A guide to understanding OpenTelemetry and the way forward
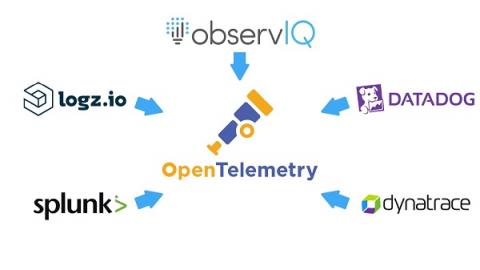
OpenTelemetry is a vendor-neutral approach that enables DevOps and developers to collect performance metrics in a standardized manner. Currently a Cloud Native Computing Foundation (CNCF) sandbox project, OpenTelemetry was conceived by merging OpenCensus, Google's open-source method of collecting metrics and traces, and OpenTracing, a vendor-neutral API to collect traces.
Log Observability and Log Analytics
Logs play a key role in understanding your system’s performance and health. Good logging practice is also vital to power an observability platform across your system. Monitoring, in general, involves the collection and analysis of logs and other system metrics. Log analysis involves deriving insights from logs, which then feeds into observability. Observability, as we’ve said before, is really the gold standard for knowing everything about your system.
Request Metrics Released! What We Got Right.
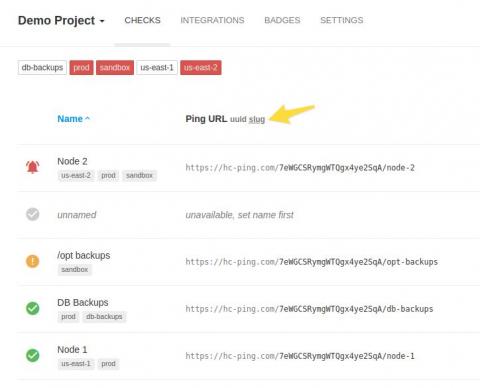
New Feature: Slug URLs
Healthchecks.io pinging API has always been based on UUIDs. Each Check in the system has its own unique and immutable UUID. To signal a start, a failure, or a particular exit status, clients can add more bits after the UUID: This is conceptually simple and has worked quite well. It requires no additional authentication. The UUID value is the authentication, and the UUID “address space” is so vast nobody is going to find valid ping URLs by random guessing any time soon.
Using the Resource Timeline in Request Metrics
Let's Encrypt DST Root CA X3 certificate set to expire
If you've been using Let's Encrypt for a while, you may have noticed that their certificates are signed by a root certificate titled DST Root CA X3. That root certificate is set to expire in a few hours. Any certificates still signed by that root will no longer be valid. But luckily, that shouldn't form a problem for most Let's Encrypt users. For a while now, new SSL issuances by Let's Encrypt have issued certificates against DST Root CA X3 (the one that is about to expire) and ISRG Root X1.
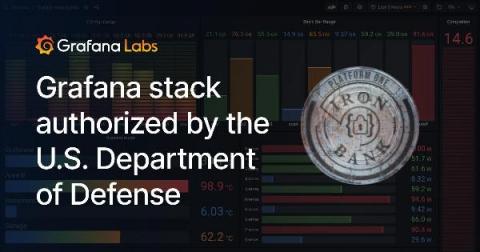
The U.S. Department of Defense formally authorizes Grafana, Grafana Enterprise, and Loki for its 100,000 developers
Not so long ago, development teams working for the U.S. Department of Defense could take anywhere from three to ten years to deliver software. “It was mostly teams using waterfall, no minimum viable product, no incremental delivery, and no feedback loop from end users,” Nicolas M. Chaillan, Chief Software Officer of the U.S. Air Force, said in a CNCF case study. “Particularly when it comes to AI, machine learning, and cybersecurity, everyone realized we have to move faster.”
What Is Distributed Tracing?
Put your data to work with Elastic on Google Cloud [Official Partnership]
Learn How To Handle AWS Lambda Timeouts
Getting to know Kibana
Next Generation AWS Lambda Functions Powered by AWS Graviton2 Processors
Modern computing has come a long way in the last couple of years and the introduction of new technologies is only accelerating the rate of advancements. From the immense compute power at our disposal to lightning-fast networks and ready-made services, the opportunities are limitless. In such a fast-paced world, we can’t ignore economics.
Then and Now: Distributed Systems Alerting and Monitoring
Distributed systems are everywhere. Although many teams don’t think of their applications as distributed systems, if they’re developing using container-based microservices and serverless functions instead of a monolith, they’re creating a distributed system. This change also means that monitoring needs are becoming more complex.
A glimpse into our crystal ball: What does the future hold for observability?
What will the future of observability look like? Four core capabilities will be foundational to the next generation of solutions.
SQL Server Storage Best Practices: Choosing Storage Options
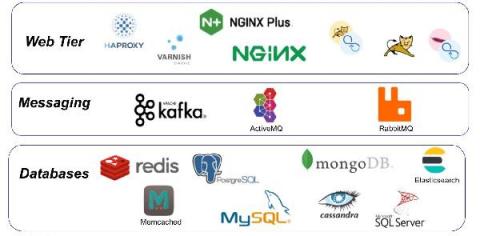
How to monitor a web server running NGINX|httpd
Web servers are software services that store resources for a website and then makes them available over the World Wide Web. These stored resources can be text, images, video and application data. Computers that are interfaced with the server mostly web browsers (clients), request these resources and presents to the user. This basic interaction determines every connection between your computer and the websites you visit.
Graviton-Based Lambda Functions, What It Means For You
AWS just announced support for AWS Lambda functions powered by AWS Graviton2 processors. These are 64-bit Arm-based processors that are custom built by AWS and offer a better price to performance ratio. In this post, let me take through what we have learnt about this new option and what it means for you.
Top 3 Tools to Monitor Python in AWS Lambda
Comparison of top observability and debugging tools to help you monitor Python in AWS Lambda.
Troubleshooting Outages at 3 AM with Alert Response
Sumo Logic Extends Monitoring for AWS Lambda Functions Powered by AWS Graviton2 Processors
Introducing Sensu Plus: An Integrated Analytics Solution for All Sensu Users
As part of its recent acquisition of Sensu, Sensu Go is now part of the Sumo Logic Continuous Intelligence Platform, empowering enterprises and developers to quickly get real-time insights from unstructured data for troubleshooting, performance improvement, and security across dynamic multi-cloud infrastructure.
Taming Hybrid Cloud Complexity: One Platform for Monitoring Your IT Universe
Making Hybrid Infrastructure Monitoring Work For You
What's new in Sysdig - September 2021
Welcome to another monthly update on what’s new from Sysdig! Happy Janmashtami! Shanah Tovah! 中秋快乐! With lockdown lifting by varying degrees across the world, we hope you had a safe but pleasant holiday! It has certainly been long overdue. Here at Sysdig, we celebrated Labor Day in the USA with an extended weekend and a well being day for the team.
Automate, Group, and Get Alerted: A Best Practices Guide to Monitoring your Code - Part 1
As companies grow, so do their products, teams, and the number of external tools. For engineers, that can mean code sprawl, data silos, notification fatigue, and some “what the…?” moments along the way as they try to make sense of it all.
How Splunk IT Service Intelligence Assures Business Service Performance for Financial Institutions
Troubleshooting the Internet: If You Can't Have Authority, Visibility Will Do
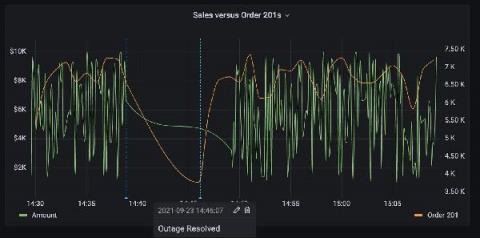
With the Salesforce plugin for Grafana, easily visualize your SFDC data and correlate it with other data sources
Good news for Salesforce users: With the new Salesforce plugin for Grafana, available now with an Enterprise license, you can instantly visualize your SFDC data in Grafana dashboards. Plus, Grafana allows you to visualize the Salesforce data alongside all sorts of other data. One interesting use case is correlating sales data to system metrics and logs, which would be valuable if your company uses any software systems at all to help generate revenue.
An Inside Look at the Exoprise Sales Team with Mark Yohai, VP Sales & Business Development
Exoprise CxO Briefing with Jason Lieblich, Founder and President
Rollbar Tip of the Day: Auto-Resolve
Career and Networking Evolution with BGPMon's Founder Andree Toonk | Network AF Podcast Ep. 1
Backbone Engineering and Interconnection with Nina Bargisen | Network AF Podcast Ep. 2
Listen up: The Network AF podcast is here
Hear here! Today we’re very excited to share that our Co-founder and CEO Avi Freedman launched a new podcast, Network AF. If you like nerding out on all-things networking, cloud and the internet, this podcast is for you. If you like networking how-tos, best practices and biggest mistakes, this podcast is for you. If you want to up your poker game, well… this podcast might also be for you.
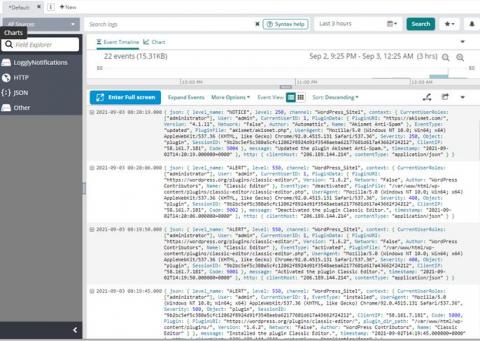
Boss-Level Log Management for WordPress Site Administrators
What Is Data Observability and Why Do You Need It?
The word observability has its root in control theory. R.E. Kálmán in 1960 defined it as a measure of how well you can infer the internal states of a system from knowledge of its external outputs. Observability is such a powerful concept because it allows you to understand the internal state of a system without the complexity of the inner workings. In other words, you can figure out what’s going on just by looking at the output.
What Exactly is a Website Monitoring "False Alarm" and Why You Should Care About It
What Exactly is a Website Monitoring “False Alarm” and Why You Should Care About It You know what falsehoods are. You know what false teeth are. You may even know some falsehoods about false teeth. But do you know what a website monitoring false alarm (also known as a “false positive”) is? If not, then please keep reading to find out — because it’s a very big deal.
Logit.io Announces The Beta Launch Of Hosted Grafana
We are pleased to announce the beta launch of hosted Grafana in addition to our existing ELK as a Service & hosted Open Distro services. As organisations around the world are constantly looking for ways that they can ensure compliance is being upheld, speeding up Mean Time To Repair (MTTR) and reducing the risk of DDoS attacks, managed Grafana forms a vital role in improving metrics observability across the entirety of your infrastructure.
The Cost of Going Before You Know
Like many things in life, when you’re new to the cloud you don’t know what you don’t know. Given that migrating workloads to the public cloud is often a key component of a business transformation initiative, you want to avoid a long, expensive learning curve—especially since accelerating time-to-value is often a major impetus for the move.
Avoid This SLA Fail - Q&A w/ Neil Keating (Chief Experience Officer, Bright Horse)
Recently I got the chance to speak with Neil Keating, Co-Founder and Chief Experience Officer at Bright Horse, a full-service IT experience consulting and training company. Neil’s candor and deep knowledge about IT Operations and digital experience was obvious from the start. Find a brief clip of our conversation here and several helpful nuggets for IT leaders in the text below!
Apache Kafka Tutorial: Use Cases and Challenges of Logging at Scale
Enterprises often have several servers, firewalls, databases, mobile devices, API endpoints, and other infrastructure that powers their IT. Because of this, organizations must provide resources to manage logged events across the environment. Logging is a factor in detecting and blocking cyber-attacks, and organizations use log data for auditing during an investigation after an incident. Brokers, such as Apache Kafka, will ingest logging data in real-time, process, store, and route data.
Building observability for the future
What are AWS Log Insights and How You Can Use Them
Within this blog post, we’re going to take a look at AWS Log Insights and cover some of the topics that you will find useful around what it is, how to use it, and how it can link in with our various solutions.
Introducing Pre-Installed Logz.io Metrics Dashboard Bundles
We are proud to announce the launch of direct dashboard uploads with Logz.io. These new metrics dashboard templates are available for 25 different tools and more to come. Each of these templates is now available to Logz.io customers and covers the gamut of popular monitoring tools used by DevOps teams. Some of these tools also include multiple options. The process is simple. Head into the Logz.io app and head to your metrics account.
BGP Features in 2min
SigNoz community call - September 2021
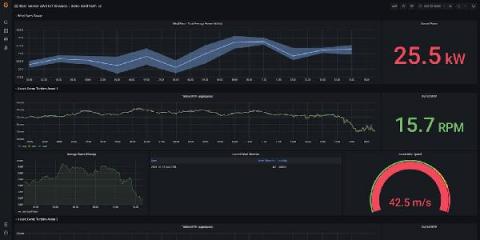
How to visualize real-time data from an IoT smart home weather station with Grafana dashboards
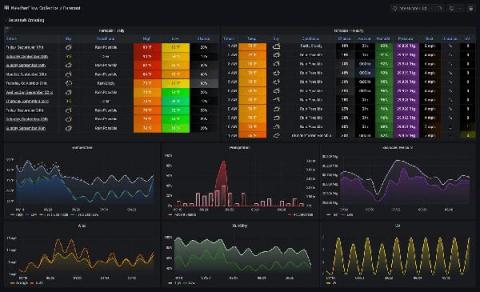
One of the experiences I’ve truly enjoyed over my first year as a senior solutions engineer here at Grafana Labs has been learning from our community and customers about their own Grafana journeys. I’ve been impressed by some remarkable dashboards for home automation, personal health data visualizations, family Minecraft statistics, and energy usage projects.
We Will All Be Remembered Forever - And There's Nothing You Can Do About It
I want to be remembered. I think a lot of us do. At least, that’s what I used to think. Now I am not so sure. I have a bad habit of looking at the universe through an existential lens where value is measured by impact. Impact, meaning the measurable change created by specific action. Since everything physical ultimately decays, the longest lasting impacts are those that linger in our collective memory. Great works, great triumphs, great discoveries, and great inventions – great impacts.
Micro Lesson: Setting up an Outlier-based Monitor
Microlesson: Using Alert Response
Micro Lesson: Cross Tier Search
Micro Lesson: Span Analytics
Micro Lesson: Introduction to Observability Solution
This Month in Datadog: September 2021 (Episode 5)
Getting Started with Citrix Remote Monitoring and Management Services
Micro Lesson: Real User Monitoring (RUM)
Advertising's Performance Tradeoffs
Is Application Sprawl in Government Really a Big Problem?
Headless WordPress With Real-Time Logging by Papertrail
Ingest data directly from Google Pub/Sub into Elastic using Google Dataflow
Today we’re excited to announce the latest development in our ongoing partnership with Google Cloud. Now developers, site reliability engineers (SREs), and security analysts can ingest data from Google Pub/Sub to the Elastic Stack with just a few clicks in the Google Cloud Console. By leveraging Google Dataflow templates, Elastic makes it easy to stream events and logs from Google Cloud services like Google Cloud Audit, VPC Flow, or firewall into the Elastic Stack.
Extending Observability to App Infrastructure
TL;DR InfluxDB Tech Tips: Multiple Aggregations with yield() in Flux
The yield() function determines which table inputs should be returned in a Flux script. The yield() function also assigns a name to the output of a Flux query. The name is stored in the default annotation. For example, if we query the following table: Without the yield function: The following Annotated CSV output is returned. Notice the default annotation is set to _results by default. Now if we add the yield() function: The following Annotated CSV output is returned.
5 priorities for CISOs to regain much needed balance in 2022
Here’s what security leaders need to do in the face of rising stress levels and cyberattacks Nearly 9 out of 10 CISOs say their existing systems secured their enterprise through a shift to remote work, an ongoing labor shortage, and a huge spike in cybersecurity attacks. But that success came with a price: 64% say they’re more stressed out than they were a year ago. How can CISOs navigate a new set of challenges in 2022, while also regaining some much needed balance?
Leveling up your IT management game: 4 best practices for IT infrastructure management
IT infrastructures are constantly evolving, meaning conventional management processes have become outdated and inadequate to tackle complex IT issues. A study by ESG found that 75% of IT decision-makers admit that complexity of IT infrastructures has increased drastically from two years ago. This rapid surge in complexity has disrupted admins’ understanding of network behavior and decreased the chances of foreseeing unanticipated network issues.
News Roundup September 24, 2021
On this day in 1979, CompuServe (CIS) offered one of the first dial-up online services to the masses. It was the dominant internet service provider through the 1990s. By 1981, it had 10,000 subscribers. Within a decade, that number was in the millions. Speaking of how technology makes life easier, here’s the latest news in AIOps, ITOps, and IT infrastructure monitoring.
Our Outbound Sales Autopsy
How to Monitor Multiple Websites With Uptime.com
Monitoring a website can already mean hundreds of checks on all sorts of different pathways, URLs, and other services. Monitoring multiple websites is an ever growing web that can make you start to feel like you’re trapped in an episode of Law & Order. The format of the show (I am talking about the real Law & Order, not its offshoots) involves the crime from occurrence to trial outcome and every beat and interrogation in between.
Introducing Honeybadger for Crystal
Good news, Crystal developers! We just shipped an official Crystal shard for Honeybadger. Track errors and keep your users happy.
How to monitor Redis with Prometheus
Redis is a simple – but very well optimized – key-value open source database that is widely used in cloud-native applications. In this article, you will learn how to monitor Redis with Prometheus, and the most important metrics you should be looking at. Despite its simplicity, Redis has become a key component of many Kubernetes and cloud applications. As a result, performance issues or problems with its resources can cause other components of the application to fail.
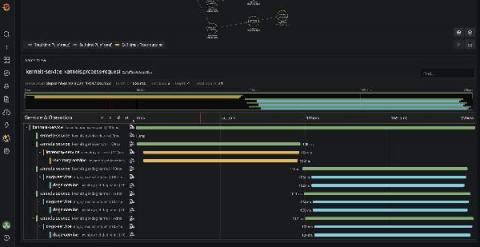
Intro to distributed tracing with Tempo, OpenTelemetry, and Grafana Cloud
I’ve spent most of my career working with tech in various forms, and for the last ten years or so, I’ve focused a lot on building, maintaining, and operating robust, reliable systems. This has led me to put a lot of time into researching, evaluating, and implementing different solutions for automatic failure detection, monitoring, and more recently, observability. Before we get started: What is observability?
Getting Started with Citrix Remote Monitoring and Management Services
Tour of the Graylog Community
NodeJS Application Manual Instrumentation for Distributed Traces
30 Second Windows VM Log Monitoring | observIQ
Circonus' Zero-Gravity Data Eliminates Challenges and Limitations Associated with Massive Data Sets
Telemetry data – the metrics and measurement data emitted by all machines and devices from servers to robots – is exploding. Telemetry data generation is growing so fast, there are no reliable estimates of just what that growth rate looks like. Theo Schlossnagle, founder of Circonus and widely respected computer scientist, estimates that telemetry data is growing at the rate of 1×10¹² every ten years. Suffice to say, that’s a lot.
How to Achieve 80% Automation for Ticketing and Routing
Customer expectations and competitive responses to trends evolve faster than the technology your enterprise relies on. That means your ability to adapt faster than the competition and satisfy customer demands is your edge in a competitive marketplace.
Understanding Traces, Transactions, and Spans
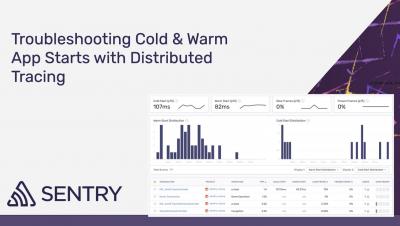
Troubleshooting Cold and Warm App Starts
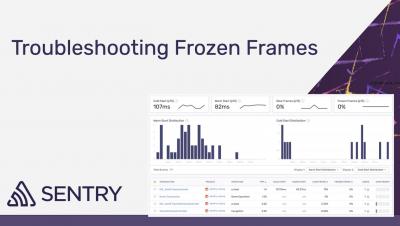
Troubleshooting Slow Frames
What are Mobile Vitals?
Common Ways to Monitor Mobile Applications
Auto-instrumenting Transactions & Troubleshooting a Frozen Frame
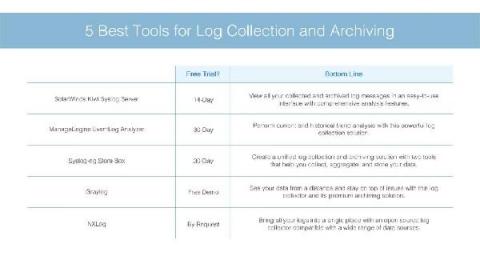
5 Best Tools for Log Collection and Archiving With Guide
Catchpoint Digital Experience Score Is An Industry-First
Catchpoint recently announced the Digital Experience Score. This score is the first all-encompassing metric to represent all essential drivers of digital end-user experience. With pressure on IT teams ever growing to fix the IT issues of a remote workforce, we wanted to make troubleshooting as straightforward as possible. The score provides IT teams tasked with improving employee experience with a quantifiable measurement of what each employee is experiencing digitally.
Observability: The 5-Year Retrospective
Two years ago, I wrote a long retrospective of observability for its third anniversary. It includes a history of instrumentation and telemetry, a detailed explanation of the technical spec, and why the whole “three pillars” thing is nonsense. At the time, it’s what was needed to steer conversations away from silly rabbit holes about data types and back to what matters: how we understand our systems.
How the French Ministry of Agriculture deploys Elastic to monitor the commercial fishing industry
Within the French Ministry of Agriculture and Food (the Ministry), our team of architects in the Methods, Support and Quality office (BMSQ) evaluate and supply software solutions to resolve issues encountered by project teams that affect various disciplines. As data specialists, one area we’ve been involved in includes reconfiguring the traceability of activities for the commercial fishing industry.
Elastic APM iOS agent technical preview released
We are proud to announce the preview release of the Elastic APM iOS agent! This release is intended to elicit feedback from the community, while providing some initial functionality within the Elastic Observability stack and is not intended for production use. Now is your chance to influence the direction of this new iOS agent and let us know what you think on our discussion forum. If you find an issue, or would like to contribute yourself, visit the GitHub repository.
Streamline Migration and Application Onboarding in DX APM with EasySeries
To realize the full potential of APM, many customers are migrating from their existing APM 10.7 clusters to DX APM. In addition, they continue to onboard new applications for monitoring. These efforts require a series of steps, including the configuration of experience views, universes, and DX Operational Intelligence services.
Grafana vs Kibana: The Updated Guide For 2022
If you have any experience with comparing open source data visualisation tools then it is very likely you will have encountered both Kibana and Grafana during your research and discovery phase. As two of the most popular solutions for logs and metrics analysis, it can be difficult to distinguish between the two and make the choice to use either Grafana or Kibana depending on the analysis task at hand.
Why LogDNA Received the EMA Top 3 Award for Observability Platforms
We’re honored to be included in Enterprise Management Associates’ EMA Top 3 Award for Observability Platforms. This award recognizes software products that help enterprises reach their digital transformation goals by optimizing product quality, time to market, cost, and ability to innovate—all the things we’re passionate about at LogDNA.
3 ways OpUtils' IP address tracker fosters effective IP management
How a network’s IP address space is structured, scanned, and managed differs based on the organization’s size and networking needs. The bigger your network is, the more IPs you need to manage, and the more complex your IP address hierarchy gets. As a result, issues such as IP resource overutilization and address conflicts become challenging to avoid without an IP address management (IPAM) solution in place.
Tutorial: Setting up AWS CloudWatch Alarms
AWS CloudWatch is a service that allows you to monitor and manage deployed applications and resources within your AWS account and region. It contains tools that help you process and use logs from various AWS services to understand, troubleshoot, and optimize deployed services. I’m going to show you how to get an email when your Lambda logs over a certain number of events.
Using Jaeger for your microservices
Telegraf Integrations with Logz.io
Logz.io is proud to announce a slew of new integrations via Telegraf. Logz.io utilizes Prometheus in its product, but aims to support compatibility across common DevOps tools. A number of our customers, and the community in general, are strong users of Telegraf and its companion apps in the TICK Stack (which includes InfluxDB). Telegraf is not as popular as Prometheus, but it’s a strong element in the DevOps toolbox.
Tutorial: Set up an AWS CloudTrail Source
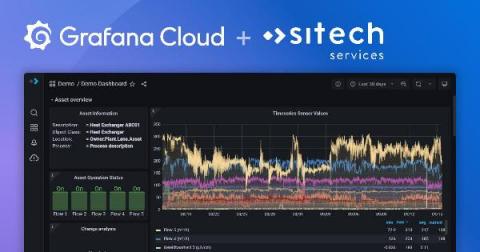
How Sitech builds modern industrial IoT monitoring solutions on Grafana Cloud
Chemelot is an industrial park in the Netherlands with more than 150 companies in chemical and process industries that are working to build the most sustainable and competitive chemical site in Western Europe. Sitech Services is part of making that happen. The Dutch technology firm brings together maintenance and engineering specialists with data scientists to create multidisciplinary solutions that achieve optimal safety, efficient infrastructure, and efficient processes for the plants.
Tracing Issues in Your Application
Logging USB Storage with Graylog
Monitoring compute infrastructure with the Cloud Ops Agent
Inventory modules in Windows | Pandora FMS
Monitoring PostgreSQL With pgmetrics and pgDash
I am currently trialing pgmetrics and pgDash for monitoring PostgreSQL databases. Here are my notes on it. pgmetrics is a command-line tool you point at a PostgreSQL cluster and it spits out statistics and diagnostics in a text or JSON format. It is a standalone binary written in Go, and it is open source. Here is a sample pgmetrics report. Rapidloop, the company that develops pgmetrics, also runs pgDash – a web service that collects reports generated by pgmetrics and displays them in a web UI.
Unexpected Parallels Between Yoga and Observability
Yoga is to ideal human health what observability is to an application’s ideal functioning. It is well established that observability is a critical factor for the successful implementation and maintenance of cloud-native, serverless, cloud-agnostic, and microservices-based applications. Well-established observability helps DevOps and development teams cross the boundaries of complex systems and get complete visibility into their functioning.
AppDynamics announces major updates and improvements to Global Partner Program to support shift to 100% channel model
Exciting key changes to our Global Partner Program will help our partners fully exploit the potential of full-stack observability with business context.
AppDynamics supports AWS Distro for OpenTelemetry (ADOT) general availability for traces 1.0
We're excited to help our customers further leverage the benefits of OpenTelemetry via integration with AWS Distro for OpenTelemetry (ADOT) for traces 1.0.
What is Proactive Monitoring?
In the realm of monitoring products, proactive monitoring usually means identifying potential issues within IT infrastructure and applications before users notice and complain and initiating actions to avoid the issue from becoming user noticeable and business impacting. Proactive monitoring means a business is continuously searching for signs that indicate a problem is about to happen.
What to expect from an Icinga Fundamentals training
Let’s set the scene: You just started out with Icinga, maybe because you have realised your need for monitoring or you have inherited an environment. Maybe your boss just decided that this is what you are going to do now. So you are now sitting in front of the documentation, maybe started an installation process. But there are all of those terms that you don’t know, things are looking complicated and you don’t even know where to get started in your journey. And that’s okay!
UX Research: The Power of Customer Feedback
Gathering data doesn’t just help a business understand what’s working and not working. It also shows the way forward, enabling teams to make the right improvements to benefit both the business and the people they serve. And in many cases, the most powerful data a business can collect comes directly from its customers. Here at Nexthink, the UX Research team talks to customers and partners to learn about their goals and challenges.
A look at the upcoming improvements to LINQ in .NET 6
Gearing up your IT ecosystem for the Apple WWDC21 updates
The September Apple Event is one of the most important events for any IT admin because it is preceded by the Apple Worldwide Developers Conference. It witnesses the release of new hardware like the iPhone and, more importantly for enterprises, the release of the latest versions of it’s operating systems—iOS 15, iPadOS 15, and tvOS 15 were announced. iOS and iPadOS updates rolled out on September 20, while the new macOS will roll out later this year.
OpsRamp Introduces The Future of Incident Response: Harnessing Machine Learning and Data Science to Predict and Prevent IT Outages
ScienceLogic Welcomes Seasoned Enterprise Tech Pro Todd McNabb as Chief Revenue Officer
What is Distributed Network Monitoring for SaaS and SD-WAN
Nowadays, companies are embracing flexibility. Many businesses are embracing remote offices and working from home, storing their data in the Cloud, ditching centralized data infrastructures, and moving towards networks using SaaS and SD-WAN. With distributed architectures becoming the new normal, it’s important to have a distributed monitoring solution that can keep up. In this article, we’re running you through everything you need to know about how distributed network monitoring works.
Monitoring Juniper networks with Grafana
This article will dive into your questions surrounding monitoring Juniper Networks. In addition, you will be able to learn how Grafana can help you to monitor Juniper networks systems. As you read through, you will be able to get the answers for the following questions...
OpsRamp Summer 2021
What Are Atoms in Elixir and How To Monitor Them With AppSignal
In this post, we’ll show you what atoms are in Elixir, why you should monitor them, and how to do so with AppSignal. Let’s prevent your app from crashing with a pop up of an error such as.
Datadog vs. Grafana: Compare Use Cases and Features
The current big data world allows even tiny IT environments to produce massive amounts of information. After determining how to open up various data generation sources, a business analyzes the information. Here, the analysis method you leverage varies depending on the data, the tools/equipment used, and the use case. A good practice is to visualize the traces, weather logs, data, or metrics.
Top 10 Questions About Uptime Monitoring
Monitoring for uptime is becoming increasingly necessary as SaaS and Always-On services integrate deeper with our professional and personal lives. When bottom lines and infrastructure requirements are tied so closely to 24/7 accessibility, making sure your websites are UP becomes priority one. We’ve scoured our support tickets, talked to our users, and kept an ear to the ground to compile the top 10 questions surrounding uptime monitoring and break down the answers.
DBAle 31: Monitoring matters for modern data management
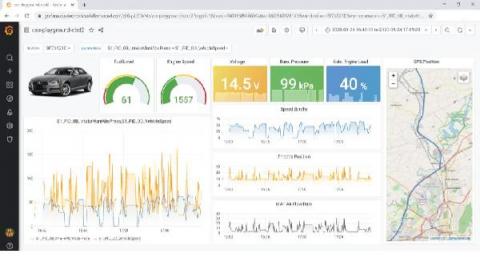
With Grafana and InfluxDB, CSS Electronics visualizes CAN IoT data to monitor vehicles and machinery
Martin Falch, co-owner and head of sales and marketing at CSS Electronics, is an expert on “CAN bus” data. Martin works closely with end users, typically OEM engineers, across diverse industries (automotive, heavy-duty, maritime, industrial). He is passionate about open source software and has been spearheading the integration of the CANedge with InfluxDB databases and Grafana telematics dashboards.
InfluxDB: The time series data platform built for developers
Rollbar Tip of the Day: Item status & Severity level
Supernet: What it is and what it is for?
A set of computers and/or computer equipment connected to each other, and that can exchange data and information, all of those make up a network. The Internet is the network of networks.
Top 6 AWS Lambda Monitoring Tools
Monitoring AWS Lambda performance plays a crucial part in your everyday AWS Lambda usage. Monitoring helps you identify any performance issues, and it can also send you alerts and notify you of anything you might need to know. The world is slowly getting to a point where machines and computers will be flawless, but until then, if we let them perform various tasks for us, we could at least monitor their performance.
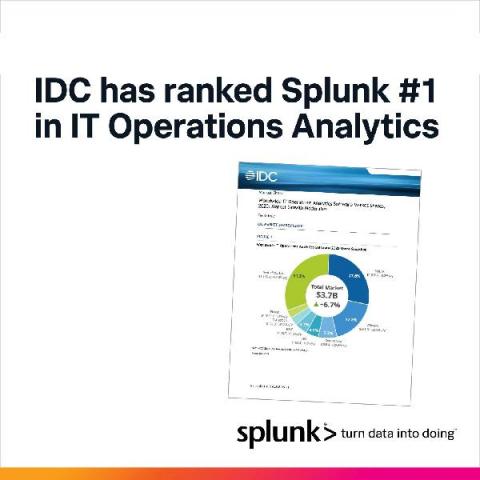
Expanded Customer Adoption Lands Splunk First in 2020 IT Operations Analytics Market Share Report
For the 7th year in a row, IDC has ranked Splunk as #1 in ITOA*. We’re thrilled with this news, but let me start by saying that our success is due to the continued success of our customers, and we’re very grateful for the opportunity to be a part of it. Need a refresher on ITOA? We know we know, another day another acronym. ITOA is IT Operations Analytics. IDC derived this market from portions of their IT Operations management (ITOM) software market.
The Challenge of Monitoring a Distributed Network
The Fine Line Between Confidence and Delusion in the Cloud
In a recent survey of hybrid cloud decision makers, we uncovered a disconcerting trend. The vast majority of respondents reported that they are confident in their existing tools and capabilities for a whole host of activities necessary to manage cloud performance and spend … and yet they don’t have many of the tools that are actually needed to perform those tasks.
Industry 4.0 Defined and Explained
With Industry 4.0 fundamentally transforming manufacturing systems and processes through IIoT technologies, manufacturers large and small are seeking the most efficient ways to reap its benefits. Potential gains include optimizing operations, generating data-driven insight, creating new revenue streams, and accelerating innovation. To paint the big picture, let’s start with a definition of Industry 4.0, followed by an explanation of what adopting it involves.
Getting Started with OpenTelemetry and VMware Tanzu Observability
Modern application architectures are complex, typically consisting of hundreds of distributed microservices implemented in different languages and by different teams. As a developer, SRE, or DevOps engineer, you are responsible for the reliability and performance of these complex systems. But while you might have metrics that will help you debug when there’s an issue, metrics alone can’t help you narrow down and ultimately identify the root cause.
3 Ways to Improve DataPower Performance
Build Vs. Buy Discussion
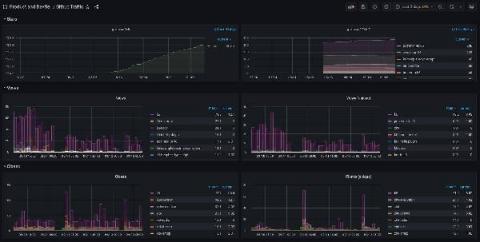
How we use Grafana and Prometheus to monitor the traffic of our many GitHub repositories
If you want to understand the popularity of your GitHub repositories, knowing the number of stars isn’t enough. GitHub understands this, and that’s why the team released traffic insights. Anyone with push access to a repository can view these insights, which include: full clones, visitors from the past 14 days, referring sites, and popular content in the traffic graph.
Splunk Delivers Real-Time Salesforce Visibility with New Streaming API Integration
You might already be using Splunk to manage your Salesforce environment with the help of the Splunk App for Salesforce and the Splunk Add-on for Salesforce that allows a Splunk administrator to collect different types of data from Salesforce using REST APIs. This solution is great and the events give you an idea of how users interact with Salesforce. These events can range from Apex executions to page views.
Comparing gRPC performance across different technologies
gRPC is an open-source Remote Procedure Call system focusing on high performance. There exist several gRPC benchmarks including an official one, yet we still wanted to create our own. Why would we torture ourselves doing such a thing? So with those points in mind, we created a completely open-source benchmark where everyone is welcome to contribute and which could be run with a single command, having only Docker as a prerequisite.
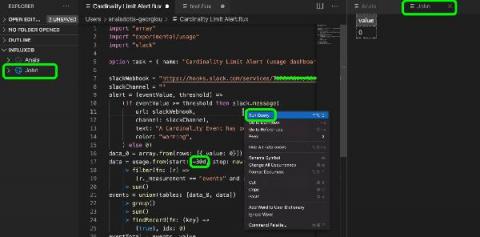
Using the Flux VS Code Extension for IoT Application Development
InfluxData prides itself on its effort to prioritize developer happiness. This included providing developers with a variety of tools to interact with InfluxDB v2 OSS or InfluxDB Cloud, so they can pick the development style that works best for them. This article assumes you’re using the InfluxDB Cloud Free tier, which is the easiest way to get started and maintain InfluxDB. You can use any of the following tools for your IoT application development.
Roman Khavronenko | Open-source strategy at VictoriaMetrics
Grey's Academy 301: Intel (OpenVino)
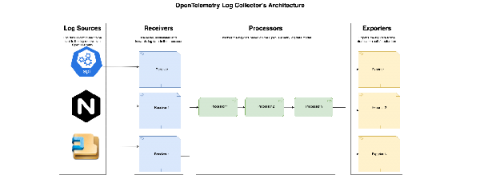
observIQ Cloud and the OpenTelemetry Collector
Our log agent is powerful, efficient, and highly adaptable. Now, with OpenTelemetry setting new standards in the observability space, we wanted to incorporate that collaboration into our log agent and offer our users the ability to take advantage of the OpenTelemetry ecosystem. Starting today, you can upgrade the log agents in your observIQ account to the new Open Telemetry-based observIQ log agent with a single click.
The More You Monitor: What Are the Three Pillars of Observability?
The Confident Commit | ep. 11 Observability and CI/CD: meaningful measurement with Charity Majors
Cribl How-To: The Code Function
Understanding Managed Service Providers (MSPs) and What They Do
The field of information technology has advanced at a breakneck pace in the last 20 years. Hence, it has become imperative for any business to know and adopt technologies that can make them productive and more competent at the same time. However, not all firms have the resources to expand their team of IT professionals for several reasons, particularly within small and medium-sized businesses.
ChaosSearch Named "Most Likely to be the Next Boston Unicorn" in Startup Boston's Community Awards
By 2030, e-Waste Will Reach 2.5 Million Metric Tons Unless We 'Sober Up'
Let’s admit something without shame: we love to use new technology. Maybe the latest smart phone, or a new lightweight laptop or tablet that makes it easier to work from anywhere, it’s all fair game. And when we are at our desk, we enjoy creating expansive workspaces with multiple monitors, a full-size keyboard, and other extras. When we look across our household, we might have duplicate, perhaps triplicate resources growing our technology real estate exponentially.
Model-driven observability: Embedded Alert Rules
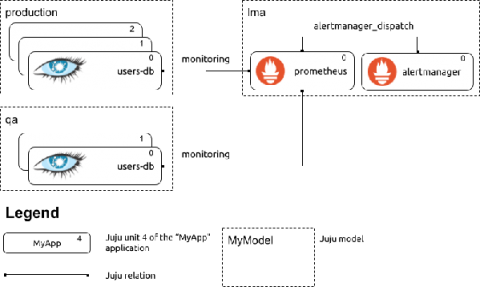
This post is about alert rules. Operators should ensure a baseline of observability for the software they operate. In this blog post, we cover Prometheus alert rules, how they work and their gotchas, and discuss how Prometheus alert rules can be embedded in Juju charms and how Juju topology enables the scoping of embedded alert rules to avoid inaccuracies.
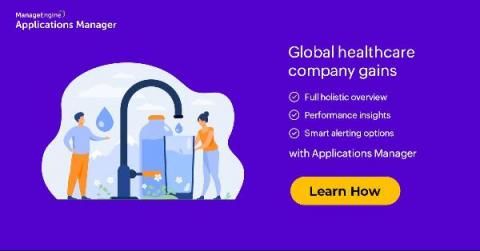
Kent RO sees 50% faster MTTR with Applications Manager
Kent RO is an Indian multinational healthcare product company and a leader in the reverse osmosis (RO) water purifier category. Founded in 1999, Kent RO pioneered and brought the revolutionary RO technology to India. With a vision to enhance the quality of everyday living, Kent RO has evolved as a market leader that provides technologically advanced healthcare products ranging from water purifiers, air purifiers, to water softeners.
Maximize network traffic insights with extended raw data storage
Introducing HighPerf, our highly scalable raw storage database that facilitates smarter analytics, faster troubleshooting, and better bandwidth management.
Morgan McLean on Splunk's Enthusiasm for OpenTelemetry
Find the right person at the right time to fix the right issue with SCIM for Okta, Code Owners with GitHub, and more
If you know someone who actually likes managing work across projects, we’d love to meet this mythical being. Because we can’t imagine who enjoys hand-sifting through digital piles of notifications, prioritizing issues, then tracking down the right developer to assign the issue to. And once you’re done with that detective work, your engineer-of-the-hour may not even have access to the right tools to resolve the issue. Who’s got time for all this org chart spelunking?
UptimeRobot August 2021 Update: Configurable Timeout, support improvements and Plesk extension
We’ve been busy this summer and introduced two new features last month – longer intervals and a grace period for recurring jobs monitoring (Heartbeat monitors). There is some good news this month too, so let’s get right into it!
Authentication and Authorization for RESTful APIs: Steps to Getting Started
Why do APIs require authentication in the first place? Users don't always need keys for read-only APIs. However, most commercial APIs require permission via API keys or other ways. Users might make an unlimited number of API calls without needing to register if your API had no security. Allowing limitless requests would make it impossible to develop a business structure for your API. Furthermore, without authentication, it would be difficult to link requests to individual user data.
Avoid dropped logs due to out-of-order timestamps with a new Loki feature
Dropped log lines due to out-of-order timestamps can be a thing of the past! Allowing out-of-order writes has been one of the most-requested features for Loki, and we’re happy to announce that in the upcoming v2.4 release, the requirement to have log lines arrive in order by timestamp will be lifted. Simple configuration will allow out-of-order writes for Loki v2.4.
Volume, velocity, variety, and variability - Arijit Mukherji on Splunk Observability Cloud
Scale for fully automated Kubernetes monitoring in minutes
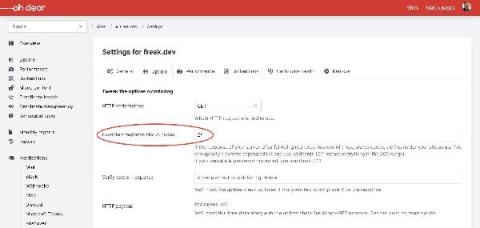
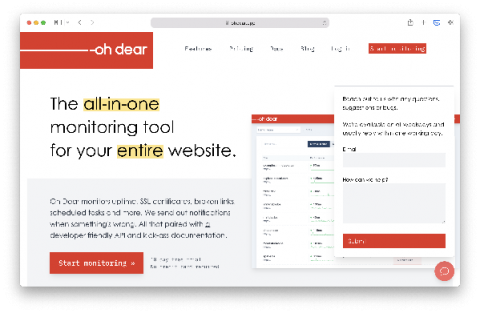
Monitoring password protected sites using Oh Dear
Keeping an eye on your site and sending you a notification when it goes down is one of the core features of Oh Dear. Under the hood, we'll send a request to your site and take a look if the response code is in the 200-299 range, which is the default response code range to indicate that everything is ok. Some of our users are monitoring password protected sites. In such cases, the web server might reply with status code 401 (unauthorised).
What Are JSON Web Tokens?
Automate Your Way to a Better Citrix End User Experience
Sound Bytes: IT leaders on the importance of full-stack observability
We chatted with top IT leadership about the impact that full-stack observability has on their business. Here’s what they had to say.
Elastic and StackState Team Up to Pull Needles Out of Haystacks
Delivering great performance and reliability for your critical applications just keeps getting harder, doesn’t it? Between microservices, mercurial cloud resources, containers spinning up and down, distributed teams, specialized teams, and developers making changes, it’s an increasingly complex environment. With so many moving parts, if something goes wrong, how do you know what happened where, and what your environment looked like at the precise moment the problem began?
WHAT'S NEW Pandora FMS 757
Let’s check out together the features and improvements related to Pandora FMS new release: Pandora FMS 757.
How Refinery Helps With Sampling Complex Event Data
Sampling is the practice of extracting a subset of data from a dataset to make conclusions about that larger dataset. It’s far from a perfect solution, but when it’s implemented with Refinery, Honeycomb’s trace-aware sampling proxy, sampling can help you manage very high volumes of complex event data.
Elastic named EMA Top 3 Award winner in Automatic End-to-End Observability
We are excited to announce that Elastic Observability has earned the Enterprise Management Associates Top 3 Award for Observability in 2021, a recognition of our commitment to empowering customers with products and features that advance digital transformation and solve real-life problems. This award is driven by EMA’s exhaustive, quantitative research into the top challenges and use cases facing developers, DevOps, SREs, IT professionals, and business professionals.
A simplified stack monitoring experience in Elastic Cloud on Kubernetes
To monitor your Elastic Stack with Elastic Cloud on Kubernetes (ECK), you can deploy Metricbeat and Filebeat to collect metrics and logs and send them to the monitoring cluster, as mentioned in this blog. However, this requires understanding and managing the complexity of Beats configuration and Kubernetes role-based access control (RBAC). Now, in ECK 1.7, the Elasticsearch and Kibana resources have been enhanced to let us specify a reference to a monitoring cluster.
What Is Distributed Tracing and Why You Need It
It is no surprise that monitoring workloads are top of mind for many organizations to ensure a successful customer experience. As our applications become more distributed and cloud-native, we find that monitoring can become more complex. A single user transaction fans out to interact with tens or hundreds of microservices, each one requesting data from backend data stores or otherwise interacting with each other and other parts of your infrastructure.
Nexthink Named Customers' Choice in 2021 Gartner Voice of Customer Report
The Nexthink team is excited to announce that we have been recognized in the September 2021, Peer Insights ‘Voice of the Customer’ report. Customers submitted over 150 reviews with an overall star rating of 4.6 (out of 5) and an impressive 4.7 rating (out of 5) for ‘Support Experience’ as of July 2021. Our team at Nexthink takes great pride in this distinction, as customer feedback continues to shape our products and services.
Service Watch Digital Experience Monitoring
Complete Office 365 Monitoring
Microsoft Teams Monitoring by Exoprise
It's Here! Monitor Microsoft Teams Audio Video Conferencing
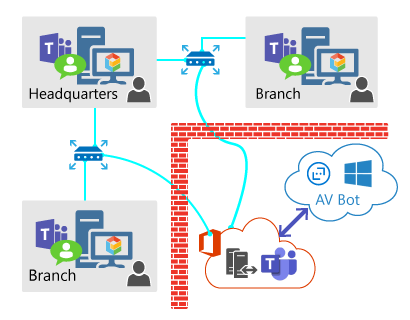
Exoprise released its long awaited Teams Audio Video Conferencing sensor. This sensor fully tests Audio/Video end-to-end capacity, throughput, and network performance through the actual underlying Microsoft Teams and Azure infrastructure. The Teams AV sensor provides deep insight into a network’s capability to handle the Teams/Skype Unified Communications (UC) platform.
Cannot connect to a website in Vietnam? Try these steps if your website is not accessible.
On September 4, 2021 a major submarine cable broke down in Vietnam causing network connectivity issues for a large portion of the population. Organizations hosted online and those with data centers outside those perimeters were hit the worst with most of their applications down or running extremely slow.
DataDog vs Jaeger - key features, differences and alternatives
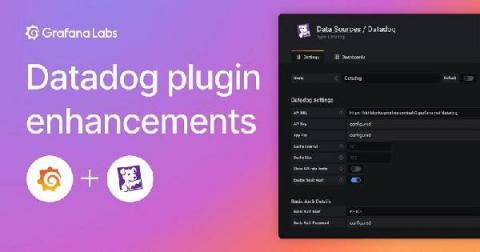
How the new Datadog plugin enhancements extend interoperability for our customers
At Grafana Labs, we have a “big tent” philosophy: We believe our users should be able to determine their own observability strategy and choose their own tools, so we help users bring different data sources together. Datadog is a powerful product used by many teams, and we hear a lot from customers about how we should further embrace and support this critical data source — which is why we created the Datadog data source plugin a few years ago.
CPU Steal Time: A Crucial Metric for Cloud Servers and VMs
If your application runs in a virtualized environment, there is a crucial metric you might not be aware of: CPU steal. In this post, we’ll explain what CPU steal is, how to monitor it, and what happens to your app when CPU steal is high.
How to Debug Cloudflare Workers with AppSignal
In this article, you’ll learn how to capture error logs in your Cloudflare Workers application using AppSignal. We’ll build a simple workers project and integrate AppSignal’s code to collect the necessary metrics. We’ll also learn how to utilize AppSignal’s dashboard to analyze and track errors. Let’s get stuck in!
Setting up a syslog source in 30 seconds | observIQ
Add and manage users | observIQ
Webinar sept 15 2021 - 1080WebShareName.mov
Catchpoint Co-Founders Q&A: What Better Way To Celebrate Our 13th Birthday?
To celebrate our 13th birthday today, I sat down with Catchpoint's co-founders and my friends, Mehdi Daoudi, Chief Executive Officer, Drit Suljoti, Chief Product and Technology Officer, and J. Scotte Barkan, Chief Technology Officer (dialing in from Long Island after a long week of patch fixes), for an informal chat. We looked back to the days when they all met at DoubleClick prior to the three of them (along with Veronica Ellis, now a Principal Engineer at Eventbrite) founding Catchpoint.
What's new in Elastic Maps: Maps tailored to your geospatial data
Sysadmins, cartographers, and dashboard designers can now personalize Elastic Maps to create richer geodata stories. The 7.14 release of Elastic Maps has the geo capabilities to highlight points of interest, hide unnecessary details, and help you explore new trends in your data. Elastic Maps is available now on Elastic Cloud — the only hosted Elasticsearch offering to include all of its latest features.
Network monitoring: The build vs. buy dilemma
AI-based monitoring and anomaly detection is the key to ensuring that businesses can keep pace with the high level of service required for mission-critical applications. Early, contextual detection is a basic requirement for speedy resolution. AI-based monitoring creates more visibility and provides the agility needed to mitigate the outages, blackouts, glitches and issues that do and will happen.
Proactively monitoring customer experience and network performance in real-time
According to a recent Capgemini research, fewer than half (48%) of consumers feel that the connectivity services that they have today adequately meet their remote needs. Still, many CSPs openly admit that they often hear about service issues via social media and sites like Downdetector. And with the fixed/mobile convergence, a negative home broadband experience now has the potential to cause churn for CSPs’ mobile customers too.
Increase approval rates with AI-based payment transaction monitoring
The financial world is being increasingly digitized and decentralized with many more networks, data sources and movements that need to be reconciled and monitored — not to mention satisfy compliance requirements with various regulatory bodies. The digital transformation and decentralization of the Fintech segment has resulted in increasing channel complexities, more third party applications and a higher volume and velocity of payments data that need to be monitored in real-time.
Payment gateway analytics for payment service providers
Payment gateway analytics tracks the payment processing journey and related event data across all payment gateways. When used efficiently, payment gateway analytics can benefit businesses by providing insights into their revenues, payment trends, and customer behavior. Payment gateway analytics provides much needed visibility into the payments environment to enable the fast detection of transaction performance issues, anomalies or trends.
How to Retain Customers on your SaaS Platform: Four Key Techniques
New customer logos may be the lifeblood of top-line revenue growth and the focus of sales and marketing teams. But renewals have emerged in the last few years as a key growth driver for SaaS companies. A recent McKinsey study indicated that existing customers can drive between a third and a half of new revenue growth, even at startups. And we’ve all seen the data that says new customer acquisition costs 5X as much as customer retention.
Why a Slow Website Hurts Your Conversion Efforts
Six years ago, Microsoft found that our global attention span had shrunk from twelve to eight seconds in just five years. This was back in 2015 when Instagram had 400 million users (it currently has over 1 billion), and TikTok, the 15-second-video king, wasn't even born. Yes, our patience is becoming shorter and shorter, and the internet is flooded with websites and content. But all is not lost. If you make sure your website loads faster than average, you may have a chance to bag a potential customer.
SolarWinds IT Pro Day Survey Reveals Tech Pros Are Motivated To Take on New Challenges and Expand Responsibilities
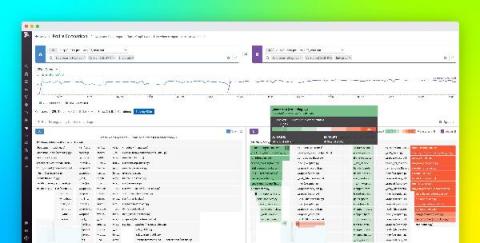
Compare and optimize your code with Datadog Profile Comparison
Code profilers offer detailed insight into the efficiency of application code by measuring things like the execution time and resource utilization of a service. Datadog’s always-on, low overhead Continuous Profiler provides snapshots of code performance for a service that are tagged with key metadata (e.g., region, service, release), so you can easily identify and optimize inefficient code.
AWS X-Ray vs Jaeger - key features, differences and alternatives
What's new in Grafana Cloud for September 2021: New panels, query caching, synthetic monitoring updates, and more
Here at Grafana, we’re constantly shipping new features to help our users get the most out of Grafana Cloud. Over the last few months, we’ve made it even easier to get started with out-of-the-box dashboards and new visualizations in Grafana Cloud. We also introduced capabilities like query caching, a “prettify JSON” option and commands for cortex-tools to make your data, dashboards, and queries more efficient.
Scout APM vs. New Relic vs. Dynatrace
Application performance monitoring (APM) is important for the development of any web app. But monitoring software is not an easy process; you have to observe various metrics and be calculative in observing measurements like the application’s speed, error percentage, memory bloat, number of API calls per day, and much more.
Overprovisioned and Overspent: Optimize Before You Lift and Shift
Logging Gitlab Runners for MacOS and Linux
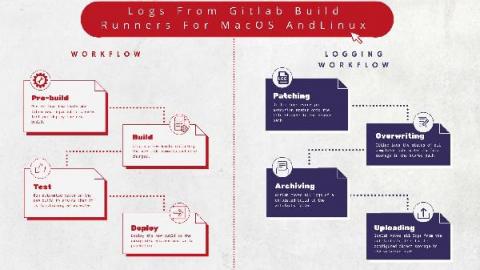
Gitlab is the DevOps lifecycle tool of choice for most application developers. It was developed to offer continuous integration and deployment pipeline features on an open-source licensing model. GitLab Runner is an open-source application that is integrated within the GitLab CI/ CD pipeline to automate running jobs in the pipeline. It is written in GoLang, making it platform agnostic. It is installed onto any supported operating system, a locally hosted application environment, or within a container.
Open-Source Monitoring With SolarWinds AppOptics
Monitoring Amazon AWS Cloud
It is incumbent on cloud operations teams to choose the correct type of AWS EC2 instance relative to the underlying application. The wrong choice could adversely impact business and user experience. This article walks through a customer case study where the EC2 instance choice impacted their business.
Server Health and Health Checks: A Detailed Guide
Undeniably, monitoring your servers is extremely important. Not only does it help you stop issues daily, but it also helps you with tasks like scaling and capacity planning. But no matter how advanced your monitoring is, it always starts with a simple server health indication. Actually, maybe “simple” isn’t the best word here. “Server health” usually gives you a “healthy/not healthy” indication.
No more searching for a needle in a haystack: A world where Elastic & StackState team up
Meeting the goal of delivering great performance and reliability in the face of our ever-changing, increasingly autonomous IT environments is fundamentally challenged by a data problem. Sure, there’s lots of it - logs, metrics, and APM traces - but it is exceedingly hard to extract actionable information when there are so many fast moving parts.
Broadcom Awarded Highest Vendor Score in EMA Radar Report For NPM
Broadcom is proud to be named a “Value Leader” in the 2021 EMA Radar Report For Network Performance Management. Broadcom received the highest vendor strength score and was selected as having the best alert and alarm management. We believe this recognition validates our strong NetOps vision and our ability to speed the delivery of new network monitoring software innovations that help address the network transformation challenges of our customers.
What is QUIC? Everything You Need to Know
3 Big Reasons to Upgrade Your Experience
As a Nexthink V6 Customer, you’re already realizing the power and value of a proactive, Digital Employee Experience (DEX) management solution: more productive employees, reduction in employee issues, and a smoother, more accelerated time-to-resolution for employee-reported IT issues.
Saving Money with Foglight: Part 1 - Vendor Consolidation through Centralized Monitoring
Far too often, organizations look at monitoring solutions as "nice to have", or better put, as luxury items that make the lives of IT administrators easier, but come at a cost. This series will look at ways that organizations have saved money off of their IT budgets, by bringing Foglight into their environment. The first post in this multi-part series will focus on consolidating an organizations cross platform database monitoring under a single solution: Foglight for Databases.
Why ZE PowerGroup chose Applications Manager to monitor its data analytics platform
ZE PowerGroup Inc. is a British Columbia-based software company. It offers ZEMA, an award-winning data management, analytics, and integration platform. Although ZEMA was created in-house, the developers at ZE were never successful at measuring the performance of the application during the initial years. They tried a few third-party tools, but measuring the actual application performance continued to be a dilemma until they evaluated ManageEngine’s Applications Manager.
Auto-Instrumenting Ruby Apps with OpenTelemetry
In this tutorial, we will go through a working example of a Ruby application auto-instrumented with OpenTelemetry. To keep things simple, we will create a basic “Hello World” application, instrument it with OpenTelemetry’s Ruby client library to generate trace data and send it to an OpenTelemetry Collector. The Collector will then export the trace data to an external distributed tracing analytics tool of our choice.
Jaeger vs Zipkin - Key architecture components, differences and alternatives
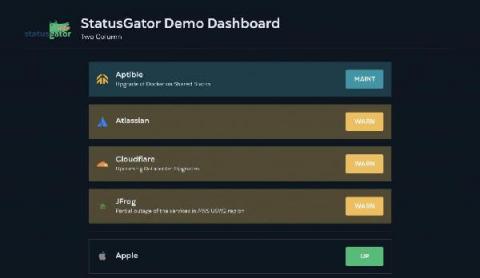
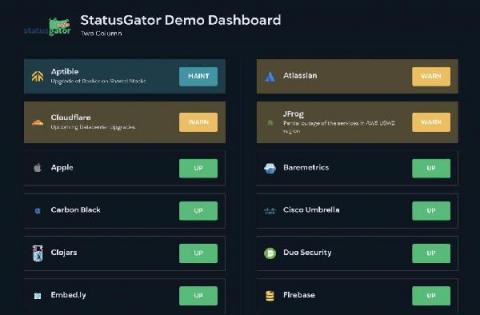
Status Dashboards: Now with dark mode!
Since we first launched our customizable, brandable, public status dashboards, customers have been asking us for a dark mode version. We’re excited to announce dark mode has arrived! StatusGator is the premier status page aggregator that collects the status of all the services you depend on and organizes them into a handy public dashboard you can send to your team, users, or stakeholders. And now it won’t blind you with it’s bright white background!
Status Dashboards now automatically refresh!
Many customers have requested that StatusGator’s customizable, brandable, aggregated status dashboards automatically refresh. Well your auto refreshing dreams have just come true because StatusGator status dashboards now update every 5 minutes automatically! Each dashboard will now refresh every 300 seconds, otherwise known as 5 minutes, automatically. And, of course, you can still refresh your browser yourself to get the latest content.
Logz.io's New Lookz is Generally Available!
Back in June, we announced the Public Beta for Logz.io’s New Lookz – which is a new UI that completely changes the way users navigate across Logz.io products and features. The Public Beta gave users the option to toggle between the old and new UIs to see which one they liked better. And the answer from our users was as clear as it could be.
You can now customize the names of services in StatusGator
StatusGator is the easiest way to publish a unified status page featuring the status of all the services you depend on. Our public status dashboards have become a favorite feature allowing schools, startups, and enterprises alike to publish a quick and easy page showing the status of all their cloud services. One commonly requested feature has been the ability to customize the name of each status page listed in your dashboard.
How to extend the Geth collector
This is the the last of a 2-part blog post series regarding Netdata and Geth. If you missed the first, be sure to check it out here. Geth is short for Go-Ethereum and is the official implementation of the Ethereum Client in Go. Currently it’s one of the most widely used implementations and a core piece of infrastructure for the Ethereum ecosystem. With this proof of concept I wanted to showcase how easy it really is to gather data from any Prometheus endpoint and visualize them in Netdata.
How to ingest data with PHP Client into App Search
Datadog on Gamedays
How Do You Know Your Website is Down?
Did you know that California was one of the earliest adopters in the world for earthquake automated detection? Though rudimentary, early systems were literally horns strapped to government buildings, the idea was simple: sound an alarm the moment that an earthquake could be confirmed. The critical period of warning residents get can prove the difference between finding shelter and securing your family. In a land where earthquakes level buildings, detection was critical.
Introducing our new support bubble
Like most SaaS products, Oh Dear is a living platform. We add new features proposed by our users, fix bugs that get reported, and regrettable also sometimes introduce new bugs. Most users use email to communicate with us. Even though sending an email is often perceived as friction-free, it can be a minor hurdle. We've introduced a little support bubble at the bottom of every page to make it easier for our users to pass us feature requests and report bugs.
3 Ways to Use the xMatters and Google Operations Suite Integration
Not too long ago, you would have needed development experience to oversee the delivery of scalable and reliable software. But with the rise of low-code and no-code tools, that requirement is now obsolete. What used to be hours of coding has turned into a few minutes of dragging and dropping.
Workload Pricing and SVCs: What You Can See and Control
The Cloud Monitoring Console (CMC) lets Splunk Cloud Platform administrators view information about the status of a Splunk Cloud Platform deployment. For workload pricing, the CMC lets you monitor usage and stay within your subscription entitlement. From the CMC you can see both ingest and SVC usage information and can gain insight into how your Splunk Cloud Platform deployment is performing.
What is Splunk Virtual Compute (SVC)?
A Splunk Virtual Compute (SVC) unit is a powerful component of our workload pricing model. Historically, we priced purely on the amount of data sent into Splunk, leading some customers to limit data ingestion to avoid expense related to high volumes of data with low requirements on reporting. With Splunk workload pricing, you now have ultimate flexibility and control over your data and cost.
Destination Transformation: Planning Your Cloud Migration Journey
If the cloud is a destination you have planned for any of your enterprise workloads, then you need to be prepared to navigate the journey that is the cloud migration process. It’s not unlike planning for a physical trip to a fabulous destination (or maybe we’re just really really ready to start traveling again). Either way, we’ve got some travel tips to ensure that your cloud-bound workloads have a great trip.
Greater Expectations: How the Smartphone Put Employees in Charge
The first time I was introduced to a real, proper PC was in the early 90’s: my uncle’s work PC, which I used instead to play games. In fact, my first experience with any kind of tech support service was when I phoned the Codemasters help line after getting stuck on a particularly knotty puzzle in the game ‘Dizzy’. No matter how loudly I shouted into the phone, the machine continued to route me back to the beginning of its automated script.
Getting Started with PHP and InfluxDB
This article was written by Cameron Pavey, a full-stack dev living and working in Melbourne. Scroll below for this picture and bio. As a developer, it is likely that you will eventually run into a situation where a traditional relational database’s document stores don’t quite cut it. If you need to store points of data over time, you’ll likely need a time series database.
Logz.io Extends Alert Communications via Microsoft Teams Integration
If you’re a DevOps practitioner working in a Microsoft-centric environment, you’ll be pleased to learn that Logz.io recently added support for the popular Teams communications hub to help broadcast pressing alerts and other monitoring data. The integration comes on the heels of making the Logz.io platform directly available from within the Azure Console and expands organizations’ abilities to communicate and share notifications about everything from log data to security events.
Jaeger vs Elastic APM - key differences, features and alternatives
Using Cribl LogStream to Ingest OctoPrint Logs in OpenSearch
Five worthy reads: Data center operations through the eyes of AI
Five worthy reads is a regular column on five noteworthy items we’ve discovered while researching trending and timeless topics. In this edition, we’ll learn about AI deployment in data center operations and how it enables better performance and efficiency.
OP5's network monitoring as an alternative to SolarWinds' Orion
An infamous cyberattack in late 2020 made SolarWinds a household name in the tech industry after it was discovered to be at the center of a supply-chain attack on its Orion network management tool. That attack allowed state-sponsored actors to push a malicious update to nearly 18,000 customers, including U.S. government agencies and about 100 large private enterprises.
Integrate SCOM with your tools using Webhooks Webinar 9-Sep-2021
Grey's Academy 201: O11y (Observability Suite)
New in Grafana 8.1: Gradient mode for Time series visualizations and dynamic panel configuration
Grafana 8 brought with it many exciting new features, including the launch of a new alerting system and the expansion of Grafana’s live and streaming data functionality. We didn’t stop there. In Grafana 8.1, alongside new additions like the Geomap and Annotations panel, we introduced some new features to the Time series panel as well as two transformations to help make panel configuration more dynamic.
Product Explainer Video Short: Splunk Infrastructure Monitoring for Real-time Cloud Monitoring
Proactive Microsoft Teams Service Monitoring
The IT department of an organization is tasked with helping maintain the productivity of their Microsoft Teams and Microsoft 365 services, facilitating effective service delivery for all users. The executives of the business (VIPs) are sensitive to optimized performance as they must regularly conduct very important calls and meetings.
observIQ Releases First PnP Solution for monitoring arm-based Kubernetes
Arm-based Kubernetes clusters have been in use for a while, albeit mostly for niche uses, by enthusiasts, and DIY hobbyists. But that is changing. Arm architecture offers an efficiency and scalability that other architectures do not, and that makes it appealing to businesses.
News Roundup September 10, 2021
On this day in 1984, Canadian-American Alex Trebek made his first appearance as host for the daily syndicated version of Jeopardy!
Step up your multi-cloud management game with Kubernetes
Managing containers effectively in multi-cloud environments is nearly impossible. Kubernetes makes it possible.
Node.js Performance Monitoring
Software developers use the Node.js environment to develop robust and innovative applications. But the bigger the goal, the higher the risk. Learn about Node.js performance monitoring to ensure quality and risk-free software products. Part of diligent software development is making sure all system applications work well individually and as a whole.
Mean Time to Innocence: Avoiding the Blame Game with Desktop Virtualization
Mean time to innocence (MTTI) is a term used by IT teams to prove that their respective domain is not the source of a particular issue. In other words, it’s a fancy term to avoid blame when something goes wrong. Each team has its own domain-specific tools to prove the issue is not their fault. With respect to desktop virtualization, here are just some of the domains that are relevant when diagnosing issues.
Green IT and DEX: Impactful Change Through Employee Experience.
The fast-paced adoption of digital workplace technologies provides fantastic opportunities to improve digital employee experience (DEX). But it comes at a cost. Digital technology has a serious—and increasing—impact on our environment, with a carbon footprint of about 4% of global carbon emission (that’s more than the aviation industry’s 2.5% contribution).
Flux Aggregation in InfluxDB: Now or Later
Aggregations are a powerful tool when processing large amounts of time series data. In fact, most of the time you’re going to care more about the min, max, mean, count or last values of your dataset than you will about the raw values you’re collecting. Knowing this, InfluxDB and the Flux language make it as easy as possible to run these aggregations, whenever and wherever you need to, and sometimes that leads people to running them in ways that aren’t as efficient as they could be.
Hook Relay Is Livin' That FULL Duplex Lyfe!
Why You Need Error Grouping
Best practices for getting started with Datadog Network Performance Monitoring
Whether running on a fully cloud-hosted environment, on-premise servers, or a hybrid solution, modern services and applications are heavily reliant on network and DNS performance. This makes comprehensive visibility into your network a key part of monitoring application health and performance. But as your applications grow in scale and complexity, gaining this visibility is challenging.
Jaeger vs New Relic - Key differences, use-cases and alternatives
A Comparison of 6 Airbrake Alternatives for Error Monitoring
We all need an application that can run smoothly, but this is not what we always get. After creating an application and putting it to use, you need to check and know when it faces exceptions/errors. As a result, this explains why the current market features several error tracking tools. Airbrake falls under the top-notch error monitoring tools used for log analysis and log management. However, it’s not without its problems.
Mark Rows in UI
Smart gardening with a Raspi and Prometheus
Let’s build a smart gardening system with Prometheus and a Raspberry pi. Having plants at home can reduce your stress levels and make your home look more delightful. Seeing your indoor oasis growing gives us a sense of accomplishment and makes us feel proud… until you see that first brown leaf. That’s when you start doubting your green fingers.
OpenSearch Queries: Query DSL and Beyond
OpenSearch has evolved rapidly since its fork from the source code of the last truly open source version of Elasticsearch. So far, the community’s work has focused on removing proprietary code from Elastic, including a number of things that were never purely open source themselves. These include some aspects of the querying languages and capabilities of Elasticsearch.
How Streamlining ITSM Operations Can Reduce Service Remediation Costs
When using Microsoft 365 services the main benefit of having a monitoring tool that can assess performance quality and identify issues is that it sends alerts into a ticketing tool such as ServiceNow for example, to initiate the process of remediating the problem. When you don’t have a monitoring tool in place then support tickets aren’t automatically sent and users must identify issues and send in tickets manually with little to no information on where the problem came from.
Issue Details Tags
New Search Syntax and Autocomplete
Suspect Tags and Embedded Transactions
How to use AWS IoT SiteWise Edge and Grafana to collect and monitor industrial data on-premises
The AWS IoT SiteWise plugin for Grafana was created to enable AWS IoT SiteWise customers to visualize and monitor industrial equipment data using Grafana dashboards. Industrial customers use AWS IoT SiteWise to collect, process, and monitor their industrial data at scale. This plugin allows them to use Grafana dashboards to monitor this data, stored by AWS IoT SiteWise in the AWS Cloud.
Use Suspect Tags to improve App Performance
When you’re trying to optimize your application for performance, it helps to understand not only the number of people affected, but also user conditions of the slowest transactions, such as OS, browser type, and even connection type. When you’re looking at performance data, it can be hard to see the forest through the trees.
New Hive Data Center Monitoring Agent
Obkio announces a new Monitoring Agent operated by Hive Data Center, a retail data center colocation provider based in Montreal, Quebec. Learn how Hive Data Center’s new Obkio Monitoring Agent will allow them to better support their customers and improve their quality of service.
How LogicMonitor Can Use Errors From Airbrake in Dashboards and Alerts
What is IT Automation?
Lightrun Community Update - Python & Node.js Release
Why SQL Server Monitoring Is the First Step in Improving Performance
Incident Review - What Was Behind the September 7 Spectrum Outage: A Case of Dr. BGP Hijack or Mr. BGP Mistake?
September 7, 2021, 16:36 UTC: an outage hit Spectrum cable customers in the Midwest of the U.S., including Ohio, Wisconsin and Kentucky. Users of their broadband and TV services hit social media to voice their annoyance at the disruption it was causing. Everything was resolved at around 18:11 UTC, and services were restored to users.
De Watergroep and Devoteam build Elastic Observability pipeline to deliver water to millions
De Watergroep is responsible for the supply of water to more than 3 million customers and hundreds of companies in Belgium. An organisation operating in the public sector, De Watergroep's main goal is to continuously ensure the availability of high-quality drinking water. De Watergroep also is constantly engaged in technological innovation, focusing on keeping distribution costs low, and making maintenance more cost efficient.
Secure your deployments on Elastic Cloud with Google Cloud Private Service Connect
We are pleased to announce the general availability of the Google Cloud Private Service Connect integration with Elastic Cloud. Elastic Cloud VPC connectivity is now available to all customers across all subscription tiers and cloud providers (AWS, Microsoft Azure, and Google Cloud).
The Monitor - August 2021
The OpsRamp Monitor captures the latest buzz around what’s trending in the world of ITOps and related technology, and August was an especially busy month. Let’s dig in.
All You Need To Know About HAProxy Log Format
Data Lakes Are Gaining Maturity, According to 2021 Gartner Hype Cycle for Data Management
Monitor your Netlify sites with Datadog
Netlify is a Jamstack web development platform that lets customers build and deploy dynamic, highly performant web apps. By uniting popular JavaScript frameworks, developer tools, and APIs into streamlined workflows, Netlify helps teams rapidly spin up and ship common Jamstack use cases, including e-commerce stores, SaaS applications, and corporate sites. Netlify supports these deployments with an integrated CI/CD tool, global multi-cloud edge network, and serverless backend.
Announcing support for EKS Anywhere
Amazon Elastic Kubernetes Service (EKS) is a cloud-based compute platform that includes a fully managed Kubernetes control plane in order to simplify cluster operations. AWS introduced EKS Anywhere to bring the operational ease of EKS to organizations that manage on-premise environments (e.g., to meet data sovereignty requirements).
Jaeger vs OpenTracing - Key differences, use-cases and alternatives
Circonus Extends its Powerful Full-Stack Observability for Edge Computing, 5G Applications, and IoT Deployments
The monitoring industry is changing rapidly. Gartner reports that by 2022, 50% of enterprise-generated data will be created and processed outside of a traditional data center or cloud, up from less than 10% in 2019 and that number could reach 75% by 2025.
Top 7 Dynatrace Competitors to Know in 2021
Dynatrace is a publicly-traded global technology company that provides a software intelligence platform based on artificial intelligence (AI) and automation to monitor and enhance application performance, development and security, IT infrastructure, and user experience for enterprises and government organizations around the world. The headquarters of Dynatrace is in Waltham, Massachusetts. Dynatrace's CEO is John Van Siclen.
Launching Public Status Pages for Uptime Monitoring on AppSignal
Since the launch of uptime monitoring, we have received a lot of positive feedback. There were also a couple of much-requested additional features that we hope to address in this huge update.
How to install Pandora FMS on VMware
Maintaining reliable services with advanced Cloud Logging features
Monitoring Physical Security With Graylog final
Turning Data into Doing
InfluxDB IOx Tech Talks - Observability of InfluxDB IOx: Tracing, Metrics and System Tables
Using MQ Statistics with Nastel Navigator X
Rollbar Academy: Production Code Quality
Automate and Virtualize the NOC: A Gannett/USA TODAY Network Case Study
Mission creep is a phenomenon that occurs after a project begins and gains momentum, but then gradually grows beyond the original, intended scope. One day you wake up and realize that, instead of an efficient, manageable project, you’ve got a monster on your hands. For enterprises in the midst of dynamic growth, IT infrastructure is often beset by mission creep. The incumbent organization acquires smaller operations, integrates their technology, and soon things are out of control.
How to Perform Python Remote Debugging
Debugging is the process of identifying, analyzing and removing errors in the software. It is a process that can start at any stage of the software development, even as early as the software has been written. Sometimes, remote debugging is necessary. In the simplest terms, remote debugging is debugging an application running in a remote environment like production and staging.
How to Clear Up Alert Storms by 90%?
Alerts are notifications from AIOps monitoring tools that indicate that there is an anomaly. IT teams get these alerts on their monitoring dashboard via emails or enterprise collaboration tools such as Slack or Teams. Service level agreements expect IT teams to analyze every alert within a specific timeframe and take appropriate action.
How to Control Alert Fatigue?
Alerts are indispensable to any IT operations system today. Site reliability engineers (SREs) or ITOps executives set up several monitoring tools for their IT landscape. When there is a change, high-risk action, or outage in any of these incidents, the monitoring tool triggers an automated alert. This could happen on the monitoring tool’s dashboard itself, via email, or enterprise collaboration tools like Slack or Teams.
The Five Data Pillars of Effective Root-Cause Analysis
The most effective way to understand an incident, resolve it and prevent it from occurring again is root-cause analysis. Simply put, root-cause analysis is the study performed by ITOps teams or site reliability engineers (SREs) to pinpoint the exact element/error that caused the unexpected behavior. Based on this, they plan remediation. Accurate and timely root-cause analysis can have a direct impact on the company’s top and bottom line.
Spotting and Avoiding Database Drift
What Is Cloud Monitoring? 13 Best Practices For Complete Visibility
Metrics now generally available in Honeycomb
Starting today, Honeycomb Metrics is now generally available to all Enterprise customers. You’ve adopted our event-based observability practices, in part to overcome the debugging roadblocks you hit when using custom metrics to identify application issues. But metrics do still provide value at the systems level. Now, you can easily see and use your metrics data alongside your event data in Honeycomb—all in one interface.
Tracing AWS Lambdas with OpenTelemetry and Elastic Observability
Open Telemetry represents an effort to combine distributed tracing, metrics and logging into a single set of system components and language-specific libraries. Recently, OpenTelemetry became a CNCF incubating project, but it already enjoys quite a significant community and vendor support. OpenTelemetry defines itself as “an observability framework for cloud-native software”, although it should be able to cover more than what we know as “cloud-native software”.
Painting a Complete Network Monitoring Picture: Why Context is Critical
In order to produce their masterpieces, artists like van Gough, Rembrandt, Picasso, and Monet painted with more than just one color. Being able to choose from multiple colors (not to mention an abundance of talent, inspiration, and creativity) is what allowed these artists to see their complete vision come to life on canvas. However, if you’re relying on a single set of data to troubleshoot network issues, it’s like you’re stuck painting with one color.
5 Best IT Experience Practices Your Team Can Make Today
If you were to put 100 enterprise tech leaders in a room together and ask them if they think their company’s employee experience is dependent upon IT, I’m certain all would agree it is. But I’m also certain those 100 wouldn’t know: For IT decision-makers, the devil is in the details. Many are judged by uncompromising Service Level Agreements (SLAs) and shoddy survey data, not comprehensive digital experience trends and indexes.
CheckMK and Enterprise Alert - a scripted heartbeat check
A few days ago I received an inquiry about a scripting problem from one of our longtime partners, to be exact our DCP Marc Handel from IT unlimited AG. In the exchange with Marc I realized that his idea to use the Enterprise Alert Scripting Host, the Windows Task Scheduler and CheckMK to realize a roundtrip monitoring could be interesting for the whole community. Especially for all our CheckMK customers.
The Observability Data Opportunity
Observability data, and especially log data, is immensely valuable for modern business. Making the right decision—from monitoring the bits and bytes of application code to the actions in the security incident response center—requires the right people to generate insights from data as fast as possible.
Top 5 SCOM Integration Tools
If you’re looking to integrate SCOM with your other IT applications your main drivers are probably centered around; increasing efficiency, improving stakeholder engagement, and smashing your incident response times!
How to Minimize Downtime by Automating Remediation Actions With ipMonitor
Cloud or On-Prem? With Monitoring, It's Both-And, Not Either-Or
Introducing the Lightstep Metrics plugin for Grafana
Chris Sackes is a Software Engineer at Lightstep. A New Yorker by birth, he loves public transportation, architecture photography, and urban exploration. He’s spent the last five years engineering delightful user experiences for a variety of applications. Lightstep’s powerful metrics reporting and analysis are now available for Grafana users. Using the new Lightstep Metrics plugin for Grafana, you can view metrics data reported to Lightstep directly in your Grafana instance.
Monitoring Amazon cloudfront with Graphite via Graphite APIs
MetricFire offers a complete system, infrastructure, and application monitoring using a suite of open-source monitoring tools. With MetricFire, you can monitor all your infrastructure on a single dashboard. The platform displays metrics on the dashboard using either Hosted Prometheus or Graphite-as-a-Service.
How Lowe's SRE reduced its mean time to recovery (MTTR) by over 80 percent
The stakes of managing Lowes.com have never been higher, and that means spotting, troubleshooting and recovering from incidents as quickly as possible, so that customers can continue to do business on our site. To do that, it’s crucial to have solid incident engineering practices in place. Resolving an incident means mitigating the impact and/or restoring the service to its previous condition.
Nginx Logs in 30 Seconds | observIQ
Broadcom Enterprise Software Divison Capabilities Demo
OpenTelemetry - Defining Observability Industry Standards
Plenty of blogs have answered the very Google-able question, “What is OpenTelemetry?” To keep it short and sweet, OpenTelemetry is a collaborative effort across the observability space to create industry-wide standards that will benefit all cloud service providers and observability customers. Technically speaking, OpenTelemetry is a collection of APIs, SDKs, exporters, and collectors.
Finding the Gaps in Your Data Causing Data Drift
The Ultimate Guide To Telemetry
If you’re anywhere in the Queensland region of northern Australia, look out. There’s an eight-foot-nine-inch-long (2.65 meters) crocodile, deceptively named Danny-Boy, who might be looking for a snack. Specifically, if you’re anywhere near -12.975388, 141.987344, you should stay on your toes. That’s the last place Danny-Boy was sighted. So unless you want your pipes to be calling, keep your eyes peeled.
The Challenges of Ajax CDN
Most developers and administrators think that adding a CDN-hosted static file improves performance. A CDN's fast edge servers cache content and deliver it based on the user’s geolocation. These cached servers are faster than a traditional single hosting server, and developers have received the benefit of convenience.
Releasing Icinga for Windows v1.6.0 - Easier and more Secure
Today we are happy to announce the release of Icinga for Windows v1.6.0, which we already demonstrated on YouTube last week. This is one of our largest releases so far, as we improve the entire usability, flexibility, and security of Icinga for Windows.
Using Satellite Server for distributed environment monitoring
Today we will talk about one of the most versatile elements that Pandora FMS Enterprise offers us for monitoring distributed environments, the Satellite server. It will allow you to monitor different networks remotely, without the need to have connectivity directly from the monitoring environment with the computers that make it up.
What Is a Traffic Analysis Attack?
The times when it was enough to install an antivirus to protect yourself from hackers are long gone. We actually don’t hear much about viruses anymore. However, nowadays, there are many different, more internet-based threats. And unfortunately, you don’t need to be a million-dollar company to become a target of an attack. Hackers these days use automated scanners that search for vulnerable machines all over the internet. One such modern threat is a traffic analysis attack.
A Detailed Guide to Real-Time Monitoring
Past performance isn’t always a good predictor of “now” performance, so for this reason, real-time monitoring is a critical part of network management. Organizations must know what’s happening on their network at any given moment. So let’s look at how real-time monitoring can help you accomplish this task.
With Elastic Cloud on AWS, Smarter City Solutions ensures seamless customer experience across the Smarter Parking Platform
Ensuring a seamless customer experience is a growing challenge for digital technology providers. Yet, as functionality and a customer base scale, predictability can become challenging.
Understanding Cardinality in a Monitoring System and Why It's Important
The journey to becoming cloud-native comes with great benefits but also brings challenges. One of these challenges is the volume of operational data from cloud-native deployments — data comes from the cloud infrastructure, ephemeral application components, user activity, and more. The increased number of data sources does not only increase datapoint volume – it also requires that monitoring systems store and query against data with higher cardinality than ever before.
The 95th Percentile: How to Manage Capacity Before You Run Out
Visualizing Your Time Series Data with the Highcharts Library and InfluxDB
If you’re building an IoT application on top of InfluxDB, you’ll probably use a graphing library to handle your visualization needs. Today we’re going to take a look at the charting library, Highcharts, to visualize our time series data with InfluxDB Cloud. However, I also encourage you to take a look at Giraffe, a React-based visualization library that powers the data visualizations in the InfluxDB 2.0 UI.
Taming Rails Logging with Lograge and LogDNA
Rails is a classic on Ruby for a reason. The framework is powerful, intuitive and the language has a low entry bar. However, being designed when systems existed on a single server, standard Rails logging is excessively fractionalized. Even on a single server, a straightforward call can quickly turn into seven unique, unconnected logs.
The Ultimate Guide to Application Security
Build an Uptime Monitoring System in Ruby with GCE, Cloud Storage, and PubSub
Google Cloud Platform provides developers with many tools to build scalable apps in a way friendlier than AWS. In this article, Olasubomi Oluwalana shows us how we can use the Google Cloud Engine, Storage, and PubSub offerings to build an uptime monitoring system in Ruby.
Metrics first look, more robust frontend and much more - Signal 04
Monitoring Load Balancers with Grafana
Load balancers play an important role in distributed computing. With load balancers, you can distribute heavy work loads across multiple resources, which allows you to scale horizontally. Since they are placed prior to computing resources, they need to endure heavy traffic and allocate it to the right resources fast. For this to happen, monitoring the health and performance of load balancers is key. In monitoring, visualization helps users to view various metrics quickly.
Monitoring Network Switches with Grafana
In monitoring, a target system or device is a deciding factor in designing your monitoring stack. You will have to consider various aspects starting from how you want to collect data in what frequency to how you want to surface metrics to end users. You will have to take this strategic approach when you want to monitor your network infrastructure. In this article, we will discuss how Grafana, an open-source visualization tool, can help you to monitor network switches.
Observability 101 using OpenTelemetry & SigNoz @ Kubernetes Community Day
How to Build a Multi-Cloud Mindset
We often talk about migrating applications to THE cloud, or running workloads in THE cloud, as if the cloud is one, homogenous environment. The reality is, of course, far more complex. There are private clouds and public clouds—and different public cloud service providers (CSPs) that each have their own particular capabilities and strengths. Modern, digitally transformed businesses usually leverage a combination of these clouds.
Top 10 Tools For Google Cloud Architect
Google Cloud Platform is a complex suite of services that are aimed at satisfying client’s computing, storaging, and application operating needs. App Engine, Cloud SQL, Cloud Speech API, Deployment Manager ( just a share of ) are the proud services of a GCP. All of them are developed for optimizing business and making business-client relationships easy and comfortable for sealing the deals and conversions go high.
What Is Network Monitoring?
Network monitoring is the practice of making sure the network as a whole, functions optimally by keeping a watch over all endpoints of a network, which is the heart of any business’s routine functioning. Any discrepancy in the form of a breach or slowdown could prove costly. Proactively monitoring networks helps administrators identify and prevent any potential issues that could occur at any time.
OpenTelemetry tracing - things you need to know before implementing
9 Best Practices for Application Logging that You Must Know
Have you ever glanced at your logs and wondered why they don't make sense? Perhaps you've misused your log levels, and now every log is labelled "Error." Alternatively, your logs may fail to provide clear information about what went wrong, or they may divulge valuable data that hackers may exploit. It is possible to resolve these issues!!!
Announcing: Bitbucket for APM
Raygun's latest integration with Bitbucket gives you code-level insights into your traces, directly in APM. Today, Raygun expands its suite of integrations for APM, introducing the latest addition - Bitbucket. Once your Raygun account is integrated with Bitbucket, you'll be able to see method source code pulled directly from your repository when inspecting a method in APM. If this sounds interesting to you but you use GitHub instead of Bitbucket, don't worry, we've got you covered for that too. Gain greater context into code execution and get to the root cause of slow performance, faster.
Assign Read-Only Access to Users in Logz.io
Cloud monitoring and observability can involve all kinds of stakeholders. From DevOps engineers, to site reliability engineers, to Software Engineers, there are many reasons today’s technical roles would want to see exactly what is happening in production, and why specific events are happening. However, does that mean you’d want everyone in the company to access all of the data?
Root cause analysis using Metric Correlations
As complexity of systems and applications continue to evolve and change, the number of metrics that need to be monitored grows in parallel. Whether you’re on a DevOps team, an SRE, or a developer building the code yourself, many of these components may be fragmented across your infrastructure, making it increasingly difficult to identify the root cause when experiencing downtime or abnormal behavior.
Logging Agents Vs Log Libraries
Log management has been around for a long time, but how we manage our logs has changed profoundly over the years. For effective log management, there are times when you may have to trade off the new for the old, and vice versa. A clear understanding of log agents and log libraries will help assess what works best for different applications and infrastructures.
How Uptime.com Can Help Troubleshoot a Server Outage
Everyone has heard about the 3 AM wakeup call, but what about those troublesome issues that dig at your team and eat away at your SLA hours? Hard-to-diagnose issues can strike at any time. They leach from your team, hurt morale, impede the customer experience… it’s just a whole mess. These kinds of incidents are ones that test what “response” really means to your organization, as fixing them is not always a simple task. Something has gone wrong.
Eliminate Blind Spots by Monitoring Citrix Cloud and Cloud Connectors
Infrastructure as Code - IAC for Azure
Infrastructure as code and automating deployment and scale-up/down in Azure is becoming the new normal. Solution architects and system administrators are becoming coders and scripting is becoming part of their day-to-day job, whilst in parallel a raft of vendors is providing products to try and help avoid this need to script and address the shortage of staff with those skills to script and code this now necessary functionality.
Incident Review - AWS Outage Led To Spikes In Response Times For Applications Using AWS Services
On Tuesday August 31, users across large parts of the West coast (US-West-2 region) were impacted by major spikes in response time. Some of AWS’ most critical services were affected, including Lambda and Kinesis. SRE teams care about Service Level Indicators (SLIs) and Service Level Objectives (SLOs), and this practice is a must for SRE teams.
What to Do About Java Memory Leaks: Tools, Fixes, and More
Memory management is Java’s strongest suit and one of the many reasons developers choose Java over other platforms and programming languages. On paper, you create objects, and Java deploys its garbage collector to allocate and free up memory. But that’s not to say Java is flawless. As a matter of fact, memory leaks happen and they happen a lot in Java applications. We put together this guide to arm you with the know-how to detect, avoid and fix memory leaks in Java.
Our Ops Are Smooth Like A Jar Of Skippy
CircleCI Announces Webhook Integrations with Datadog, Sumo Logic, and Other Technology Partners to Increase Developer Productivity for Software Teams
Why integrate SCOM with anywhere?
While SCOM is a valuable monitoring tool, you may also be using a suite of monitoring tools, such as SolarWinds to monitor network devices, VROps to monitor VMware, and Nagios to monitor your Linux devices, as all these tools are best in class. But, you don’t want to be looking in numerous different consoles to gather all your monitoring data!
Bi-Directional Integration for SCOM & your ITSM Tools
Bi-directional sync enables data to be sent to and from SCOM and your ITSM tools, in the following ways: a) OUTBOUND Notifications (PUSHES alerts from SCOM to another tool) b) INBOUND Notifications (PULLS updates on alerts into SCOM from another tool) This means you can choose which SCOM alerts to send across to your ITSM tools (Cherwell or ServiceNow), they are then raised as incidents, and then using bi-directional sync, info relating to the incidents is pulled back into SCOM (Incident ID, Configurat
AppDynamics vs. Dynatrace vs. Scout | A Side-by-Side Comparison
Choosing the perfect Application Performance Monitoring tool for your business always remains a tricky decision. There are so many options in the market, and each alternative has its own set of features and flaws. Sometimes, the profile of two solutions overlaps, which creates an even bigger grey area around which to opt.
Difference Between IPv4 and IPv6: Why haven't We Entirely Moved to IPv6?
IPv4 and IPv6 are the two versions of IP. IPv4 was first released in 1983 and is currently widely used as an IP address for a variety of systems. It aids in the identification of systems in a network through the use of an address. The 32-bit address, which may store multiple addresses, is employed. Despite this, it is the most widely used internet protocol, controlling the vast bulk of internet traffic. IPv6 was created in 1994 and is referred to as the "next generation" protocol.
Reduce costs and increase performance with query caching in Grafana Cloud
We are excited to announce the launch of query caching in Grafana Cloud, which can significantly reduce load times and costs of your most popular Grafana dashboards. Now, when the same query is submitted repeatedly, the results will come back from the cache rather than the data source itself. This not only lowers load times for popular dashboards, but will also reduce API costs for your data sources and decrease the likelihood that those APIs will rate-limit or throttle requests.
HTTP JSON Web API Input - COVID Dashboard
Overcoming Information Barriers in Microsoft Teams
The phrase “Teams is slow” means that somewhere something isn’t working. But who in the organization should lead the charge to address the problem – especially when the problem isn’t Teams? This blog will examine the different information barriers in Microsoft Teams and how to overcome them.
Icinga for Windows v1.6.0 - Preview and Q&A
Advanced Serverless Debugging
Why integrate with SCOM?
While SCOM is a valuable monitoring tool, you may also be using a suite of monitoring tools, such as SolarWinds to monitor network devices, VROps to monitor VMware, and Nagios to monitor your Linux devices, as all these tools are best in class. But, you don’t want to be looking in numerous different consoles to gather all your monitoring data!
Investigating the Database Family Tree
Incident Review - Akamai Performance Degradation Slows Down Major Websites Worldwide
This summer has seen a series of outages and performance degradations from some of the world’s most widely used CDNs, including the June 8, 2021 Fastly outage (owing to DNS or configuration issues) and an Akamai outage on July 22, 2021 (also likely caused by DNS failure).
An Introduction to Distributed Tracing
There’s no strict definition of a distributed system. But generally speaking, if you have reached a point where you’re running more than five interdependent services at once, that means you’re running a distributed system. It also means you are more than likely experiencing difficulties when troubleshooting using traditional debugging tools. Unfortunately, pulling up multiple tools, each built for a monolithic world, doesn’t help pinpoint the problem.
Smarter CPU Testing - How to Benchmark Kaby Lake & Haswell Memory Latency
Modern CPUs are complex beasts with billions of transistors. This complexity in hardware brings indeterminacy even in simple software algorithms. Let’s benchmark a simple list traversal. Does the average node access latency correspond to say, a CPU cache latency? Let’s test it! Here we benchmark access latency for lists with a different number of nodes. All the lists are contiguous in memory, traversed sequentially, and have a 4 KB padding between the next pointers.
Full visibility of Microsoft Azure cloud service health - resolve issues before they impact on your customers.
For large digital enterprises Microsoft Azure and private cloud offering Azure Stack Hub have emerged as the strategic cloud platforms of choice for many organizations. Azure offers an open and flexible platform on which to quickly build, deploy and manage applications at scale.
Applications Manager: Recent licensing updates
We recently made a couple of updates to our licensing structure based on feedback from users and partners. These changes are applicable to the Professional Edition of Applications Manager. Here is a quick summary of the updates.
NiCE Domino Management Pack 8.10
The NiCE Domino Management Pack is an enterprise-ready Microsoft SCOM add-on for advanced HCL Domino monitoring. It supports Domino system and application administrators in centralized Domino health and performance monitoring to improve user experience and business results. The Management Pack provides clear and precise performance indicators and timely alerts enriched by pinpointing problem identification and troubleshooting information.
Exoprise Addresses Application Network Visibility Gap with Latest Digital Experience Monitoring Solution
6 Use Cases for Digital Experience Monitoring
If you live and breathe in the technology industry, chances are you are hearing Digital Experience Monitoring a lot these days. So what is Digital Experience Monitoring (DEM), and why is IT obsessed with it? With a remote-first culture brewing in every company, IT needs to ensure that employees on their machines are productive and satisfied with the performance of typical enterprise applications such as Microsoft 365, Salesforce, Workday, etc. A DEM solution collects application and desktop user experience (UX) insights holistically, giving IT a broader context for troubleshooting performance issues. Let's discuss six use cases for DEM.
How to Handle Exceptions in Java: Complete Tutorial with Examples and Best Practices
As developers, we would like our users to interact with applications that run smoothly and without issues. We want the libraries that we create to be widely adopted and successful. All of that will not happen without the code that handles errors. Java exception handling is often a significant part of the application code. You might use conditionals to handle cases where you expect a certain state and want to avoid erroneous execution – for example, division by zero.
11 Best Tips to Node.js Debugging that You Didn't Know
When people hear the term "Node.js Debugging," they immediately think of the function "console.log()." They also assumed that's how pros debug Node.js applications. Nah!!! That's not good enough, mate. You'll need more than the console.log() function to debug your Node.js application like a pro. If the proper technique is not taken before testing, debugging a Node.js application might be difficult. Testing is an essential part of the development process for any application, software, or website.
Best Practices for Logging in Node.js
Good logging practices are crucial for monitoring and troubleshooting your Node.js servers. They help you track errors in the application, discover performance optimization opportunities, and carry out different kinds of analysis on the system (such as in the case of outages or security issues) to make critical product decisions. Even though logging is an essential aspect of building robust web applications, it’s often ignored or glossed over in discussions about development best practices.
What is Synthetic Monitoring and Why is it Important for Your Business
As a business, whichever industry you are in, there is a fair chance that you depend upon online assets such as mobile applications or API’s for conducting operations. Assuming that one wants to ensure their availability, correct functioning and quick response at all times, it is important to use synthetic monitoring for better customer experience.
What is Forensic Analysis and Why is it Important for the Security of Your Infrastructure
With the advent of cybercrime in recent years, tracking malicious online activities has become imperative for protecting operations in national security, public safety, law and government enforcement along with protecting private citizens. Consequently, the field of computer forensics is growing, now that legal entities and law enforcement has realized the value IT professionals can deliver.
Shortcut to Value With Loggly
Modern Security Monitoring Demands an Integrated Strategy
The ultimate success of any security monitoring platform depends largely on two fundamental requirements – its ability to accurately and efficiently surface threats and its level of integration with adjacent systems. In the world of SIEM, this is perhaps more relevant than any other element of contemporary IT security infrastructure.
Cost of ELK
Monitoring Cisco webex with Grafana
In this article, we will take a look at what Cisco Webex is, how it works, and why it is great for your business. Then we will explore how to monitor Cisco Webex metrics using beautiful and customizable Grafana dashboards. We’ll also look at what are the most popular data sources Grafana uses. Finally, we will figure out how MetricFire simplifies the task of monitoring metrics for us and what are its main advantages.
Java Application Manual Instrumentation for Distributed Traces
IBM MQ 9.2.3 Streaming Queues: Your Integration Infrastructure (i2) Data Win
By now, you have probably seen the announcement for IBM MQ 9.2.3. The first thing to mention is that Nastel had support for 9.2.3 right away. Nastel Technologies is an integration infrastructure management (i2M) solutions company, and IBM MQ is at the heart of most enterprises’ integration infrastructure (i2). Nastel works with the IBM teams to ensure we are ready for any new releases and changes. One key enhancement included in 9.2.3 is the streaming queue.
Introducing Amazon Managed Grafana's AppDynamics plug-in
Seamlessly visualize AppDynamics data and powerful application insights alongside your other data sources in Amazon Managed Grafana with our new plug-in.


