Operations | Monitoring | ITSM | DevOps | Cloud
January 2023
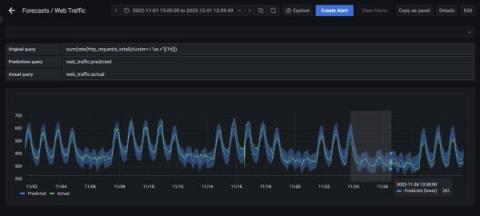
Rules backfilling via vmalert
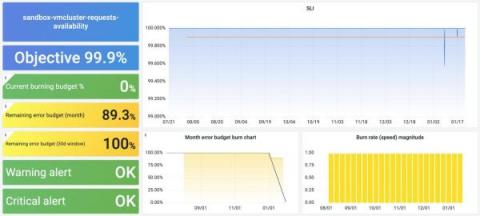
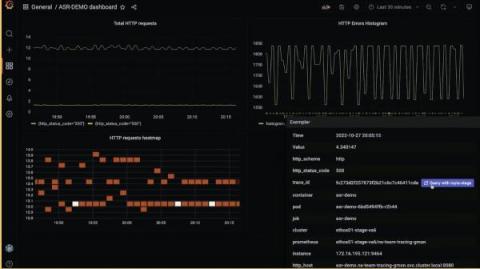
Recording rules is a clever concept introduced by Prometheus for storing results of query expressions in a form of a new time series. It is similar to materialized view and helps to speed up queries by using data pre-computed in advance instead of doing all the hard work on query time. Like materialized views, recording rules are extremely useful when user knows exactly what needs to be pre-computed. For example, a complex panel on Grafana dashboard or SLO objective.
The 2023 Network IT Management Report Part 1: Network Management Needs
Managing Observability Pipeline Chaos and the Bottomline
Your Data Just Got a Facelift: Introducing Honeycomb's Data Visualization Updates
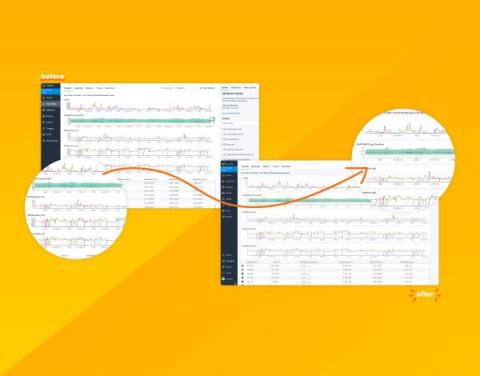
Data visualizations take complex information and present it in a clean and easy-to-understand visual. Done right, they can allow quick insight through easy pattern and outlier recognition. Done wrong, it can confuse, obfuscate, and lead to wrong conclusions. Yikes! Over the past few months, we've been hard at work modernizing Honeycomb’s data visualizations to address consistency issues, confusing displays, access to settings, and to improve their overall look and feel.
Private Status Page 101. Best Tools, Providers, and Cost
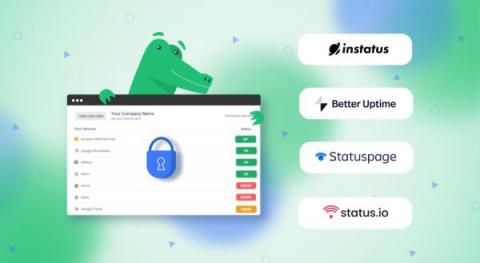
A private status page is a website or communication platform that provides status updates and notifications to a specific group of people rather than the general public. Private status pages are often used by companies to keep their employees, users, or partners informed about the status of their products, services, infrastructure, vendors, and providers.
Survey gives insight into new app security challenges
A security approach for the full application stack is now critical for technologists to manage rapidly expanding attack surfaces. Research published today by Cisco AppDynamics highlights the challenges that technologists in all sectors are facing as they try to manage application security across an ever more dynamic IT environment.
Creating and downloading zip files with ASP.NET Core
For a recent feature, I had to download a batch of files from an internal website written in ASP.NET Core. Zipping the files before downloading them, turned out as a great way of easily implementing multi-file download. .NET offers all of the needed features and in this post, I'll show you how to implement it. To get started, I'll create a new ASP.NET Core website: I'm picking the MVC template, but none of the zip-related code is specific to MVC.
Does Cloud Have a Storage Problem?
Too often, when organizations migrate workloads to the cloud or build new cloud-native applications, they don’t really think about storage. The cloud provider takes care of all that, right? Well, yes and no. There are cost implications to cloud storage that many don’t adequately anticipate—until they get the bill, that is.
Fintech APM: Considerations, Benefits, and Tools
In the last few years, fintech enterprises have disrupted the financial services and banking industry by taking everything computing technology offers – from machine learning to blockchain – and turning it up a notch. Traditional financial institutions must now compete with challenger banks offering electronic payment alternatives, peer-to-peer lending, and investment apps.
Complete Guide to Distributed Tracing with OpenTelemetry - Part II
Using AIOps for automation and efficiency in observability and IT operations
Artificial intelligence for IT Operations (or AIOps) has been playing an expanding role in helping SREs, DevOps, and developers effectively navigate the challenges around application and infrastructure complexity, pace of change, and data volume that characterize the operations landscape.
The Great Debate of 2023: Single Vendor vs Best of Breed Solutions
The debate between single vendor solutions and best of breed approaches has been ongoing for decades in the technology industry. Engineers have always sought out options and choice, and this has led to a shift in the dominance of large vendors in each stage of technological development. As soon as IBM sold enterprises the mainframe solution, engineers started to look for other options.
A beginner's guide to Kubernetes application monitoring
Application performance monitoring (APM) involves a mix of tools and practices to track specific performance metrics. Engineers use APM to monitor and maintain the health of their applications and ensure a better user experience. This is crucial to high quality architecture, development, and operations, but it can be difficult to achieve in Kubernetes since the container orchestration system doesn’t provide an easy way to monitor application data like it does for other cluster components.
Outages Happen. Now What?
Network outages happen more often than you think. We may not experience them directly or even know they're occurring at all. When outages affect household names like Facebook, Amazon, Microsoft, and others, however, we're sure to find out after the fact that there was an issue. Depending on the user's activities and the duration of the issue, stress and frustration levels can vary. When a marketer can’t get that ground-breaking advertisement up on Facebook, they can get antsy.
Webinar Recap: How Observability Impacts SRE, Development, and Security Teams
In today’s fast paced and constantly evolving digital landscape, observability has become a critical component of effective software development. Companies are relying more on and using machine and telemetry data to fix customer problems, refine software and applications, and enhance security. However, while more data has empowered teams with more insights, the value derived from that data isn’t keeping pace with this growth. So how can these teams derive more value from telemetry data?
Sumo Logic platform video
Datadog's commitment to OpenTelemetry and the open source community
The OpenTelemetry (OTel) project is an open source initiative with the goal of providing vendor-neutral standards and tools that enable users to collect telemetry from any source in their environment and send it to any backend. A core tenet of Datadog is to provide a single, unified platform for customers to easily collect and monitor all of their observability data, regardless of where it comes from.
Test Observability with Sumo Logic
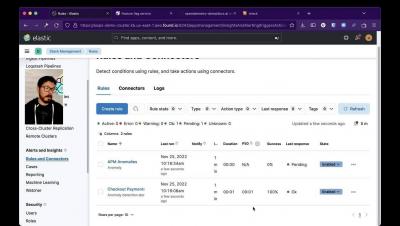
How to create data views and gain insights on Elastic
3 Key Questions to Ask Before Getting Started with Kubernetes
If you need to deploy a lot of microservices at once and manage them at scale, Kubernetes is hard to beat. But Kubernetes also brings additional complexity that you just might not need. You would be smart to ask yourself these three questions before getting started with Kubernetes.
The Right Time to Right-Size Your Observability Process
Every client we meet has been using multiple tools to satisfy their observability needs. We rarely find a greenfield opportunity. As their journey progresses, they have pointed out when the time is right to add ChaosSearch into the fold. There isn't just one symptom; it's usually a combination of things, including high log data volume, unpredictable costs, and ineffective results, to name a few. By the time we talk to clients in this state, the pain and frustration are incredibly high. We created a five-minute video to demonstrate how clients find themselves in this predicament.
How to Get Full Kubernetes Observability in Minutes
How is your organization handling Kubernetes observability? What tools are you using to monitor Kubernetes? Is it a time-consuming, manual process to collect, store and visualize your logging, metrics and tracing data? And, what are you actually getting out of all that investment? At Logz.io we’re trying to make this process easier for customers who are serious about Kubernetes observability. We’ve made significant investments in this area for Kubernetes use cases.
How Autodesk Streamlines Data Ingest to Deliver on Top 5 IT Initiatives
If you’ve been around the observability world for the past few years, you’ve probably heard a few stats around data growth. Worldwide, data is increasing at a 23% compound annual growth rate (CAGR), per IDC. That means in five years, organizations will be dealing with nearly three times the amount of data they have today – generated by diverse and emerging sources, from data centers to cloud sources to edge computing.
Everything You Should Know About Windows Event Logs
If you’ve ever seen Indiana Jones and the Last Crusade, you might remember the scene where Indy and his dad are in a room replete with the most ornate chalices possible, only to realize that the Holy Grail is the most plain, utilitarian one in the room. Windows event logs are the IT version of the plain-looking clay cup that holds the key to answering your service questions and system issues.
Monitoring Your NestJS Application with AppSignal
NestJS is a popular framework for Node.js that allows you to build efficient and scalable backend applications. With AppSignal, you can monitor your NestJS app with ease and rely on OpenTelemetry to handle third-party instrumentations. AppSignal even provides helper functions to help you build comprehensive custom instrumentations. This article aims to help you get the most out of your AppSignal integration.
Use library injection to auto-instrument and trace your Kubernetes applications with Datadog APM
Many organizations rely on distributed tracing in Datadog APM to gain end-to-end visibility into the performance of their Kubernetes applications. But as teams grow, it can become impractical for them to manually configure each new application with the libraries and environment variables needed for tracing.
Introducing: Monitoring and Troubleshooting for Google ChromeOS
What is New in Flowmon 12.2 and ADS 12.1
Our development teams continue to improve Progress Flowmon. The latest update takes the core Flowmon product to version 12.2, while our industry-leading Anomaly Detection System (ADS) gets incremented to ADS 12.1.
Network and Infrastructure Monitoring - Is Every Tool the Same?
Every organization reaches a certain size where network and infrastructure monitoring becomes a necessity. And while that “certain size” will depend on whether you’re running a private company, non-profit organization or government agency, the time to act always comes. Network and Infrastructure Monitoring tools enable organizations to harness greater benefits from their computing infrastructures. How you use these tools can even give you a competitive advantage.
Complete Guide to Distributed Tracing with OpenTelemetry - Part I
Install Sentry with a Single Command
We’re creating a new way to install and set up Sentry. Starting with Next.js, you’ll be able to set up new Sentry accounts or create new Sentry Next.js projects via the terminal and running a single command. Getting started is simple(r). While you can still visit sentry.io/signup to create an account or create a project from within the app – now you can skip all the clicks, navigate to your repo and run this command.
Observability to Modernize Apps and Increase Business Resilience
Increasingly, the speed and scale of a business can be measured by the resilience and performance of its applications. That’s why organizations are opting to modernize legacy applications by rewriting them using cloud-native tools and platforms. A Gartner study found that by 2025, cloud-native platforms will be the foundation for more than 95% of new digital initiatives, compared to less than 40% in 2021.
How to Perform Packet Loss Tests to Prevent Network Issues
Quarkus vs. Spring Boot
In modern application development and architecture, there has been a big push from monolithic, large applications that can do everything a product would need, to many smaller services that have a specific purpose. This onset has brought on the age of microservice frameworks (micro-frameworks), with the goal of making it easier to prototype, build, and design applications in this paradigm.
7 Open-Source Log Management Tools that you may consider in 2023
Five worthy reads: The future of work, metaverse style
Five worthy reads is a regular column on five noteworthy items we have discovered while researching trending and timeless topics. This week, we explore the impending impact of the metaverse on the future (or now) of work and productivity. Illustration by Akshaya Maheswaran Imagine a world where you can work from anywhere, collaborate with colleagues from around the globe, and attend meetings in virtual reality (VR) conference rooms.
Data Privacy Day: Understanding the Risks of Data Breaches and How to Protect Customer Data
Data Privacy Day is an annual event celebrated on January 28th to raise awareness about the importance of protecting personal information and data privacy. As technology continues to advance and more of our personal information is shared online, it’s crucial for businesses to take steps to safeguard their own data, as well as the data of the customers and users they serve.
What is API Monitoring?
The increasing complexity of modern websites and web applications means that a dependency on Application Programming Interfaces—or APIs—is unavoidable. APIs are used throughout software to define interactions between different software applications. They are also indispensable to businesses as they enable them to develop applications that can scale and provide a wealth of services without the need to build every software or server component from scratch.
BindPlane OP Overview
Distributed tracing in Kubernetes apps: What you need to know
Kubernetes makes it easier for businesses to automate software deployment and manage applications in the cloud at scale. However, if you’ve ever deployed a cloud native app, you know how difficult it can be to keep it healthy and predictable. DevOps teams and SREs often use distributed tracing to get the insights they need to learn about application health and performance.
Achieving Full Observability With Telemetry Data
In today's digital age, organizations increasingly depend on their technology infrastructure to keep their operations running smoothly. These infrastructures include servers, networking equipment, IoT devices, and applications. The data generated by all this infrastructure (logs, metrics, traces) is known as telemetry data, which has a tremendous potential value to organizations. However, it can be challenging to control telemetry data and utilize it effectively.
Monitor Boundary on the HashiCorp Cloud Platform with Datadog
HashiCorp Boundary provides a secure way to manage remote access to applications and infrastructure without exposing the underlying network or credentials. Launched two years ago as an open source solution, HashiCorp recently announced a fully managed version on the HashiCorp Cloud Platform (HCP), enabling you to manage identity-based authorizations, user and target onboarding, and more for dynamic environments.
Introduction to Splunk Log Observer
Session Replay Open Beta AMA
Mobile: The Future is Declarative | Snack of the Week
Elasticsearch Open Source Monitoring Tools [2023 Comparison]
This article is the third of a four-part series of articles about Elasticsearch monitoring. In the first article, we put together an Elasticsearch guide, covering how Elasticsearch works and why the setup and tuning of Elasticsearch requires a good knowledge of configuration options and performance metrics.
Unified event & alert visibility - across your entire technology stack
The Big SCOM Survey 2022 - 2023
The Big SCOM SURVEY is up and running viral again across the entire SCOM community. SCOM lovers of all regions and countries gather for this yearly event to share their perceptions, usage, and plans for Microsoft System Center Operations Manager. This year is the third round of the Big SCOM survey, conducted by SCOMathon, the learning and community hub for all SCOM-related topics.
Monitoring with Prometheus vs Grafana: understanding the difference
Using Logs to Troubleshoot Failing Cron Jobs
Let’s say you have a script that works when run in an interactive session, but does not produce expected results when run from cron. What could be the problem? Some potential culprits include: Or it could be something else. How to troubleshoot this then, and where to start? Instead of trying fixes at random, I prefer to start by looking at logs.
How Developers Use Observability Pipelines
In data management, numerous roles rely on and regularly use telemetry data. The developer is one of these roles. Developers are the creative masterminds behind the software applications and systems we use and enjoy today. From conception to finished product, they map out, build, test, and maintain software.
Top Features to Look for in a Website Monitoring Tool
You are looking for a website monitoring tool, but there are a vast array of options out there. Which are the important ones that actually help your website and team? What should you focus on to get the best one for you? In this article, we go over the top features that move the needle in serving your needs and why they are important.
Complement Your Cybersecurity Program with Real-Time IT Operations Monitoring
On October 3, 2022, the U.S. Cybersecurity & Infrastructure Security Agency (CISA) issued Binding Operational Directive (BOD) 23-01, Improving Asset Visibility and Vulnerability Detection on Federal Networks. The directive requires federal civilian executive branch (FCEB) agencies to deliver a series of procedures, reports, and process validations for continuous and comprehensive asset visibility by April 3, 2023. Thereafter, agencies must maintain compliance with the directive.
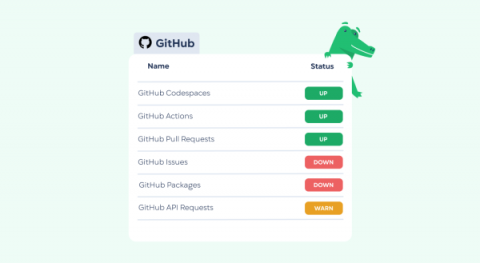
What Was the Least Reliable GitHub Feature in 2022
With over 83 million users, GitHub is one of the most popular development tools out there and the third most monitored service on StatusGator. Since so many users depend on GitHub, we wanted to analyze GitHub’s downtime over the past year and see which GitHub features (i.e., Codespaces, PRs, Actions, etc.) were the least reliable.
Microsoft Cloud Outage Causes Global Workforce Disruptions
Many of us (indeed 1 billion plus users worldwide) rely on Microsoft for essential work activities and were impacted yesterday (Wednesday January 25, 2023) when the cloud service provider experienced a prolonged outage. Internet Resilience is a business priority because when critical workforce services like Microsoft go down, global teams are hugely disrupted.
Surface and Confirm Buggy Patterns in Your Logs Without Slow Search
Incidents happen. What matters is how they’re handled. Most organizations have a strategy in place that starts with log searches—and logs/log searching are great, but log searching is also incredibly time consuming. Today, the goal is to get safer software out the door faster, and that means issues need to be discovered and resolved in the most efficient way possible.
Observability Innovation Report 2023
StackState commissioned Techstrong Research, a strategy and technology analyst firm, to delve into the current state of observability. The resulting report, “Observability Innovation Report 2023,” provides insightful information. 543 IT professionals were surveyed, globally, across 20 industries. The largest concentration of respondents were in the telecommunications, technology, Internet and electronics sectors, followed by financial services.
How to run your Playwright test in parallel or in serial mode
Learn how to use the common OpenTelemetry demo application with Sumo Logic
Kubernetes vs Mesos vs Swarm
Maximizing Value and Minimizing Costs: Insights and Next Steps for Effective Tool Deployment
Microsoft Outage on 25th Jan 2023 MO502273
Microsoft had its corporate earnings call yesterday and posted weaker guidance. But guess what? Several hours later, the tech giant was hit by a networking outage that took down Azure and other services like Teams and Outlook, affecting millions of users globally.
Applications Manager once again helps customers go beyond their limits
Reading case studies can be a tedious task for someone who needs to single-handedly manage the entire IT infrastructure of their firm. But hey, why not spend a minute or two if it can provide you some golden tips on how to save time while monitoring your complex IT infrastructures? Here are the stories of two firms that achieved improved performance after switching to Applications Manager. Dig in to learn how they made the best use of our product and achieved a better version of themselves.
40 most popular programming languages 2023: When and how to use them
Bad Observability
Observability has become a bit of a buzzword in the industry for the last few years. Exactly what "observability" means depends on who you ask, but most people would agree its about both: There's plenty of content out there telling you how to implement observability, or what good looks like. But what about bad observability? What are some anti-patterns to watch out for?
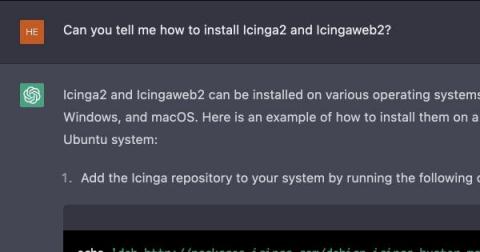
Using ChatGPT + Icinga?
The news have been full of coverage: ChatGPT (Generative Pre-trained Transformer), the prototype chatbot released by OpenAI in November 2022 seems to hail in a new era of information sourcing, schooling and learning, and interacting with a computer. The service sprinted to one million users in five days after the launch, with many more following until this date.
Reduce MTTR with Logz.io's Single-Pane-of-Glass Observability Data Analytics
Observability data provides the insights engineers need to make sense of increasingly complex cloud environments so they can improve the health, performance, and user experience of their systems. These insights can quickly answer business-critical questions like, “what is causing this latency in my front end?” Or, “why is my checkout service returning errors?” Observability is about accessing the right information at the right time to quickly answer these kinds of questions.
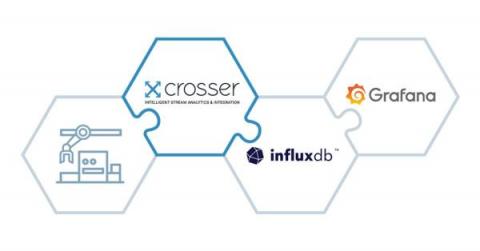
Easily Deploy Modern Digital Historian at Scale with Crosser, InfluxDB, and Grafana
Crosser is a Swedish company that builds a streaming analytics platform. The idea behind Crosser is to take the data from a connected, sensor-rich world and integrate it in real time to deliver faster insights and innovation. Primarily focused on the industrial IoT (IIoT) space, Crosser helps manufacturers gain insight into their machines and processes to drive improvements and to take advantage of newer trends and requirements that companies have for their data.
Basic Windows monitoring
Monitoring Kubernetes layers: Key metrics to know
Kubernetes monitoring can be difficult and complex. In order to determine the health of your project at every level, from the application to the operating system to the infrastructure, you need to monitor metrics in all the different layers and components — services, containers, pods, deployments, nodes, and clusters.
7 Powerful DevOps Tools You Should Know in 2023
Have you ever wished that software development could be faster and focused on quality? Then DevOps may be the answer for your organization. DevOps is a set of practices that combine software development and IT operations to facilitate collaboration between teams. The industry is constantly evolving, and new tools are being introduced daily. With so many options, it can take time to determine which ones are worth your time and money.
Did you Survive the Microsoft Outage Today?
The Situation: some employees are reporting that Microsoft Teams is not working properly. You wonder, is there a Microsoft outage today? You jump onto Twitter to check the Microsoft 365 status account and see a trail of updates regarding a Microsoft outage – ugh there is a lengthy Twitter thread. You are in the midst of managing a Microsoft outage today.
Ask Me Anything: Solving the Top 7 WhatsUp Gold Support Issues
Application Monitoring Using Open Source: Contrasting ClickHouse & VictoriaMetrics
Monitoring the Universe & Beyond: Our 2022 in Review
Share: When we posted our first ever Momentum blog about a year ago detailing our 2021 achievements, we were just weeks away from Russia’s renewed attack of Ukraine. While the war isn’t won yet and we’re approaching the one year anniversary of the attack, it’s heartening to see how much has changed around the world and that almost everyone now knows the expression: Slava Ukraini! So if we had to choose one word to best describe 2022 it might be: Resilience.
Wireless Troubleshooting Made Easy-How Wi-Fi Monitoring Helps
There is no question that wireless networks are taking over. Offices may still have Ethernet cables to each cubicle, but usually, they go unused. Wi-Fi is the new LAN. And so many devices, tablets, smartphones and even some laptop-type devices are now wireless only.
Enhance the value you get from native FinOps tools
The public cloud can deliver significant business value across infrastructure cost savings, team productivity, service elasticity, and DevOps agility. Yet, up to 70% of organizations regularly overspend in the cloud, minimizing the gap between cloud costs and the revenue cloud investments can drive.
Outgrown your ELK self-managed clusters and not sure what to do about it?
As data volume grows, managing your ELK stack can become resource-intensive. Organizations outgrowing ELK are often using multiple different tools, experiencing performance issues, paying too much in log storage, and spending significant time troubleshooting. But while the pain is real, many are hesitant to make a change. The thought of migration yields fears of lost productivity, performance and financial risks, and disappointment in losing some things you love that you worked hard to create.
Monitoring IGEL EUC Deployments End-to-End
eG Innovations is an IGEL Ready partner, and I’m delighted to let you all know that we are a silver sponsor at the IGEL DISRUPT End User Computing (EUC) Forum taking place in Munich, February 14-16, 2023. DISRUPT is a major global event focused on end user computing and the delivery of secure, high-performance digital workspaces to increasingly distributed hybrid workforces, from the cloud.
SAP HotNews automation and security
"How do we keep our data secure?" is the question nearly every organization is asking these days. The last spot any organization wants to be in is that of a security breach. Stephane Nappo, an industry known Chief Security officer, is often heard saying "It takes 20 years to build a reputation and a few minutes of cyber-incident to ruin it". And here he's just referencing the fall out of a business's image from a breach and not even touching on the mass harm that can be done with stolen data in the wrong hands.
4 Ways DEM Improves the Digital Employee Experience
If you have been following the news over the last few months, you will agree that the buzzwords for this year are – inflation and recession. Yet, even in these turbulent times, delivering an excellent digital employee experience (DEX) remains an essential aspect of IT. As organizations continue to add various collaboration, communication, and end-user technologies to the mix, new problems will surface.
Building, deploying and observing SDKs as a Service - Part 1
An API, or application programming interface, is a set of protocols and instructions that allows two software applications to communicate with one other. APIs can be implemented in a number of architectural styles. One of the most popular styles is REST (representational state transfer,) which allows server and client interaction in a stateless manner.
What is a Container Image?
Implement a Cloud Security Observability Strategy in 6 Steps
Moving to the cloud is hard. Moving to the cloud and keeping systems secure, data governed, compliances met, and cyberattacks at bay, makes everyone’s jobs significantly harder. The number one concern we hear from Cribl customers about the cloud is, you guessed it — security. If you’re in this boat — eager to adopt the cloud ASAP but also worried about the risks that come with having sensitive data in the cloud — don’t fret. We’re here to help.
Unsolicited Opinions About the Latest Forrester Wave on AIOps, Part 2 - A Closer Look Into the Evolution of AIOps
The True Cost of Switching to Auvik
CES EDGE23: Building a Culture of Change, Are You Willing & Able?
2023 started with a boost of positive energy after attending my first CES EDGE23 federal event sponsored by the GBEF (Government Business Executive Forum). As a sponsor of this year’s EDGE23 conference, I represented ScienceLogic as a co-moderator to a very relevant and thoughtful executive round table on navigating the challenges associated with ‘Continuous IT Modernization’.
Five eye-catching Grafana visualizations used by Energy Sciences Network to monitor network data
ESnet (Energy Sciences Network) is a high-performance network backbone built to support scientific research. Funded by the U.S. Department of Energy and part of Lawrence Berkeley National Laboratory, ESnet provides fast, reliable connections between national laboratories, supercomputing facilities, and scientific instruments around the globe. Our mission is to allow scientists to collaborate and perform research without worrying about distance or location.
Best Practices for Kubernetes Monitoring with Prometheus
Kubernetes has clearly established itself as one of the most influential technologies in the cloud applications and DevOps space. Its powerful flexibility and scalability have inarguably made it the most popular container orchestration platform in modern software development, helping teams manage hundreds of containers efficiently.
Easily analyze AWS VPC Flow Logs with Elastic Observability
Elastic Observability provides a full-stack observability solution, by supporting metrics, traces, and logs for applications and infrastructure. In a previous blog, I showed you how to monitor your AWS infrastructure running a three-tier application. Specifically we reviewed metrics ingest and analysis on Elastic Observability for EC2, VPC, ELB, and RDS.
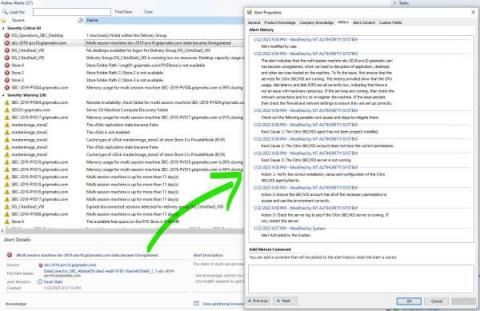
Automate & Visualize Your Citrix Environment
“Why is everything down?” Nod your head if you’ve had this experience. No changes were made, yet suddenly everything is down. Where do you start looking? If you’ve been in the EUC world long enough, you probably have a good idea. But what about those junior admins you are mentoring so that you can get some time back in your day?
On-premises to cloud: Observability for customers where they are and where they're going
Gain executive-level insights on Cisco AppDynamics’ for on-premises, hybrid and cloud customers from Ronak Desai, Cisco SVP & GM AppDynamics and full-stack observability.
Getting started with unified observability for Azure in less than 10 minutes using terraform
Honeycomb, Meet Terraform
Most SaaS products have nice, organic growth when they work well. Employees log in, they click around and make stuff, then they share links with others who do the same. After a few weeks or months, there are thousand of objects. Some are abandoned, and some are mission-critical. Different people also bring different perspectives, so they name things that are relevant to their role and position in the team, which may be confusing to others outside their realm.
How to Measure SLA: 4 Important Types of Metrics
An important part of the client-service provider relationship is a well-written Service Level Agreement (SLA). Most service providers and clients agree on this. What some service providers don’t know is exactly how they should measure SLA. There is often a lot of confusion between the SLA metrics that define contractual agreements and the wide range of key performance indicators (KPIs) you can also use to monitor operations. They are both important, but they are not the same.
Detect data exfiltration activity with Kibana's new integration
Does your organization’s data include sensitive information, like intellectual property or personally identifiable information (PII)? Do you want to protect your data from being stolen and sent (i.e., exfiltrated) to external web services? If the answer to these questions is yes, then Elastic’s Data Exfiltration Detection package can help you identify when critical enterprise data is being stolen and exfiltrated.
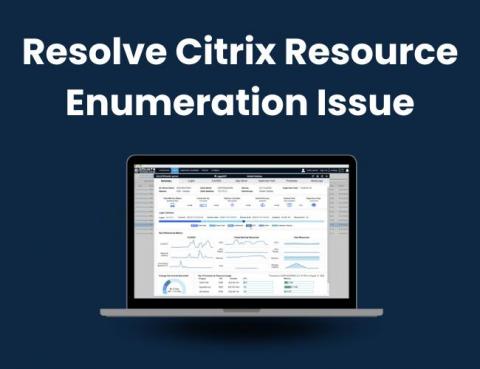
Resolve Citrix Resource Enumeration Issue
Citrix is a popular virtualization and remote access solution that allows users to access their applications and data from anywhere. However, like any technology, it is not without its issues. One common problem that users may encounter is the “resource enumeration” issue. Resource enumeration is a process that occurs when the Citrix server scans the network for available resources, such as printers, scanners, and other peripherals.
How a corrupted file took down 12,000 flights across the US: Real-world consequences of minor IT negligence
The airport is shutdown in the midst of a busy time, masses of people are stranded, pilots wait in the cockpit awaiting ground information, there’s confusion and panic among the crew. This could easily be a scene from Die Hard 2 where the villains take over an airport and seize control of all electrical equipment. But, hate to break it to you, this actually happened. Is it possible for one person to disrupt the entire nation’s aviation system? Apparently, yes.
Uptime monitoring: How to track your network availability, 24/7
How to use Kubernetes events for effective alerting and monitoring
Kubernetes, a graduated project of the Cloud Native Computing Foundation (CNCF) ecosystem, is the most prominent and widely used container orchestration systems. It’s used to manage and deploy containers in a wide range of environments, from IoT devices based on Raspberry Pis to enterprise environments consisting of millions of services.
7 Container Orchestration Tools for Managing Microservices Efficiently
When people hear ‘containers,’ they don’t immediately think about an IT solution that helps businesses create and distribute applications seamlessly. However, the container concept has been around for a long time, helping companies in various industries globally. Containers continue to change the landscape of app development and deployment. This guide below will help you understand containerization and the best orchestration tools to manage containers.
What is Observability Engineering all about? One minute overview.
SQL Server Timestamps: A Detailed Introduction
Accurate data is one of the most important aspects of any organizational function. It helps in decision-making and planning, and for most businesses, it also helps in generating revenue. The data can be anything from a list of clients and products to an inventory list. Nothing comes close to SQL timestamps regarding data accuracy, timeliness, and management. SQL Server timestamp is a critical component of relational databases, but they aren’t used on a daily basis by most database professionals.
Jack Henry Incorporates BubbleUp and Honeycomb's New Service Map to Quickly Debug Issues and Get Ahead of Customer Latency
Not long ago, we announced the launch of Honeycomb’s Service Map, a new feature that gives users the ability to get an overall, filterable view of their system and how everything is connected, along with some exciting new enhancements to BubbleUp. What’s the story behind these changes? They make it even easier for developers to zero-in on issues, even when they are hidden in billions of lines of code.
Applying Lessons Learned from Baking Pizza to Kubernetes Observability
Baking a delicious pizza in a wood-fired oven requires a combination of skill, experience and the right tools. The same is true for achieving optimal observability in a Kubernetes environment. In this post, we'll explore some of the lessons learned from baking pizza in a wood-fired oven and apply them to the world of Kubernetes observability.
Getting Started with Cribl Stream: Your First Hundred Days
Congratulations, you’ve worked hard to get Cribl Stream into your technology stack. Buying a new tool is a non-trivial task, so be sure to pat yourself on the back. Now the work starts: You have to deploy Stream and get full value to justify the cost. It’s critical to get started with the right plan to accelerate delivery and maximize the value of Stream. I’m going to start by sharing some ideas about how to get started with Cribl Stream in your first hundred days.
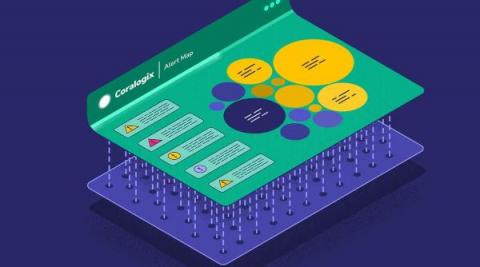
Thousands of Insights at a Glance With Coralogix Alert Map
An effective alerting strategy is the difference between reacting to an outage and stopping it before it starts. That’s why at Coralogix, we’re constantly releasing new features that redefine how alerts are consumed, to enable teams to push their ambitions even further, release with confidence, and tackle issues proactively. Alerts Map is now an indispensable tool for that mission.
Coralogix Feature Overview: AlertMap
Using the RUM HTTP Traces App for Manual Testing
Hosted StatsD vs. StatsD
When you are designing and building applications, you should consider how to monitor them once they become live. You do not want to be blindsided by errors and degrading performances as you operate them. When your applications fail to provide optimal performance, it can broadly impact your business. Engineers will often be distracted to investigate and fix the issues. Customers will complain. It can eventually hit your bottom line.
Common Errors in Next.js and How to Resolve Them
Bugs are one of the most troubling aspects of software development; they appear out of nowhere and cause everything to stop working. Most of the time, they can be resolved quickly; however, others can be gruesome and take hours/days to fix. Next.js is one of the most popular web development frameworks in the current world, and as a programming tool, it didn’t escape the bug dilemma either.
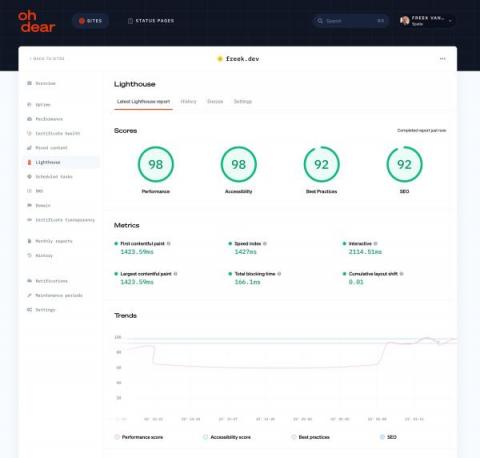
Lighthouse SEO monitoring is now available at Oh Dear
We're proud to announce we have added a new check to our service: Lighthouse SEO. Using this check you can detect (and get solution suggestions) for SEO and performance problems.
Cloud Cost Optimization: 5 best practices for reducing your cloud bills
Before we jump into cloud cost optimization, let us address the elephant in the room. Businesses are moving to the cloud but are struggling with unpredictable cloud bills. If you are a business owner who has moved to the cloud recently, you need to understand each cloud touchpoint and get a transparent view of your cloud services. When it comes to cloud cost optimization, there are many tools and techniques that organizations can adopt. Most of these can only take you so far.
The Life of the Sysadmin: A Patch Tuesday Story
The System Administrator! AKA the Sysadmin. The keeper of the network, computers – well basically all things technology. The one who is hated for imposing complex passwords and other restrictions, but taken for granted when everything works well. They are the first to be called when “facebuuk.com” reports: “domain does not exist”.
Network Fault Management and Monitoring: Definition, Benefits, and Guide
Can companies afford to have network breakdowns or downtime in this digital-first era? No, they can't. With digital transformation taking place across industries and increasing expectations to stay connected wherever you are, companies need to up their game and ensure they provide uninterrupted network services and high performance. Therefore, understanding network fault management and monitoring - what they are, and the benefits of using a fault management system can help you manage your network more effectively.
Grafana vs. Power BI vs SquaredUp
You’re part of a data-driven engineering team. You have a rich, complex, and dynamic set of tools but you’re struggling to discover and share insights from all that data. So, you're looking for a platform that will help unify it all. Naturally, you want to compare Grafana vs. Power BI - the big names. Plus, there's a new player on the block - SquaredUp.
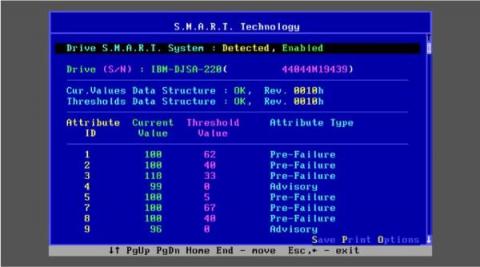
How to monitor and troubleshoot S.M.A.R.T. attributes
Understand what makes a storage device S.M.A.R.T and how to monitor a self monitoring component using Netdata.
How to monitor and troubleshoot BIND 9
Find out how to effectively and easily monitor and troubleshoot BIND 9 using Netdata.
Observability vs Monitoring vs Telemetry: Understanding the Key Differences
Observability, monitoring, and telemetry are crucial for maintaining the performance and reliability of modern systems. Their concepts are often used interchangeably, but they have distinct differences that are important to understand. In this blog, we’ll explore each concept in detail, including key characteristics and examples of tools. We’ll also compare observability vs monitoring vs telemetry and discuss when it’s appropriate to use each.
FluentD vs FluentBit - Which log collector to choose?
How Solutia Consulting Cut a Client's Technical Support Tickets by 50% Using Advanced Synthetic Monitoring from Checkly
Learn how Solutia Consulting relied on Checkly to confidently deploy client software updates Solutia Consulting is an information technology consulting firm based in Minneapolis / St. Paul, Minnesota. Solutia provides assessment and advisory services, dev team staff augmentation, managed IT services, and project-based contract work for a variety of clients, ranging from Fortune 500 companies to mid-sized enterprises and organizations.
Vantage DX Product Updates
The upcoming release of Vantage DX packs in more usability features to help IT teams quickly get to the root of Teams performance issues. Our recently launched Teams dashboards have been updated and UI improvements now provide quick access to Teams Meeting Room performance data and new Microsoft Call Quality Dashboard (CQD) integration upgrades simplify set up.
Best SRE Practices to Help Developers Troubleshoot Kubernetes
SCOM integration with OpenAI Chat GPT
We are happy to announce that we have created a SCOM integration with OpenAI Chat GPT. The solution checks for any alert generated in SCOM and then requests the artificial intelligence service to give you possible root causes and fixes to solve the issue. Moreover, it will take into account any other issues the respective degraded component or service is experiencing and consult you accordingly.
[Sensu Go Workshop] Lesson 5: Introduction to Events
Splunk Monitoring: What is it and How Can You Use it?
Over the last couple of years, there has been exponential growth in the volume and variety of machine data. The main reason has been the ever-growing number of connected machines in IT infrastructure, the sophistication of data algorithms, and the increased use of IoT devices. This data has proven to be quite valuable - even necessary - as an organisation can analyse and use it to drive productivity, improve efficiency, and gain visibility for their business. There is a catch: to make the machine data work for them, organisations need a simplified tool that can analyse and visualise. This is where Splunk comes in.
Log Analytics in Cloud Logging is now GA
Cloud Logging’s Log Analytics, with advanced search, as well as aggregation and transformation of all log data types, is now generally available.
How to Perform a Network Audit
Five ways to strengthen your security posture before high-incident seasons
Here are five ways to protect your organization from cybersecurity attacks and vulnerabilities during high-incident seasons. With the busy holiday season over, is it safe to let your guard down concerning cybersecurity? Not exactly. While the holiday season is often seen as prime time for cyberattacks, it’s not the only time of year organizations experience a surge in cyber threats.
Return On Investment Website Revenue Calculator
The world of the ecommere is full of narrow margins and high risk. Prioritisation means focussing on one thing means skipping or delaying something else. When speaking to ecommerce management teams a frequent topic of conversation is finding budget for site improvements. Everyone wants to have a reliable, fast website – but how can you justify the time and energy it takes to create one?
How to monitor and troubleshoot Memcached
Find out how to effectively and easily monitor and troubleshoot Memcached using Netdata.
Why metrics, logs, and traces aren't enough
Unlock the full potential of your observability stack with continuous profiling Identifying performance bottlenecks and wasteful computations can be a complex and challenging task, particularly in modern cloud-native environments. As the complexity of cloud-native environments increases, so does the need for effective observability solutions.
ScienceLogic Product Tours: Seeing ScienceLogic AIOps in Action
Now you can experience our products—without scheduling a live demo or free trial. The ScienceLogic product tours are designed to give you a self-service ScienceLogic experience, so you can see for yourself first-hand how our AIOps & Observability solutions can help solve your organization’s hardest challenges.
How Much Does That Minute Cost?
Network outages are both common and expensive – usually far more expensive than people realize. Yes, the network is down and the organization is losing money, but do you really appreciate how much money? And how much an outage can actually cost on a per minute basis? It’s not only more than most people think, it’s something that can be mitigated fairly easily.
Learn How to Streamline Endpoint Data Collection and Send it to Grafana Cloud for Monitoring with Cribl Edge
You’re responsible for administering hundreds to thousands of server endpoints deployed at your company. You receive daily requests from the application teams requiring agents be installed on new servers, from the compliance team tracking agent upgrades and from the operations team concerned logs and metrics are missing from the dashboards they’re monitoring. You review your workload and realize you must log into each individual server for every request you’ve received.
The Complete Guide to Server Monitoring and How It Can Help You Save Money
Most people are unaware of the “full stack” in web development that includes the front-end user interface, middleware servers, and backend database. Casual technology users around the world usually only experience the front end, which renders the cute graphics and friendly colors your brain enjoys seeing as you browse, shop, and comment on social media.
Leveraging Embedded Intelligence and Automation to Augment Your Citrix Expertise
What’s your least favorite thing as an IT professional to hear when you first stroll into the office in the morning? I’m going to go out on a limb and guess that, like me, many of you might say something like this: “Everything is slow….” Ughhhhhhh, if we had a dime for every time we’ve heard end users utter that vague and unhelpful statement over our careers, we’d have a boatload of dimes. Across IT roles, this tiring theme seems to follow us wherever we go.
Guided Kubernetes Troubleshooting: How to Reduce Toil for Dev Teams
This blog post is a how-to guide for Kubernetes troubleshooting. Our vision is that any engineer can keep Kubernetes-based applications up and running smoothly, regardless of their level of Kubernetes expertise and their knowledge of the services in the environment. Right out of the box, StackState aims to monitor, alert and then guide an engineer directly to the problem, helping them remediate the issue quickly.
Advocacy and Closing Sales Through Harry Potter
Citrix Latency: Why it Matters and How to Improve it?
Are Citrix latency causing issues for your end users? Pin-pointing the root-cause of latency can be a challenge because it can occur in any part of the network and in any tier. Knowing where to start troubleshooting can mean the difference between end-users not noticing and a flood of support tickets on the service desk. In this guide I teamed up with eG Innovations to talk about what Citrix latency is, why it matters, and how we can improve it.
How to monitor Kubernetes clusters with the Prometheus Operator
Kubernetes has become the preferred tool for DevOps engineers to deploy and manage containerized applications on one or multiple servers. These compute nodes are also known as clusters, and their performance is crucial to the success of an application. If a Kubernetes cluster isn’t performing optimally, the application’s availability and performance will suffer, leading to unhappy users and even revenue loss.
Single Vendor vs Best of Breed Solutions: A Livestream Debate on 2023 Trends
Monitoring vCenter High Availability
vCenter High Availability (vCenter HA) protects against vCenter Server application failures. Using automated failover from active to passive, vCenter HA supports high availability with minimal downtime.
Want to keep your employees satisfied? UEM shows you the way
If we look at the last decade, organizations are increasingly championing the movement of employee satisfaction. Customer satisfaction, of course, is one of the quintessential factors for any enterprise to be successful. However, in recent times, enterprises have realized that employee satisfaction is an enabler of customer satisfaction and business success. With the onset of hybrid work models, UEM solutions are more centred towards employee enablement.
Raygun names Lana Vaughan as co-founder
Website downtime and ways to prevent it from happening
Reliability and SRE in the 2022 State of DevOps Report
Learn more about the connection between SRE, DevOps and reliability.
SRE Trends from AWS re:Invent 2022
In November/December 2022 I attended AWS re:Invent in Las Vegas. It was certainly an experience for this small town kid from New Zealand, and one that I took a lot away from. While I was at the conference, I took the time to walk around and take notes. In this article I will share the trends that I observed which I think will have an impact on SRE work in 2023 and beyond, including: ...and others.
How to use Quick Actions in Sematext | Sematext Cloud Monitoring
Monitoring AWS DynamoDB performance and latency
Amazon DynamoDB is a fully managed NoSQL database service provided by AWS and is tailor-made for serverless applications. As a fully managed service, we don’t have to worry about operational tasks with DynamoDB, such as hardware provisioning, configuring instances, scaling, replications, software patching, etc.
How to monitor and troubleshoot NTPdaemon
Find out how to effectively and easily monitor and troubleshoot NTPdaemon using Netdata.
It's time to rethink your approach to SAP monitoring
SAP, the world’s leading enterprise resource planning (ERP) system, is widely used by organizations across the globe. Since its inception in the 1970s, SAP has become the top choice for supporting the most critical and deeply integrated enterprise applications. In fact, IDC notes that SAP is a market share leader in analytics and business intelligence, ERP and supply chain management.
How Grafana Labs unlocks the power of recruitment data with Grafana dashboards
As the recruitment team here at Grafana Labs, we used to struggle to get a comprehensive view of our recruitment data. We had multiple sources of information, but it was difficult to pool that information so we could see the big picture and identify trends and patterns that could help us hire the right talent in a highly competitive market.
Python Time Series Forecasting Tutorial
This article was originally published in The New Stack and is reposted here with permission. A consequence of living in a rapidly changing society is that the state of all systems changes just as rapidly, and with that comes inconsistencies in operations. But what if you could foresee these inconsistencies? What if you could take a peek into the future? This is where time-series data can help.
What You Need to Know About ITIL for Service Management
As the person on the front lines, you know that providing the best service possible can be what makes your ITSM organization succeed. Every day, you work to build the relationships that help your organization create value for end-users. However, when you have inefficient processes, you end up having to be the person responding to an upset user.
Counting Forest Fires
If you were asked to evaluate how good crews were at fighting forest fires, what metric would you use? Would you consider it a regression on your firefighters’ part if you had more fires this year than the last? Would the size and impact of a forest fire be a measure of their success? Would you look for the cause—such as a person lighting it, an environmental factor, etc—and act on it? Chances are that yes, that’s what you’d do.
Scout APM: Reasons to Get a New Dog
Veteran programmer? Experienced application performance monitoring (APM) connoisseur? Whatever your specific tech chops, you know the importance of ensuring your applications are running optimally. Every minute a business app is down or slow to respond translates into lost revenue and frustrated customers. That’s why smart businesses rely on APM solutions to monitor and analyze their applications’ performance in real-time.
Looking at the Crystal ball for 2023!
Leveraging the Security Event widget within AppDynamics
Understanding the Advantages of Flow Sampling: Maximizing Efficiency without Breaking the Bank
The whole point of our beloved networks is to deliver applications and services to real people sitting at computers. So, as network engineers, monitoring the performance and efficiency of our networks is a crucial part of our job. Flow data, in particular, is a powerful tool that provides valuable insights into what’s happening in our networks for ongoing monitoring and troubleshooting poor-performing applications.
Discover the new Pandora FMS inventory
How to get started with Sentry's Unity SDK - Part 1
User experience and performance are two of the most important metrics of any game. You need to ensure that it runs as optimally as possible on any platform. Ideally, you don’t want to wait for players to angrily tell you something is not working or worse, broken. In a perfect world you’d get notified about any issues that arise in your game with as much context surrounding the issue as possible.
Using distributed tracing to identify bottlenecks in your app flows
As an engineer building a distributed application, every now and then I need to look for and analyze bottlenecks in our system. There can be several triggers for conducting a bottleneck analysis, for example: In this blog post I’ll share how I’ve been using our own product, Helios, and the power of distributed tracing, to help pinpoint bottlenecks in our system and resolve them fast.
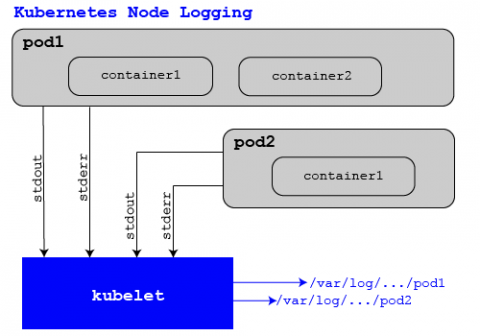
Logging and monitoring Kubernetes
Global Health Institute Swiss TPH trusts in Icinga
We’re proud of our many customers and users around the globe that trust Icinga for critical IT infrastructure monitoring. That’s why we’re now showcasing some of these enterprises with their Success stories. It’s stories from companies or organizations just like yours, of any size and different kinds of industries. Some of them are our long-standing customers, others have just recently profited from migrating from another solution to Icinga.
3 Website Reliability Metrics Councils Should Be Measuring
There are high expectations from users for council websites to be up and reliable. They are also required to adhere to guidelines set out in the Service Standard to make their website accessible and user friendly. Alongside these challenges, councils are often underfunded and understaffed which can make council web management teams stretched. Here are three key metrics that councils should be measuring to improve website reliability.
Interlink Software arrives on the Cisco AppDynamics Marketplace!
We are delighted to share the news that our integration with leading, real-time Application Performance Monitoring (APM) vendor Cisco AppDynamics is now listed on the AppDynamics Marketplace.
What Is Observability?
Logs vs Metrics: Pros, Cons & When to Use Which
As we at Splunk accelerate our cloud journey, we’re often faced with the decision of when to use logs vs metrics — a decision many in IT face. On the surface, one can do a lot by just observing logs and events. In fact, in the early days of Splunk Cloud, this is exactly how we observed everything. As we continue to grow, however, we find ourselves using a combination of both. This post lays out the overall difference in logs and metrics and when to best utilize each.
How to monitor and troubleshoot MongoDB
Find out how to effectively and easily monitor and troubleshoot MongoDB using Netdata.
4 Causes of Website Downtime and How to Monitor Them
A lot of site owners underestimate the consequences of downtime, assuming that a brief outage won’t do much harm to their business. But this can leave them with broken web pages that are either poorly rendered or filled with bugs, frustrating users into hitting the “back” button since they can’t navigate the site. The truth is, keeping outages at bay beats fixing them after the fact, even with a guaranteed backup plan.
Splunk Data Insider: What is Observability?
Business Continuity vs. Business Resilience: Comparing Strategies for Staying Resilient
If there is one thing organizations can take away from the past few years, it's that they are far more vulnerable than they could realize before. From pandemics to critical supply shortages to widespread data breaches and natural disasters, businesses that don’t have plans in place to handle and respond to emergencies are at tremendous risk. As leaders plan for inevitable crises and disruption, interest in business resilience and continuity grows.
Held for Ransom - Ransomware Detection & Response with Flowmon ADS
An Introduction to AWS Monitoring with Prometheus and Logz.io
Prometheus is a widely utilized time-series database for monitoring the health and performance of AWS infrastructure. With its ecosystem of data collection, storage, alerting, and analysis capabilities, among others, the open source tool set offers a complete package of monitoring solutions. Prometheus is ideal for scraping metrics from cloud-native services, storing the data for analysis, and monitoring the data with alerts.
Routing Strategies for Security and Observability Data: How to Make the Most of Your Data at Scale
Data routing is a crucial but complex task for companies of all sizes. Ensuring that the right data is sent to the right tools can be a time-consuming and difficult process, and when things go wrong, it can have costly consequences. This is why having a robust data routing strategy is essential for any organization.
Optimize Application Performance with Code Profiling
When monitoring your application performance or troubleshooting an issue in production, context is key. The more information available, the faster the prevention of or detection of a user impacting issue. Observability tools offer many different features, like code profiling, to help contextualize your data. In this post, I’ll discuss what code profiling is and show an example of how it works.
A Complete Guide to Google's Core Web Vitals and How to Optimize Them
The success of your website lies in how satisfied your users are with it. To help ensure the quality of your user experience, Google uses various signals from a web page. The three Core Web Vitals are some of the most important ones. In this article, I’ll talk about what each Core Web Vital means and how to optimize them to deliver a better user experience.
NiCE Oracle Management Pack 5.3 released
Oracle is a highly performant and reliable multi-model database management system running online transaction processing, data warehousing, and mixed database workloads. Although Oracle environments are reliable and performant, monitoring dedicated Oracle on-premise or cloud deployments is crucial to safeguard business continuity.
Monitoring benchmark: how to generate 100 million samples/s of production-like data
Share: One of the latest benchmarks we did was for OSMC 2022 talk VictoriaMetrics: scaling to 100 million metrics per second - see the video and slides. While the fact that VictoriaMetrics can handle data ingestion rate at 100 million samples per second for one billion of active time series is newsworthy on its own, the benchmark tool used to generate that kind of load is usually overlooked. This blog post explains the challenges of scaling the prometheus-benchmark tool for generating such a load.
How to Monitor Distributed Networks
Dashboard Fridays: Sample Kubernetes dashboard
Get High-Performance, Enterprise-Class Observability With Sensu Go
Sensu offers a complete solution for infrastructure monitoring and observability, designed to give you visibility into all of your important infrastructure components, including containers, applications, traditional server closets, and the cloud. Sensu Go is a commercial product based on an open source core that is freely available under a permissive MIT License and publicly available on GitHub.
All About Solr Replica Placement Plugins
With Solr 9 the Autoscaling Framework was removed – for being too complex and not terribly reliable – and instead we have Replica Placement Plugins. Unlike Autoscaling, replica placement only happens when you create a collection or add a new replica. Hence the name: it’s about where to place these new replicas. In this article, we’ll look at the available replica placement plugins, what you can use them for and how to use them.
Apica Quick Guides - Memu Player Setup for ZebraTester Recording
High Performance Images: 2024 Guide
IT Workflow Explanation
10 Points of consideration for investing in an Observability Platform for your organization.
2023: Looking both ways...
As a small business, we at Monitive understand the importance of being mindful of both the past and the future. We've been in the uptime monitoring business for almost 13 years now and we are proud to say that in 2022, we had a decent financial performance. As we value transparency and honesty above all else, we're excited to share our accomplishments with you and also talk about our plans for 2023.
Cultural drivers of DevOps success
Learn more about how culture is the true driver of DevOps success.
Maximizing Efficiency: How Application Performance Management (APM) Can Help You Cut Server Costs
With server costs mounting due to both demand and complexity, businesses of all sizes are beginning to explore how they can optimize their server infrastructure to reduce costs. One of the most effective strategies for doing this is Application Performance Monitoring (APM): the use of a dedicated tool to proactively monitor, diagnose, and troubleshoot performance issues in real-time.
Apache Arrow Basics: Coding with Apache Arrow Python
So by now, you are probably aware that InfluxData has been busy building the next generation of the InfluxDB storage engine. If you dig a little deeper, you will start to uncover some concepts that might be foreign to you: These open-source projects are some of the core building blocks that make up the new storage engine. For the most part, you won’t need to worry about what’s under the hood.
Progress Flowmon Ranked as a Technology Leader in SPARK Matrix 2022 NDR Report
The threat landscape that organizations faced in 2022 and continue to face in 2023 is large, complex, and continuously changing. Defense requires a multi-layered approach that delivers monitoring, detection, and response at many points within on-premise and cloud-based infrastructure and systems. A Network Detection and Response (NDR) solution is critical to a modern cybersecurity defense strategy.
How Healthchecks Sends Signal Notifications
When a cron job does not run on time, Healthchecks can notify you using various methods. One of the supported methods is Signal messages. Signal is an end-to-end encrypted messenger app run by a non-profit Signal Foundation. Signal’s mobile client, desktop client, and server are free and open-source software (with some exceptions–read on!).
Dashboard Fridays: Sample Azure Monitor Dashboard
Dashboard Fridays: Sample Kubernetes dashboard
Reduce mean time to hello world with OpenTelemetry, Grafana Mimir, Grafana Tempo, and Grafana: Inside Adobe's observability stack
How is Grafana like an invisibility cloak? At Adobe, it’s one of just four tools they’re using to build observability directly into their CI/CD pipeline, making it essentially invisible — but nonetheless impactful — to thousands of developers across the organization who use it in their day-to-day lives.
Cuba and the Geopolitics of Submarine Cables
This week marks a decade since the ALBA-1 submarine cable began carrying traffic between Cuba and the global internet. On 20 January 2013, I published the first evidence of this historic subsea cable activation which enabled Cuba to finally break its dependence on geostationary satellite service for the country’s international connectivity. ALBA-1 was one of my first lessons on how geopolitics can shape the physical internet.
Authors' Cut Spark Notes Edition: Jumpstart Your Observability Journey
Whether you’ve been following along with our Authors’ Cut series or doing some self-paced learning, our O’Reilly book Observability Engineering is one of the best resources for jumpstarting your observability journey. It serves as a blueprint to help you understand and map out the technical and cultural requirements of implementing observability into your organization.
Driving Microsoft Teams Into Your Business Apps with Azure Communication Services
PowerApps is something of a revolution in the making – and Microsoft is keen to promote it for enterprises everywhere. Being able to create your own apps to serve specific business functions is a huge win for any company looking to drive efficiency. And now with Azure Communication Services (ACS), you can even integrate Teams features in your apps.
Everything You Need To Know About a Microsoft Teams Outage
It’s a red alert for any IT team. Hearing the words “Microsoft Teams is down” can scare even the most experienced tech department. But, with a few clear definitions – and a way to spot outages and solve them – you’ll be well on your way to having a Microsoft Teams outage totally under control. Your organization now relies on Teams for nearly every aspect of business communication and collaboration.
Techstrong TV Interview: Toffer Winslow Talks Observability
MetricFire in 2023
As we welcome a new year, many people set goals, refresh their schedules, and look forward to making the most of 2023. At Metricfire, we think it’s important to reflect on the past and plan for the future. So we’re looking forward to creating goals for our company while sticking to our core values. In this article, we’ll briefly cover some of our company goals for 2023, specifically for our culture, our roadmap, and our growth as a company.
Audit day based logon errors: ADAudit Plus User Logon report
ManageEngine ADAudit Plus is a real-time change auditing and reporting software that fortifies your Active Directory (AD) security infrastructure. With over 250 built-in reports, it provides you with granular insights into what’s happening within your AD, such as all changes made to objects and their attributes. This can include changes to users, computers, groups, network shares, and more.
What's in Store for NetOps in 2023?
There are many factors making networking both more complicated and more critical than ever. The advent of cloud infrastructure, web-based applications, and increasingly diverse network environments demand a new approach to network operations, or NetOps, as it’s referred to in the industry. Networks are bigger than ever: they now connect everything ranging from automobiles to cloud servers.
Top 5 Web Monitoring Services of 2022
Want to find the best web monitoring service? You’ve come to the right place. There is no one-size-fits-all monitoring service for every business, so it’s important to do your research and see all the options you have. The worst part about that? You have to do the research with your precious time. The good news? We’ve done the research so you can have a place to start in your journey. Determining the best web monitoring services requires research into important factors.
Parsing and enriching log data for troubleshooting in Elastic Observability
In an earlier blog post, Log monitoring and unstructured log data, moving beyond tail -f, we talked about collecting and working with unstructured log data. We learned that it’s very easy to add data to the Elastic Stack. So far the only parsing we did was to extract the timestamp from this data, so older data gets backfilled correctly. We also talked about searching this unstructured data toward the end of the blog.
Combining APM and RUM to Improve Your User Experience
Providing an intuitive user experience that caters to your audience’s needs is essential for your business. By combining APM and RUM, you can help eliminate application issues and give your users a seamless experience. Combining APM and RUM helps you look at both the front-end and back-end of your application, find and fix issues. Don’t quite know what APM and RUM are? Let’s take a closer look.
Trust Me - I'm a SASE Solution
As we get ready to wish the term SASE a happy 4th birthday, it seems odd that there is still a great deal of confusion in the market about what SASE really is and how it relates to a ‘Zero Trust’ architecture. For many, SASE is a framework for secure network design; for others, it’s seen more as an architectural approach to delivering Zero Trust. So why do we have this confusion when Gartner defined SASE back in 2019?
30+ Top Observability Tools to Monitor Websites and Applications
By incorporating observability into your stack, you can better understand how your complex infrastructure operates, reduce downtime, and empower developers to quickly identify and fix problems. However, it now takes considerably more work, time, and money to build up observability for your infrastructure and applications. Over half of the firms polled employ eight or more observability solutions, according to a 2022 Splunk survey.
AIOps Essentials: What is AIOps? | AIOps Use Cases with Elastic Observability (1/5)
AIOps Essentials: How to Reduce Noise in Ingested Telemetry on Elastic | AIOps Use Cases (2/5)
AIOps Essentials: Issue Detection using Anomaly Detection on top of APM | AIOps Use Cases (3/5)
AIOps Essentials: How to use Distributed Tracing for Root Cause Analysis | AIOps Use Cases (4/5)
AIOps Essentials: Automating actions from AIOps analysis | AIOps Use Cases (5/5)
Unsolicited Opinions About the Latest Forrester Wave on AIOps, Part 1
Automating Root Cause Analysis with AIOps
A lot is expected of automation in IT environments in the next few years. By 2024 Gartner predicts IT automation will drive a 20% reduction in unplanned downtime and lower operational costs by 30%. At the same time, the efficiencies generated by IT automation and analytics will allow organizations to refocus 30% of their IT operations management resources from support to “continuous engineering.”
Why DevOps needs an AIOps approach?
How to Deploy a Cribl Stream Leader, Cribl Stream Worker, and Redis Containers via Docker
As mentioned in our documentation, Cribl Stream is built on a shared-nothing architecture. Each Worker Node and its processes operate separately and independently. This means that the state is not shared across processes or nodes.This means that if we have a large data set we need to access across all worker processes, we have to get creative. There are two main ways of doing this: In this blog, we’ll walk through how to deploy a Stream leader, Stream worker, and Redis containers via Docker.
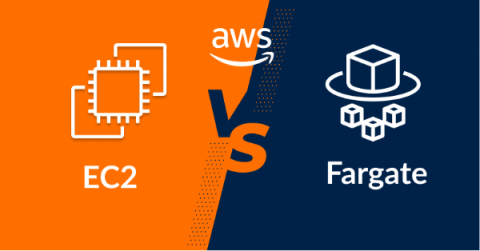
Comparing Amazon ECS launch types: EC2 vs. Fargate
Amazon Elastic Container Service (ECS) is a fully managed container orchestration service that enables users to easily run, manage and scale containers on AWS. With ECS, you can deploy containers either on a cluster of Amazon EC2 instances or on AWS Fargate, a serverless computing engine for containers. In this article, we’ll look at how these two launch types compare and explore how to start using them.
Reuse Playwright Code across Files and Tests with Fixtures
How to Troubleshoot Slow Services in Your Kubernetes Cluster
To get the best performance out of your Kubernetes cluster, SREs and software engineers must have enough knowledge and instruments to find misconfiguration and bottlenecks. At the same time, thanks to Kubernetes’ ever-growing popularity, there is a global shortage of expertise on the platform.
Your PKI infrastructure is worthless if ...
A common mistake IT organizations make, is having a well-designed Public Key Infrastructure (PKI), but at the same time having client devices, such as monitoring agents for your Citrix NetScalers, which accept to set up any encrypted connection, to any device, no matter what certificate they are presenting. In this case, you basically allow connections to be made to devices you do not know whether they can be trusted. This makes you vulnerable for 'spoofing'.
2 Steps Demo v8
Top 10 Best Website Monitoring Tools [2023 Update]
Nothing is more important than a healthy, functioning website. It is essential to monitor your website to make sure it remains functioning, fast, and available to your customers. For example, imagine your website goes down and you aren’t aware of it for another hour. How much business could you lose in that time? Or worse, what long-term damage could it do to your brand reputation?
A practical guide for implementing SLO
How to set Service Level Objectives with 3 steps guide.
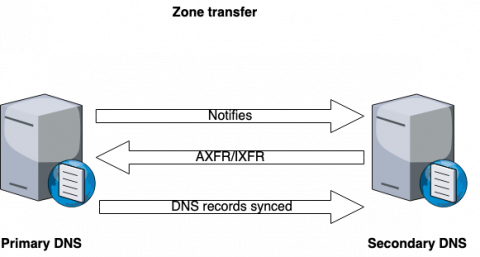
DNS redundancy: What are secondary DNSs and zone transfers?
The primary DNS server hosting a zone or multiple zones acts as an authoritative DNS through which DNS administrators manage zone files and perform DNS changes like adding, deleting, and updating DNS records.
Catchpoint Announces the World's First Complete Solution to Monitor and Protect the Internet's Leading Companies from BGP Incidents in Seconds
Docker Monitoring Tutorial - How to Monitor Docker with Telegraf and InfluxDB
This article was priginally published on the CNF blog and is written by Cameron Pavey. Scroll down for the author’s bio. Docker is an increasingly popular choice for businesses dealing with containerized applications. However, as with any new technology, Docker introduces complexities that need to be managed. Some of these complexities relate to infrastructure and application monitoring.
Why You Need an Integrated APM to Monitor Operating Costs
Application performance monitoring (APM) solutions are essential for any business looking to manage its operations efficiently. By providing real-time insights into the performance of your applications, APM solutions can help you quickly identify areas that need improvement and prevent costly mistakes from occurring in the future. But with so many different types of APM solutions on the market today, how do you know which one is right for your company?
Azure Managed Grafana users can now upgrade to Grafana Enterprise
In November 2021, we announced a strategic partnership with Microsoft to develop a Microsoft Azure managed service that lets customers run Grafana natively within their Azure cloud platform. Azure Managed Grafana, which became generally available in August 2022, makes it simple for Azure customers to deploy secure and scalable Grafana instances and connect to open source, cloud, and third-party data sources for visualization and analysis.
10 Alternatives to SEO Site Checkup (Free SEO Analyzers)
In this blog post, we address different websites that will provide all the benefits that were provided by SEO Site Checkup to you with a single click. One of the best free SEO tools, SEO Site Checkup, is no longer offering free website analysis. Isn’t it bad news? But don’t be worried, as there are 10 good alternatives where you can run analysis without paying or even registering. Let’s dive into the detail.
3 Easy Ways to Get Started With Distributed Tracing
Not to put too fine a point on it, but we think distributed tracing gets a very bad rap for being too complicated and labor-intensive. We’re here to show you three ways you can jumpstart a distributed tracing effort, starting small and expanding as it makes sense. These examples involve only a little code and perhaps a bit of a mindset change. Starting small with distributed tracing can even be fun, because who doesn’t like getting customized results without much work?
I/O Wait Time: A Guide to Improving Linux Performance
I/O wait is a plaguing issue in Linux. Speaking in layman terms, I/O wait is the time taken by the processor (here, CPU) to complete an input service request. Ideally, our CPU doesn't seem to do any work when it is processing one input request at a time, thus the duration between your input and the output provided by the system can be treated as the I/O wait time.
Custom Preferences in Sematext
Why SREs need better visibility, not more tools
Data Gravity in Cloud Networks: Massive Data
I spent the last few months of 2022 sharing my experience transitioning networks to the cloud, with a focus on spotting and managing some of the associated costs that aren’t always part of the “sticker price” of digital transformation.
Detecting Network Anomalies With Graylog Security
The Hidden Costs of Logging and What can Developers Do About It?
With the growing adoption of remote and distributed application development including micro-services, cloud-native applications, serverless, and more, it is becoming challenging more than ever before for developers to troubleshoot issues within a reasonable time, and that is a bottleneck. That in a sense contradicts the objectives of Agile and DevOps through fast feedback loops, continuous delivery, quick MTTR (mean time to resolution of defects), etc.
Introducing Levitate: 'uplifting' your metrics woes because self-management sucks like gravity
Managing your own time series database is painful. We’ve moved from servers to services, and yet, monitoring metrics data is primitive. Our managed time series database powers mission-critical workloads for monitoring, at a fraction of the cost.
JPG Vs. PNG | Which File Format Is Best for Better Speed of Websites?
Centralized Logging with Open Source Tools - OpenTelemetry and SigNoz
4 New AWS Monitoring Dashboards for EC2, EBS, RDS and S3
This is just a quick blog to draw attention to some new and enhanced monitoring dashboards we have added to eG Enterprise in the upcoming release (v 7.2) to provide quick and powerful overviews of a range of AWS services. As with all our dashboards, color-coded overlays provide guided drilldown for help desk operators and administrators. If a component has an issue, an amber or red indicator is overlaid to allow the viewer to click through to further diagnostic information.
Top 10 DevOps Challenges & How AIOps Can Help
SRE Report 2023: Are we Aligned? Yes. No. Maybe.
Each year of the SRE Report, there’s a trend or anti-pattern that leaps out and makes us pause and reflect. Last year, for example, we found a huge drop in global toil levels. With the whole world working from home for a full year, it made sense that global toil levels would drop, right? But this year, despite the great reopening underway, toil levels dropped even further - it's a paradox, one which no doubt will require its own scrutiny.
Watch: 5 tips for improving Grafana Loki query performance
Grafana Loki is designed to be cost effective and easy to operate for DevOps and SRE teams, but running queries in Loki can be confusing for those who are new to it. Loki is a horizontally scalable, highly available, multi-tenant log aggregation system inspired by Prometheus. It doesn’t index the content of the logs, but rather a set of labels for each log stream.
Prometheus Roadmap and Latest Updates
We Just celebrated 10 year birthday to Prometheus last month. Prometheus was the second project to join the Cloud Native Computing Foundation after Kubernetes in 2016, and has quickly become the de-facto way to monitor Kubernetes workloads. The plug-and-play experience, just putting Prometheus server and starting to see metrics flowing in tagged with Kubernetes labels, was a compelling offer.
New Year's (observability) Resolutions
A new year has started and I've been pondering my hopes and dreams for the year to come. In the world of SRE, observability is the most prominent pillar of my work. So, I decided to drill into the topic of observability and what I'd like to see happen in the industry in 2023. Rather than focusing on any tool, technology, or methodology, I'lll be exploring concepts that can be broadly applied in any organization.
5 Best Practices for Real User Monitoring
Real User Monitoring (RUM) is a method of web performance monitoring that captures user experience metrics on visitors to your website. It is also known as real user metrics, end-user experience monitoring, or simply user monitoring. You can think of Real User Monitoring as an automated way to get user feedback on your website. Not every user will complete a survey or fill out a feedback form, but RUM listens to each one of your users.
11 Best SSL Certificate Monitoring Tools in 2023
Without an active SSL certificate, user contact with the website is no longer secured, making it possible for any malicious entity to access private user information. Users are unlikely to return to the website after viewing a security notice, though. The simplest way to monitor the expiration of your site certificates is to use an efficient, automatic SSL certificate expiry monitoring solution.
New Year, New BGP Leaks
Only two days into the new year, and we had our first BGP routing leak. It was followed by a couple more in subsequent days. Although these incidents were brief with marginal operational impact on the internet, they are still worth analyzing because they shed light on the cracks in the internet’s routing system.
Elastic Observability 8.6: Maximizing operational efficiencies with improved application analysis and workflow integrations
Elastic Observability 8.6 introduces a set of capabilities improving production operations through the introduction of host (EC2/GCP compute/Azure compute) observability, application dependency operations views (insights into databases, caches, etc), and a new connector for Opsgenie. These new features allow customers to: Elastic Observability 8.6 is available now on Elastic Cloud — the only hosted Elasticsearch offering to include all of the new features in this latest release.
Time Zones: A Logger's Worst Nightmare
When working with log messages, it’s critical that the timestamp of the log message is accurate. Incorrect timestamps can cause problems when trying to find log messages at a specific date/time or may cause alerts to not function properly. A common cause of incorrect timestamps for log messages is a mismatch of time zones between the log source (device sending the log) and log destination (device receiving the log, such as Graylog).
The Most Reliable WordPress Hosting Providers. The Study Based on Real Outage Data
According to data from W3Techs, more than 40% of all websites are built on WordPress. Therefore, it’s no surprise that WordPress hosting has skyrocketed in popularity recently and hosting providers have proliferated. With so many choices, it’s important to understand just how reliable WordPress hosts are, especially when it comes to downtime. Web hosting downtime can have significant consequences such as business loss, brand damage, and missed opportunities.
The Importance of Observability
What Databases Taught Me About Scaling Observability
How OpenTelemetry Powers Observability @ Canva
It's Time To Stop Pitting On Prem and Cloud Against Each Other
Most sentences that include both on premises and cloud usually put the word “or” between them, or perhaps “vs.” But most enterprises operate in the world of “and.” In other words, they have workloads on premises and in the cloud—and that little three-letter word makes a world of difference.
High Citrix logon durations
Every Citrix VAD/DaaS engineering team is responsible for a healthy Citrix VAD or DaaS deployment (yes also DaaS). But the most important task is providing great user experience. Is the team sure end users are actually getting that great user experience? Can they prove it? Are they going to be alarmed immediately whenever they are not and find the root cause quickly? Does the team know which users are affected.
How to handle Android exceptions and avoid application crashes
Let’s start by stating the obvious: an exception is a problem that occurs during the runtime of a program which disrupts its conventional flow and exception handling is the process of responding to an exception. In Android, not handling an exception will lead to your application crashing and you seeing the dreaded “App keeps stopping” dialog. This makes handling exceptions incredibly important, and let’s face it: no one is going to use an app that continually crashes.
The "New Last Mile" of the Office Network
Introducing easy custom event monitoring for serverless applications.
Today we are excited to announce scheduled searches – a new feature on Dashbird that allows you to track any log event across your stack, turn it into time-series metric and also configure alert notifications based on it. This has been one of the most requested features across our users and we are thrilled to make it available for all users starting today.
What are microservices? The pros, cons, and how they work
Microservices are a popular software design architecture that breaks apart monolithic systems. A microservice application is built as a collection of loosely coupled services. Each microservice is responsible for a single feature. They interact with each other via communication protocols such as HTTP.
The Five Myths of Observability
Observability is a term that has gained a lot of traction in recent years, particularly in the realm of software engineering and DevOps. At its core, observability refers to the ability to gain insight into the internal workings of a system by observing its external outputs. This allows engineers to diagnose and troubleshoot issues with the system, as well as to monitor its performance and behaviour.
Why do enterprises need to ensure now more than ever that their mobile applications are being tested
How can observability cultivate collaboration among engineering teams?
Latest updates about backup components of VictoriaMetrics
VictoriaMetrics is proud to announce that we consider vmbackup and vmbackupmanager to be feature-complete solutions as of release 1.85.3. These backup components are essential for ensuring the safety and integrity of your data, and we have made a number of improvements in recent releases to make them even more reliable and user-friendly.
Introduction to Apache Arrow
A look at what Apache Arrow is, how it works, and some of the companies using it as a critical component in their architecture. Over the past few decades, leveraging big datasets required businesses to perform increasingly complex analysis. Advancements in query performance, analytics, and data storage are largely a result of greater access to memory. Demand, manufacturing process improvements, and technological advances all contributed to cheaper memory.
Transform the Microsoft Teams Call Quality Dashboard into Monitoring Insights.
Looking for easy Microsoft Teams troubleshooting? Martello's got your back: https://martellotech.com/solutions/microsoft-teams-issues-monitoring/
MetricFire Platform Overview
The NetOps Expert - Episode 7: The Evolution of Networking
How to forecast holiday data with Grafana Machine Learning in Grafana Cloud
A little over a year ago, we released Grafana Machine Learning, enabling Grafana Cloud Pro and Advanced users to easily view forecasts of their time series. We recently enhanced Grafana Machine Learning with Outlier Detection, which allows you to monitor a group of similar things, such as load-balanced pods in Kubernetes, and get alerted when something starts behaving differently than its peers.
Artificial Intelligence vs. Machine Learning vs. Deep Learning
Frontend Performance Monitoring: 8 Tools & SaaS to Improve Application and Website User Experience [2023]
Monitoring the performance of an application is not a strange concept to most developers. At one point or another, we’ve all had to do some performance debugging of our own. Usually, it happens when there’s a big issue affecting the user’s experience or cost implications. Only then do we make time to look at how the app performs in different scenarios.
Best Java GC Log Analyzers: Top Analysis Tools You Need to Know in 2023
Table of Contents When an application written for the Java Virtual Machine is running, it constantly creates new objects and puts them on the heap. Well, at least in the vast majority of the cases. Such objects can have a longer or shorter life, but at some point, they stopped being referenced from the code. Unlike languages like C/C++, we don’t have exact control over when the memory will be freed – freeing the memory is the garbage collector’s job.
12 Best Website Uptime Monitoring Tools & Software [2023 Reviews]
Table of Contents Uptime is the metric that measures perhaps the most critical aspect of your business, its availability. If you think about it, having a website that does many really cool things, paying tons of money on ads to bring people to it, and even spending all those hours on making your website look great won’t amount to anything if it doesn’t work.
15 Best IT Infrastructure Monitoring Tools & Software [2023 Comparison]
As your business grows, so will the number of components in your infrastructure, making manual monitoring impossible without the proper tools. Be it performance metrics, availability status, or application component logs, you need a tool that provides end-to-end visibility into the health of your infrastructure. To help you get started, we’ll compare some of the best infrastructure monitoring tools and software, both open source and paid, available today.
10 Best Server Performance Monitoring Tools & Software in 2023
Table of Contents Setting up and administering multiple servers for business and application purposes has become easier thanks to advancements in cloud technology. Today, enterprises are choosing to operate large numbers of servers both in the cloud and in their data centers to meet the ever-increasing demand. As a result of these changes, monitoring technologies have become crucial. In this post, we’ll explore the best server monitoring tools and software currently on the market.
Slight Reliability joins SquaredUp!
We are thrilled to kick start 2023 with an exciting announcement: Slight Reliability is now a part of SquaredUp! Keep reading to learn how this partnership began, in an exclusive interview snippet with our CEO Richard Benwell and Slight Reliability host Stephen Townshend.
Robust Scaling with Distributed ClickHouse Support, Google Auth, and an amazing Team Workation - SigNal 20
Top 9 DevOps Monitoring Tools in 2023
DevOps has evolved in terms of its tools, techniques, and culture. Software developers can gain a completely new perspective when operations and development work together. The tech sector now depends heavily on DevOps. It is essential in enterprises, from software delivery to project planning. Businesses in DevOps employ a variety of monitoring tools for a range of activities, including development, testing, and automation.
Why should a CIO care about testing
What has been the impact of hybrid work on the synthetic monitoring market
https://www.2steps.io/
Hybrid work has made Synthetic Monitoring vastly more important because in this home environment – devices can be unpredictable and hence impact employee productivity.
How has the synthetic monitoring market performed so far and how will it perform in the coming years
What are some traditional challenges of synthetic testing?
How to monitor Kubernetes with Grafana and Prometheus: Inside Powder's observability stack
David Calvert is a site reliability engineer working remotely from the south of France. He’s currently focused on observability, reliability, and security aspects of cloud infrastructure. You can find him as dotdc on GitHub and @0xDC_ on Twitter. Over the past three years, I’ve built and operated Kubernetes clusters for two different companies — the first one on-premises, and the second on a public cloud platform for my current job at Powder.
React Native Debugging and Error Tracking During App Development
A good developer knows how to debug code. In fact, most software engineers spend the majority of their time debugging existing code rather than writing new code. When it comes to native app development, debugging and tracking errors during development can be a tricky task. So, in this post, I’ll help you understand how you can debug your React Native applications and also track errors during app development.
Monitor Tanzu Kubernetes Grid on vSphere with Datadog
With vSphere and Tanzu Kubernetes Grid (TKG), VMware enables enterprise organizations to combine the economic advantages of virtual machines (VMs) with the agility, portability, and scalability provided by Kubernetes. vSphere is VMware’s platform for the provisioning and management of VMs.
How to Deploy a Cribl Stream Leader, Cribl Stream Worker, and Redis Containers via Docker
Cloud Monitoring: Create custom notification channels
How to Use Redfish Discovery in WhatsUp Gold
Patch Management KPI Metrics
Around 57% of data breaches are attributed to poor patch management. This stat clearly attributes to the need for patch management to keep the organization safe by mitigating security vulnerabilities. Without the right patch management software, it becomes difficult for organizations to identify critical updates. Only implementing a patch management process is not enough for any organization to win the game.
Educational institutions: To patch or not to patch?
The second decade of the 21st century witnessed an unprecedented paradigm shift in the educational sphere. With the onset of the pandemic, conventional ideas of an educational institution gave way to a far modernized and on-the-go approach. Joining class and listening to teachers’ lectures on Zoom or through Microsoft Teams is now the new norm.
How to use the Grafana Ansible collection to manage Grafana Agent across multiple Linux hosts
Anyone who is trying to set up monitoring for multiple machines knows how tough it can get to manage multiple Grafana Agents across them. To make things easier, we recently added the Grafana Agent role to the Grafana Ansible collection, which will help users manage the Agent across multiple Linux hosts. (Need to know how to get started with the Grafana Ansible collection for Grafana Cloud?
Kubernetes and the Service Mesh Era
Kubernetes is a game-changer for enterprise organizations. Automating deployment, scaling, and management of containerized applications allows organizations to embrace a cloud-native paradigm at scale and more easily employ best practices, such as microservices and DevSecOps. But as with all tech, Kubernetes has its limits. Kelsey Hightower famously tweeted that “Kubernetes is a platform for building platforms. It’s a better place to start; not the endgame.”
Cloud Providers Health Report - December 2022
Check our December 2022 health report on the top most popular cloud providers. We analyze the health of the cloud providers based on the number of outages and problems during the month. The source of the data is made available by the cloud providers themselves via their status page. We normalize it and use it to generate the report.
How Apache Arrow is Changing the Big Data Ecosystem
This article was originally published in The New Stack and is reposted here with permission. Arrow makes analytics workloads more efficient for modern CPU and GPU hardware, which makes working with large data sets easier and less costly. One of the biggest challenges of working with big data is the performance overhead involved with moving data between different tools and systems as part of your data processing pipeline.
Configuring Docker Syslog Logging Driver for Docker Dameon & Containers
Author's Cut-A Sample of Sampling, and a Whole Lot of Observability at Scale
Brick by brick, block by block—if you’ve been with us throughout our Author’s Cut blog series (and if you haven’t, you can go catch up), you’ve seen us build the case for observability from the ground up. We’ve covered structured events, the core analysis loop, and use cases for managing applications in production—and that’s just to start.
What to Expect in 2023: OpsRamp Technology Leaders Make Their Predictions
2022 saw a return to normalcy on the Covid front as offices re-opened, people gathered in large groups indoors again and mask mandates waned, even as Covid never really went away. Meanwhile, inflation raged through the summer months before subsiding somewhat later in the year and the Great Resignation gave way to mass layoffs, especially in the tech industry.
3 Reasons Customers Mistrust Your Website And How to Avoid Them
Trust is everything. It is the glue that builds the lasting relationship between you and your customers, and it depends on a variety of factors like customer service, product quality, and user experience. A large part of your customer’s experience is from their interaction with your website. So, if your website is not meeting their expectations, you can lose them as customers.
AWS Lambda in Java 8: examples and instructions
Security Observability Trends for 2023
Bifurcating Observability Data To Multiple Destinations
Are you just getting started with Cribl Stream? Or maybe you’re well on your way to becoming a certified admin through our Cribl Certified Observability Engineer certification offered by Cribl University. Regardless, using Cribl Stream to send data from one source to many destinations is something you’ll want to try. So if you’re ready, read on!
Split Screen in Sematext | Feature and Product Updates
Measuring Largest Contentful Paint
Measuring Cumulative Layout Shift
Web Performance Profiling: Google.com
Measuring Web Performance in 2024: The Definitive Guide
The Best Infrastructure monitoring tools For 2023
In our latest comparison guide for 2023, we'll cover all of the best IT infrastructure monitoring software that you should consider using to maintain uptime and improve your system’s performance.
Network Security for Banks-Preventing Breaches, Protecting Data
It is no surprise that cybercriminals are after the money, and banks have plenty lying around. They also have gobs of data, making banks irresistible to hackers who have a field day attacking complex banking IT systems flush with more connections than a movie agent. Here are a few recent facts to know.
What Is a Column Database and When Should You Use One?
If you are working with large amounts of data that will primarily be used for analytics, a column database might be a good option. There are a lot of different options when it comes to choosing a database for your application. A common discussion seems to be the high-level SQL vs. NoSQL database argument of whether data should be stored in a relational database or in a NoSQL alternative like key-value, document or graph databases.
Microsoft Calling Plans for Teams Explained
You need ways to bring your distributed teams together. That’ll be one of the reasons that you chose Microsoft Teams. It’s a brilliant comms and collaboration platform for connecting your people. But, when it comes to classic telephony, does it stand up to the competition? Basically, yes. And here’s how. To be able to use Teams for traditional corporate telephony, businesses must link their Microsoft Phone System to a virtual PBX hosted by Microsoft in the cloud.
Guide to basic agent plugins
Datadog Network Device Monitoring (NDM)
Splunk Universal Forwarder: Tips & Resources for Universal Forwarders
Curious about Splunk® Universal Forwarders? This article will sum up what they are, why to use them and how the universal forwarder works. Importantly, we’ll point you to the very best tips, tricks and resources on using universal forwarders (and other ways) to get data into Splunk.
4 billion logs, 120 TB of data: How Just Eat Takeaway.com uses Grafana Cloud to scale
In 2017, Just Eat Takeaway.com (JET) was transitioning from a scrappy startup to a surging scaleup. With a global customer base and workforce, the food delivery marketplace’s front line teams needed to scale the real-time monitoring of the platform. Their initial efforts looked like “NASA’s mission control with Grafana dashboards,” said Senior Technology Manager Alex Murray.
The Year of the Observability Pipeline
As we begin the new year, it is customary to reflect and identify areas we can continue to grow in 2023. Whether it’s joining the local gym, starting a new diet, or taking up a new hobby, this time is always full of promise to continually improve. The same can be said for digital businesses of every size and across every vertical. Macroeconomic trends have especially made this time one of reflection for a number of organizations.
The Reality of Machine Learning in Network Observability
For the last few years, the entire networking industry has focused on analytics and mining more and more information out of the network. This makes sense because of all the changes in networking over the last decade. Changes like network overlays, public cloud, applications delivered as a service, and containers mean we need to pay attention to much more diverse information out there.
Is An APM Solution Worth The Investment?
Application performance monitoring (APM) solutions are a crucial tool for modern software companies in 2023. They offer invaluable insights into application performance, including response times, error rates, and more. But are they worth the investment? In this article, we'll dive deep into the economics of application monitoring, including the costs, benefits, and potential ROI.
Using AI & ML to Identify Incident Causation
How Telegraf Works for Data Collection
Cron Job Monitoring Beta - Because scheduled jobs fail too
Do your cron jobs (aka scheduled jobs) ever fail or not run as expected? Scheduled jobs are supposed to be predictable – as the name implies. But as with many things, predictable!= reliable. Cron jobs fail too and we think you should know when that happens, Crons allows you to monitor the uptime and performance of any scheduled, recurring job in Sentry. Once set up, you’ll get alerts and metrics to help you solve errors, detect timeouts, and prevent disruptions to your service.
Unlimited Cardinality in InfluxDB
Best practices to prevent alert fatigue
As your environment changes, new trends can quickly make your existing monitoring less accurate. At the same time, building alerts after every new incident can turn a straightforward strategy into a convoluted one. Treating monitoring as a one-time or reactive effort can both result in alert fatigue. Alert fatigue occurs when an excessive number of alerts are generated by monitoring systems or when alerts are irrelevant or unhelpful, leading to a diminished ability to see critical issues.
ManageEngine named a 2022 Gartner Peer Insights Customers' Choice for Application Performance Monitoring and Observability
We are thrilled to announce that ManageEngine has been recognized as a Customers’ Choice in the 2022 Gartner Peer Insights ‘Voice of the Customer’: Application Performance Monitoring and Observability report for the fourth time in a row. “We believe this recognition is a testament to our customer-first mentality. For us, appreciation from our customers is one of the greatest compliments we can receive.
The state of ITOM in 2023: Navigating observability and AIOps
Top 5 challenges in Hyper-V performance monitoring that you need to know
Top 5 Website Monitoring Trends for 2023
Out with the old and in with the new? Yes and no. Although 2022 may have been an interesting year for the global website monitoring market, many of the trends that dominated this year will likely carry over into 2023. Here’s a peek at how some of the top website monitoring trends of the year will likely impact security, network infrastructures and user experience going into 2023.
How to Mitigate Network Risks to Achieve Highly Resilient Business Services
They say change is good. But in IT operations, change is also the number one cause of outages. According to the Uptime Institute, 49% of all service outages are attributed to configuration and change management errors. That's a lot of avoidable headaches. And because errors often have downstream effects, it may not be obvious what caused an outage, resulting in prolonged downtime that affects revenue-generating business services, results in service level agreement (SLA) penalties, and causes a loss of customer trust. And those costs add up quickly. Gartner figures the meter for an average downtime event runs at $5,600 per minute.
What's Using Your Bandwidth? Here's a Monitoring Tool
Bandwidth monitoring provides IT administrators with the assurance that the network has sufficient capacity to run business-critical applications. In addition, network ops team have end-to-end visibility to identify network hogs that cause the congestion. Typically, when a single component overloads in any network, it can bring the entire operation to its knees and impact the employee digital experience. For example, even if you may have a dedicated service plan from your ISP, employees will end up complaining about issues like large file transfer time and slower applications.
Phantom Metrics: Why Your Monitoring Dashboard May Be Lying to You
Whether you’re a DevOps, SRE, or just a data driven individual, you’re probably addicted to dashboards and metrics. We look at our metrics to see how our system is doing, whether on the infrastructure, the application or the business level. We trust our metrics to show us the status of our system and where it misbehaves. But do our metrics show us what really happened? You’d be surprised how often it’s not the case.
Get More Visibility with Uptime Reports
Web performance greatly influences the user experience through engagement with your brand and impression of your products. For example, page speed is directly proportional to how long people stay on a site. As a result, there’s much more demand for network optimization on modern devices, including AR, IoT, cloud drives, and mobile apps. When your network stretches across hundreds of locations, the server ends up receiving the output from tons of clients at the same time.
Business Benefits of Network Detection and Response (NDR)
When we talk about the business value of a tool or a system that at first glance may seem like a “nice to have” or a “helpful but not absolutely necessary” technology, it is a good idea to start any discussion on the merits of the tool by putting some things into perspective.
Top 10 Cron Job Monitoring Tools in 2023
A cron job is used to schedule and carry out specific tasks. It automates the process and periodically executes it in the background. You can keep track of whether a given cron job is running or not with the help of a cron job monitoring tool. You must first configure a cron job in the monitoring tool before you can monitor it. After then, the tool checks the status regularly and notifies you when a problem occurs. This article lists the top 10 tools for online cron job monitoring.
Website Monitoring: What, Why, and Best Practices
When visitors come to your website to browse products, make purchases, or read your articles, you need to consider how they will feel. Furthermore, a website that loads slowly and experiences frequent breakdowns must be avoided because it can turn visitors away. Your sales, revenue, and profitability may suffer as a result. Additionally, it could harm your reputation, particularly if the visitor is fresh. If they have a bad first impression, they will quickly pursue other options.
Introduction to SNMP
How JPMorgan Chase uses Grafana and AI to monitor SLOs, SLIs, and more
For the team at JPMorgan Chase, the daily stakes of having a stable system are high. “We are in the business of making sure that trades are executed, and systems are stable and up and running for a positive client experience,” said Askari Imam, VP, Asset Wealth Management (Product and Integration Delivery).
Identify and resolve incidents faster with InsightFinder's offering in the Datadog Marketplace
InsightFinder is a SaaS platform that uses AI-backed predictive analytics to predict and prevent production incidents. Using InsightFinder with Datadog, you can quickly identify hidden correlations in your application metrics, logs, and events and address application issues before they devolve into production outages and create customer impact.
How Lumigo helps StartingFinance run 100% serverless with 100% confidence
Kubernetes Monitoring: 4 Data Types to Increase Insights
Having a deep understanding of a Kubernetes cluster is important: the right insights allow you to monitor the performance and health of the cluster, which is necessary for ensuring that applications are running smoothly and that any potential issues can be identified and addressed quickly. As your Kubernetes cluster develops, so does the need for monitoring and troubleshooting.
DevOps Security: Challenges and Best Practices
With the shift from traditional monolithic applications to the distributed microservices of DevOps, there is a need for a similar change in operational security policies. For example, how do you secure a disparate number of micro-systems operating with multiple access credentials across a multi-level organization? DevSecOps (Devops security) answers this question by integrating security at every level of your development process.
Unreadable Metrics: Why You Can't Find Anything in Your Monitoring Dashboards
Dashboards are powerful tools for monitoring and troubleshooting your system. Too often, however, we run into an incident, jump to the dashboard, just to find ourselves drowning in endless data and unable to find what we need. This could be caused not just by the data overload, but also due to seeing too many or too few colors, inconsistent conventions or the lack of visual cues.
The Optymyze CEO Explains 5 Ways To Automate Your DevOps Workflow
Python Syslog | Configuring Syslog in Python using syslog and logging module
Microservices Monitoring: Cutting Engineering Costs and Saving Time
As businesses are planning for 2023, many are adopting a more conservative mindset when it comes to their resources. In light of the recent market fluctuations and the uncertainty of if and how a recession will affect them, they are looking for ways to cut costs and increase their efficiency. But despite the spending slowdown, development velocity can’t slow down.


