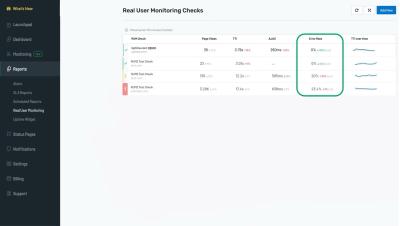
In today's digital landscape, businesses rely heavily on various online operations to deliver services, communicate with customers, and maintain a competitive edge. Behind the scenes, cron jobs play a pivotal role in automating critical processes such as data backups, report generation, and system maintenance. However, ensuring the reliability of these cron jobs is often overlooked until a disruption occurs.
Amazon Web Services (AWS) recently released a new cloud deployment option – ”Dedicated Local Zones” targeted at public sector, government and regulated industry use cases. Many customers still rely on on-premises infrastructure to meet regulatory and compliance requirements such as data localization. You can read the details of the AWS announcement including which services Dedicated Local Zones will support, here: Announcing AWS Dedicated Local Zones (amazon.com).
Do you find yourself lying awake late at night, worried that your greatest observability fears will materialize as one of the most horrific specters of Kubernetes-driven chaos reaches up through your mattress to consume your very soul?
Catchpoint introduces new capabilities that make the Internet better. Our Fall 2023 Product Launch event showcased Catchpoint’s latest innovations to accelerate time to detection, improve automation capabilities, and further expand our Global Observability Network.
The much-anticipated cybersecurity rules by the U.S. Securities and Exchange Commission (SEC) for public companies have arrived, signaling a significant step forward from the proposed rules released in March 2022. These final rules, effective July 26, 2023, introduce new obligations that public companies must adhere to, promising a more secure and transparent corporate landscape. However, these regulations bring significant compliance challenges and litigation risks.
Survey results reveal online shopping is set to soar over the holiday season and retailers must ensure their applications are ready. Research published today by Cisco AppDynamics reveals that consumers around the world are planning to do more of their holiday season shopping online than ever before this year. On average, consumers expect that 59% of their spending on key shopping dates such as Black Friday and Cyber Monday will be online this year versus in-store, compared to 53% last year.
We're happy to announce that AppSignal now offers monitoring tools for Python projects. AppSignal helps you get the most out of your Python application's monitoring metrics, with additional support for multiple Python frameworks and packages such as Django and Celery. In this article, we'll walk you through some of our core features to show you how to power up your Python application with AppSignal.
For those who have limited experience with OpenTelemetry, it can be intimidating to instrument.NET applications. But the OpenTelemetry community created a welcome shortcut with the first stable release of.NET Automatic Instrumentation. It simplifies the process of collecting metrics, logs, and traces from your.NET applications, without applying any changes to the source code or adding any dependencies to the OSS project.
Grafana’s plugin tools help developers extend Grafana’s core functionality and create plugins faster, with a modern build setup and zero configuration. Grafana Scenes, meanwhile, is a new front-end library, introduced with Grafana 10, that enables developers to create dashboard-like experiences — such as querying and transformations, dynamic panel rendering, and time ranges — directly within Grafana application plugins.
Understanding limitations and challenges scaling Prometheus in modern cloud-native environments. Here we delve into long-term retention, downsampling, high availability, and other challenges.
Shining a light on the dark corners of the new enterprise network doesn't have to be as scary or overwhelming as some think. While “ghost issues” typically lurk in these sometimes unexplored places on the internet or in cloud environments, during this Halloween season your network operations teams can gain the confidence to not only uncover these network ghosts, but compel and cast them out forever.
Cribl Search is reshaping the data search paradigm, empowering users to uncover and analyze data directly from its source. Cribl Search can easily reach out and query data already collected in Amazon S3 (or S3 compatible), Amazon Security Lake, Azure Blob, Google Cloud Storage, and more. By searching data where it lives, you can dramatically speed up your search process by avoiding the need to move data before analyzing it.
Today, more than ever, as IT environments become more diverse and complex, the need for an effective network monitoring solution has become paramount. However, with the digital environment, it’s constantly ever-evolving, so, these tools must keep pace with these changes to ensure they are still effective for users diagnosing issues and identifying bottlenecks within their network.
The most noticeable takeaway from All Things Open 2023 was how visibly and demonstrably people were there for the event itself. Not to check a box or browse the swag but to be together, show their support of open source, and glean every last bit of knowledge they could.
AIOps — a term coined by Gartner back in 2017 has emerged as one of the hottest talking points in the realm of ITOps. Since its inception, its adoption by large enterprises has gone up from 5% to 30% in 2023. This impressive 6X growth is a clear indicator that AIOps is here to transform how businesses manage their IT operations. But what is it that makes AIOps special? What are the benefits of AIOps that businesses are looking to leverage.
We are thrilled to announce that ManageEngine has achieved the prestigious gold badge in Google’s Android Enterprise partner program. This recognition stands as a testament to our commitment to excellence and our dedication to providing top-notch solutions for your organization. In this blog, we’ll explore the Android Enterprise program, the benefits of our partnership with it, and how it can empower your organization in the digital era.
Today's enterprise networks are diverse and complex. Rather than the simple network perimeter of old, bad actors can attack through multiple entry points, including cloud-based applications. Not to mention, these networks generate massive amounts of transactional data. Because enterprise networks have become larger, they're more difficult to secure and manage. As a result, IT operations teams and security analysts seek better ways to deal with the massive influx of information to improve security and observability.
In the first part of our 2023 PromCon recap, we spent OpenObservability Talks exploring the Perses open source project. We found heavy users of open source Grafana who found themselves grappling with issues arising from managing a vast number of dashboards, and the need to manage dashboards as code in a GitOps fashion.
In the intricate web of modern software systems and full-stack observability, knowing how requests flow and interact across distributed components is paramount. Distributed tracing tools can help you. To better understand how distributed tracing works and benefits, here’s our selection of top distributed tracing tools to choose from.
Recently, Brandon Woods of Keysight Technologies shared two workflows that his team was able to implement with Nexthink Flow – allowing them to save time by solve problems more quickly and without human intervention.
I have worked as a helpdesk specialist, cyber security analyst, information systems security engineer, professional services consultant, etc. At this point in my career, I have seen enough to relate with anyone in the IT world. Let’s narrow our focus and chat about monitoring system health and troubleshooting. Tool sprawl is the standard.
You probably know that we have a generous free plan that allows you to send 20 million events per month. This is enough for many of our customers. In fact, some have developed neat techniques to keep themselves underneath the event limit. I’m going to share one way here—hopefully no one at Honeycomb notices!
Maciej Nawrocki, Senior Backend Developer at Bright Inventions, is a backend developer focused on DevOps and monitoring. Adam Waniak, Senior Backend Developer at Bright Inventions, is a backend developer with a keen interest in DevOps. Bright Inventions is a software consulting studio based in Gdansk, Poland, with expertise in mobile, web, blockchain, and IOT systems. At Bright Inventions, we always prioritize app optimization when we develop software solutions for our clients.
In a rapidly expanding, highly distributed cloud infrastructure environment, it can be difficult to make decisions about the design and management of cloud architectures. That’s because it’s hard for a single observer to see the full scope when their organization owns thousands of cloud resources distributed across hundreds of accounts. You need broad, complete visibility in order to find underutilized resources and other forms of bloat.
We recently featured in Ecommerce Age. If you missed the write up, you can catch up in full, here… As ecommerce continues to outdo the high street, Black Friday sales are becoming as much of a tradition as Christmas dinners. But shoppers are very influenced by external factors, from the economy to website experiences. We outline the key ecommerce challenges this Black Friday…
Operational resilience is an increasing area of focus and scrutiny for regulators of the banking and financial services industry. In the European Union, the Digital Operational Resilience Act (DORA) looms on the near horizon - with equivalent regulatory frameworks slowly but surely rolling out across the globe.
Virtualization involves creating multiple virtual instances on a single physical server, allowing for efficient utilization of hardware resources and isolation of workloads. Businesses prefer a virtual environment as it can be tailored to meet specific security and performance requirements, and it provides numerous customization. The concept of virtualization became accessible after the emergence of VMware, a cloud computing virtualization platform for hosting complex architecture effortlessly.
“Zero Days” may be one of the most recognizable cybersecurity terms, other than hacker of course, for good reason. Zero Day Vulnerabilities are notoriously challenging for defending security teams to identify. Because of delays between active exploit and discovery, they are one of the worst examples of “Known Unknowns” in cybersecurity (Other than user’s behavior of course..). It’s important to understand that Zero Days are not really brand-new vulnerabilities.
A festive in-person and online event marks 20 years of groundbreaking innovation at ScienceLogic by celebrating the people who make it all happen.
The term Server Monitoring, whilst put simply can be defined as the practice of obtaining into the behavior of your servers both physical and virtual, can be deemed complex. This is purely due to the vast range of servers that exist. Due to this, it is difficult to place a ‘one size fits all’ approach to Server Monitoring.
In an era dominated by data-driven decision making, monitoring tools play an indispensable role in ensuring that our systems run efficiently and without interruption. When considering tools like Netdata and Prometheus, performance isn't just a number; it's about empowering users with real-time insights and enabling them to act with agility.
Monitoring a network for its uptime and peak performance is crucial. By tracking network performance, organizations can better understand their network requirements, gain in-depth visibility, identify mishaps quickly, and roll out remediation measures. However, this is easier said than done. The complexity only increases when the network is an MSP’s.
Murphy’s Law states, “Anything that can go wrong, will go wrong.” This is an old adage that can be applied to IT networks everywhere. Organizations and IT admins can perfect their networks to the best of their powers, however, network issues of varying severities can still pop up. These network issues need immediate responses and resolutions. If such issues go unresolved for an unreasonably long time, the damages to both the network and the organization can be costly.
Picture the SAP Kernel as the heartbeat of the system, vitalizing the core programs upon which the fundamental functionality of SAP applications rely on. It's the life force pulsing through the application server, executable programs, database, and operating system, rather than merely encompassing them within itself. SAP Kernel upgrades refer to updating the system's current executables with upgraded versions. These upgrades are essential to patch security vulnerabilities and fix bugs. Besides bug fixing, SAP Kernel upgrades improve hardware compatibility, boost speed, and enhance stability.
As APIs play a crucial role in connecting modern cloud applications, monitoring their availability and performance is a must if you want to provide a top-notch experience. A good API monitoring tool will help you build reliable APIs by identifying and resolving the issues before they reach your users. If you’re interested in such a solution, look no further. In this article, we reviewed some of the best API monitoring tools and services available today, both open source and commercial.
Industrial IoT (IIoT) machines and sensors generate valuable time series data. It’s impossible to derive the insights necessary to inform decisions as a company to produce or operate more efficiently without sending operational technology (OT) data to informational technology (IT) systems.
Welcome to the second chapter of the handbook on Anomaly Detection for Time Series Data! This series of blog posts aims to provide an in-depth look into the fundamentals of anomaly detection and root cause analysis. It will also address the challenges posed by the time-series characteristics of the data and demystify technical jargon by breaking it down into easily understandable language. This blog post (Chapter 2) is focused on different types of anomalies.
If there’s anything I’ve learned, monitoring data is the lifeblood of the business and a superpower for any IT practitioner. Monitoring allows organizations to react to changes, identify and recover, and understand the true health of the business.
Modern distributed applications are composed of potentially hundreds of disparate services, all containing code from different internal development teams as well as from third-party libraries and frameworks with limited external visibility. Instrumenting your code is essential for ensuring the operational excellence of all these different services. However, keeping your instrumentation up to date can be challenging when new issues arise outside the scope of your existing logs.
Missed the last Netdata updates? Here is what is new.
Recently, Elastic Universal ProfilingTM became generally available. It is the part of our Observability solution that allows users to do whole system, continuous profiling in production environments. If you're not familiar with continuous profiling, you are probably wondering what Universal Profiling is and why you should care. That's what we will address in this post.
Website monitoring has grown in importance over the past decade for individuals and businesses all around the globe – and for different purposes. It became even more important in 2020 during the COVID-19 pandemic. As travel, events, and offices around the globe shut down rapidly, people relied on different tools and features to be kept up to speed regarding the ongoing situation.
The World Wide Web’s transmission system is built on HTTP. To ensure an application that uses the HTTP transmission works, you must monitor it constantly. This is where an HTTP monitor comes in. In this tutorial, we’ll cover the fundamentals of HTTP monitors, including what they are, why they matter, and how to set one up.
Solr is widely adopted by startups and enterprises alike. It’s powerful and open-source, so it’s very appealing to just about everyone looking for a search platform to build off of. Being easily accessible, many people overlook the importance of monitoring Solr. Even when that importance is put into question, a lot of people continue with the trend and use an open-source tool for their monitoring needs.
As the second largest and active Cloud Native Computing Foundation (CNCF) project, OpenTelemetry is well on its way to becoming the ubiquitous, unified standard and framework for observability. OpenTelemetry owes this success to its comprehensive and feature-rich toolset that allows users to retrieve valuable observability data from their applications with low effort. The OpenTelemetry Java agent is one of the most mature and feature-rich components in OpenTelemetry’s ecosystem.
Large Language Models (LLMs) are all the rage in software development, and for good reason: they provide crucial opportunities to positively enhance our software. At Honeycomb, we saw an opportunity in the form of Query Assistant, a feature that can help engineers ask questions of their systems in plain English.
Yes! It’s true! As of today, we are announcing the general availability of Icinga Reporting in version 1.0. You can find all issues related to this release on our Roadmap. Please also refer to the corresponding upgrade section in the documentation.
In the vibrant atmosphere of PromCon during the last week of September, attendees were treated to a plethora of exciting updates from the Prometheus universe. A significant highlight of the event has been the unveiling of the Perses project. With its innovative approach of dashboard as code, GitOps, and Kubernetes native features, Perses promises a revolutionary experience for Prometheus users, which gained a lot of traction at the conference.
In an era where “cloud-native” has become synonymous with complexity and distribution, the world of application monitoring faces a profound challenge.
In the spirit of Halloween, imagine a world where goblins, ghosts, and ghastly waits lurk in the shadows of your website monitoring. In the world of automation, nothing is more terrifying than the sneaky presence of ‘waits’. They may seem harmless and solve problems in the short term but in reality, they can distort the very essence of monitoring.
Zero trust in the cloud is no longer a luxury in the modern digital age but an absolute necessity. Learn how Kentik secures cloud workloads with actionable views of inbound, outbound, and denied traffic.
From an IT perspective, technologists generally agree that the ability to monitor and have visibility into the IT stack across every one of their applications is essential with the now-permanent remote and hybrid work models. It also stems from the fact that digital transformation and IT growth has accelerated by seven years since the pandemic in 2020, analysts say.
As a developer I love automation, Whether it’s orchestrating a smart home or optimizing developer toolchains. Automation injects efficiency into my daily routine, simplifying intricate processes and eliminating repetitive tasks. Especially when it comes to toolchains, I’m constantly on the lookout for ways to boost coding workflows. Cloud Development Kits (CDKs) brought with them a new era of streamlined developer toolchains.
Map, prioritize and act on security issues found in cloud environments with the newly expanded security offering from Cisco AppDynamics. Welcome to the October edition of the What’s New in Security series — and — happy security awareness month!
Besides monitoring your site's uptime, Oh Dear offers many other checks to monitor all kinds of aspects of your web app. One of those checks is our DNS check. Whenever we detect problems with your DNS records or when one of the DNS records changes, we can notify you. By default, we only monitor the DNS records of the domain you are monitoring. So when you're monitoring example.com, we'll only monitor the records of that hostname. A CNAME record is a special kind of DNS record.
In today’s fast-paced digital world, the importance of network monitoring is growing by leaps and bounds. With real-time network monitoring, businesses can transform their user experiences and drive unstoppable growth. Whether you run a small business or a large corporation, incorporating network monitoring tools can help in the smooth functioning of your networks. Join us as we unveil the top benefits of network monitoring in the modern business landscape.
A guide to maintaining a secure network.
Understanding the roles of devices in your network infrastructure.
As Grafana continues to evolve, we remain dedicated to improving the experience for Grafana users, as well as the developers building applications on top of the platform. Today, we are delighted to introduce the next step in that evolution, the all-new Grafana developer portal — a central hub of curated resources for developers who want to extend Grafana’s capabilities.
The world of virtualization has been evolving at a rapid pace, transforming the way organizations manage and deliver desktop computing solutions. Windows 365, Microsoft's cloud-based operating system, is a game-changer in this space. Combined with VMware Horizon Cloud, it opens up a world of possibilities for businesses seeking flexibility, scalability, and enhanced security in their desktop infrastructure. In this blog post, we'll explore the synergy between Windows 365 and VMware Horizon Cloud, showcasing the benefits and features of this powerful combination.
The Datadog Service Catalog consolidates knowledge of your organization’s services and shows you information about their performance, reliability, and ownership in a central location. The Service Catalog now includes Service Scorecards, which inform service owners, SREs, and other stakeholders throughout your organization of any gaps in observability or deviations from reliability best practices.
InfluxDB v3 allows users to write data at a rate of 4.3 million points per second. However, an incredibly fast ingest rate like this is meaningless without the ability to query that data. Apache DataFusion is an “extensible query execution framework, written in Rust, that uses Apache Arrow as its in-memory format.” It enables 5–25x faster query responses across a broad range of query types compared to previous versions of InfluxDB that didn’t use the Apache ecosystem.
In today’s technology driven world, businesses rely heavily on their digital infrastructure to operate efficiently and serve customers effectively. With the growing complexity of these infrastructures, ensuring their stability and performance has become paramount. “But how can I realize that?” is a question i often hear. And this is where infrastructure monitoring steps in.
You may have noticed that, during the last few weeks, we released a bunch of new versions for different components of our stack. It’s a very exciting time of the year for us, since we’re currently finishing work that we have done through the last months. Today, we’re announcing another release: The general availability of Icinga Director v1.11! This new version ships with nice new features, which has been requested by many users. Check out the full changelog for all details.
To fully utilize the capabilities of Kubernetes, it’s crucial to have a reliable system for gathering and organizing logs, metrics, and events. With the complex nature of container orchestration, it’s crucial to understand the significance and process behind the data generated in a Kubernetes environment at scale. Cribl Edge works seamlessly with Kubernetes and can cater to various needs.
Today, Cribl surpassed $100 million in annual recurring revenue (ARR), becoming one of the fastest companies to ever reach this milestone in under four years––an incredible achievement on our journey to building a generational company. Reaching $100 million in ARR so quickly shows that our unique approach and steadfast focus on IT and Security continues to be validated by the market.
The lifeblood of any online business lies in its accessibility. When your site or application is accessible, your customers are happy, your brand reputation remains intact, and revenues keep flowing. Because of this, understanding and calculating uptime becomes crucial. Let’s face it: any downtime translates to lost revenue.
As distributed, interconnected microservices have replaced monolithic applications, application monitoring has had to evolve to support these modern, complex architectures. Rather than monitoring a single application and code base, organizations need to monitor the performance and network connectivity of multiple services that interact with each other.
Kubernetes or K8s is an open-source production-grade container orchestration system for automating, scaling, and managing containerized applications. A container is a lightweight, standalone, executable ready-to-run software package that contains everything needed to run an application. It includes the runtime, code, libraries, systems tools, and default values for any essential settings.
This article coins the term “FDAP stack”, explains why we used it to build InfluxDB 3.0, and argues that it will enable and power a generation of analytics applications in the same way that the LAMP stack enabled and powered a generation of interactive websites (by the way we are hiring!).
Performance tests created with the Grafana k6 browser module use lab data collected from pre-defined environments, devices, and network settings. Lab data allows you to repeatedly reproduce performance results, making it useful for detecting and fixing performance issues early. Lab data, however, doesn’t account for one very important testing component: real user experience.
Logz.io is always growing and evolving based on customer usage and feedback. We add new features and quality of life improvements all the time. Here’s the round up of what we released in 2023 Q3.
Since its acquisition by Cisco in 2012, Meraki has taken off as one of the most valuable tools for simplifying networking in the cloud era. Organizations using Meraki to install and configure software-defined networking (SDN) and software-defined wide area networking (SD-WAN) devices across their IT estates can attest to the fact.
Managing modern networks means taking on the complexity of downtime, config errors, and vulnerabilities that hackers can exploit. Learn how BGP Flow Specification (Flowspec) can help to mitigate DDoS attacks through disseminating traffic flow specification rules throughout a network.
As the use of SD-WAN continues to expand, benefits and challenges may seem to be proliferating in equal measure as well. In this post, we look at some of the advantages and obstacles presented by SD-WAN, and we detail how DX NetOps by Broadcom delivers the visibility teams need to monitor and manage their SD-WAN and legacy network environments.
This is part three in a series where I learn OpenTelemetry (OTEL) from scratch. If you haven't yet seen them yet, part 1 is about setting up auto-instrumented tracing for Node.js and part 2 is where I initially implemented the OTEL collector. Today we are going to begin experimenting with sampling. We need to sample traces because we capture so much data! It would be impractical to process and store it all (in most cases).
Our guide to the elements that make up a network infrastructure.
IT environments can produce billions of log events each day from a variety of hosts and applications. Collecting this data can be costly, often resulting in increased network overhead from processing inefficiencies and inconsistent ingestion during major system events. Google Cloud Dataflow is a serverless, fully managed framework that enables you to automate and autoscale data processing.
As systems increasingly shift towards distributed architectures to deliver application services, the roles of monitoring and observability have never been more crucial. Monitoring delivers the situational awareness you need to detect issues, while observability goes a step further, offering the analytical depth to understand the root cause of those issues. Understanding the nuanced differences between monitoring and observability is crucial for anyone responsible for system health and performance.
Grafana 10.2 is here! Download Grafana 10.2 As always, the latest version of Grafana includes a ton of dashboard and data visualization improvements. You can add interactive buttons to your Canvas visualizations; auto-generate dashboard panel titles, and descriptions using AI; and zoom in on specific y-axis values in your time series.
Over the last year or so, the unavoidable topic of overwhelming cost has emerged as the number one issue among today’s observability practitioners. Whether it is in conversations among end users, feedback from customers and prospects, industry chatter or the coverage of experts including Gartner, the issue of massive telemetry data volumes driving unsustainable observability budgets prevails.
Massdriver is a cloud operations platform that makes it easier for engineering teams to build, deploy, and scale cloud-native applications. While many companies use this lofty language to make similar promises, Dave Williams, CTO and co-founder at Massdriver, means it. Before Massdriver, Dave worked in product engineering where he was constantly bogged down with DevOps toil. He spent his time doing everything except what he was hired to do: write software.
Cribl’s interface is Super Neato: Reactive, beautiful, and easy to use. But sometimes you need to access settings and configurations programmatically. The good news is that interactive API docs are baked into your Cribl instance. The better news is that everything that happens in the GUI is making API calls. With your browser’s developer mode, you can easily take a peak behind the curtain to see exactly how the API was called and what the payload looked like.
systemd journals play a crucial role in the Linux system ecosystem, and understanding the importance of the logs contained within is essential for both system administrators and developers.
Adapting to efficient ways to build and control pipelines is vital to businesses aiming to ensure streamlined data operations and maintain a competitive advantage. That’s why we’re introducing Mezmo Pipeline as Code—a transformative approach to pipeline management.
A few days ago a memo from logistics company Flexport leaked to the media announcing significant layoffs. Now, a tech company doing layoffs in 2023 is hardly notable. A 20% RIF here and there is almost expected. What is notable is the reason for the layoffs: Flexport is trying to achieve profitability.
A spicy article hit my inbox the other day. It came with a bold claim — “API testing is better than UI testing”. Absolutes like “A is better than B” rarely hold in the software world. “It depends” is the answer to most tech questions for a reason. Let’s compare API and UI testing and discuss why one isn’t better than the other. The frenemies are “just different”, and always will be. And that’s a good thing.
At Cribl, we have the privilege of helping our customers achieve their strategic data goals by giving them visibility and control over all of their observability data. The reality today is that data is commonly stored across many places. Whether intentional (such as using Cribl Stream to create a security data lake) or unintentional (because of silos and tool sprawl), organizations desire the ability to access and analyze all of this information at any time.
Live debugging refers to debugging software while running in production without causing any downtime. It has gained popularity in modern software development practices, which drives many critical systems across businesses and industries. In the context of always-on, cloud-native applications, unearthing severe bugs and fixing them in real time is only possible through live debugging. Therefore, live debugging becomes an integral part of any developer’s skill set.
WordPress is the content management system that has found its place in the hearts of innumerable web developers and users around the world. You might be shocked to learn that almost 45% of all websites on the Internet are grounded on WordPress. The question is, “How do users monitor their WordPress website and check their critical metrics?” Any site needs to be monitored these days. There are countless online services that offer tools for external website monitoring.
In relatively short order, the adoption of cloud services and hybrid work models went from exception to ubiquity. This has fundamentally changed the nature of the networks users rely upon—and created an entirely new set of challenges for IT and network operations teams. More than ever, business services and interactions are reliant upon network connectivity that spans a diverse mix of the public internet and third-party networks.
Today’s fast-paced digital world can lead to system breakdown and disruptions that strain organizational resources. What truly distinguishes successful organizations is their response when problems occur. Incident management serves this function. At its core, incident management involves teams managing unexpected disruptions quickly with minimal impact to users or business operations. The process is like a safety net that prevents further problems from developing into trust issues.
CloudNatix is an infrastructure monitoring and optimization platform for VMs, containers, and other cloud resources. Customers can use CloudNatix’s Autopilot feature to automatically configure and run infrastructure optimization workflows that allocate and run their resources more efficiently. CloudNatix can take action to auto-size Kubernetes and VM workloads, defragment Kubernetes clusters, and create harvest pods from unused VMs, among other key optimizations.
Over the past couple of years, I’ve carried out several audits on healthcare customers’ Citrix Virtual Apps and Desktops or DaaS deployments, and one of the checks that consistently stands out is the use of older Citrix Receiver and Workspace app versions connecting to the environment.
Find out about different network security device types and their uses.
Elastic Observability is the optimal tool to provide visibility into your running web apps. Microsoft Azure Container Apps is a fully managed environment that enables you to run containerized applications on a serverless platform so that your applications scale up and down. This allows you to accomplish the dual objective of serving every customer’s need for availability while meeting your needs to do so as efficiently as possible.
The Microsoft infrastructure makes collecting network traces more complicated. Network traces (tracert) inside and out of the Azure Virtual Desktop virtual machine are valuable when diagnosing support issues or when an end-user calls up complaining of poor Azure Virtual Desktop performance. The following information should help improve the collection of network traces and trace data, which will aid in diagnosing Virtual Desktop Infrastructure connectivity.
It can be hard to figure out why response times are high in Java applications. In my experience, when engineers investigate this type of issue, they typically use one of two methods: They either apply a process of elimination to find a recent commit that might have caused the problem, or they use profiles of the system to look for the cause of value changes in relevant metrics.
Technical debt is the enemy of innovation. It restrains people, processes, and technology in a way that prohibits modernization. How do you decouple an organization from legacy technical debt and free up resources to tackle more important strategic efforts? Simply put, automation.
IT Operations is an ecosystem of technology, customers, users, and employees. Understanding the organizational, customer, and employee experience—and how to effectively monitor and manage that ecosystem—is foundational to adopting a Total Experience Framework in the modern enterprise.
Last winter, Flexcity — a market leader in electric flexibility — faced an unprecedented challenge: Help stabilize the French national power grid, in the midst of a widespread energy crisis that loomed over Europe. As a byproduct of the Russian invasion of Ukraine, energy prices in the EU soared in 2022. And France, meanwhile, faced a nuclear power outage that winter that threatened to significantly disrupt its energy supply and increase the risk of electricity shortages.
Microsoft Azure offers a choice of relational and non-relational database services to support a wide range of application needs and demands. Built-in intelligence helps automate management tasks like high availability, scaling, and query performance tuning to provide users with services that ensure applications are always available and performant. Many services offer essentially limitless database scale and SLAs (Service Level Agreements) usually range between 99.9-99.999% availability.
We recently had the privilege of presenting our telemetry data pipelining platform at Cloud Field Day. Today, we'd like to share a recap of our demo with you. In this demo, we explore the transformative potential of data profiling, telemetry pipeline optimization, and incident response. Foundationally, we follow an Understand, Optimize, and Respond workflow.
Nagios is an open-source monitoring system that has become indispensable for system administrators and DevOps teams across the world. However, like any other software, you’re bound to come across errors with Nagios. In this article, we’re going to take a look at some common errors and how to solve them, along with the pros and cons of Nagios, and why MetricFire is the perfect alternative for monitoring.
Organizations must always be ready to pivot on a dime and adjust their business goals when the market—or their customers—demand it. Whether driven by industry changes or developments in market trends, when goals shift at the top, the teams who execute against them must follow suit. Since network infrastructure is becoming increasingly complex to fit business needs, IT teams are part of these initiatives.
Let me tell you something you already know: Networks are more complex than ever. They are massive. They are confounding. Modern networks are obtuse superorganisms of switches, routers, containers, and overlays; a hodgepodge of telemetry from AWS, Azure, GCP, OCI, and sprawling infrastructure that spans more than a dozen timezones.
Learn how Cisco AppDynamics OpenAI API monitoring provides comprehensive insights that enable application owners and operations to optimize cost and monitor performance of OpenAI integrations. The rapid advancement of generative artificial intelligence (GenAI) has reshaped various industries and transformed the way we interact with technology. Companies across diverse sectors have fully embraced the power of GenAI to such an extent that it is now an integral part of the digital experience.
Webhooks, those wonderful little lifelines connecting one application to another, have become an essential part of our app notification world. They help keep your systems in the loop, notifying them immediately when events of interest occur. This real-time communication ensures that your applications remain responsive, adaptive, and always up-to-date with the latest information.
Platform engineering has been one of the hottest keywords in the software community in recent years. As a natural extension of DevOps and the shift-left mentality it fosters, platform engineering is a subfield within software engineering that focuses on building and maintaining tools, workflows, and frameworks that allow developers to build and test their applications efficiently.
This post introduces the Pandora FMS monitoring solution and how to integrate it with ilert to establish reliable alerting. The guest post is written by Sancho Lerena, the CEO of Pandora FMS.
Today we’re announcing the general availability of Icinga Certificate Monitoring in version 1.3.0. You can find all issues related to this release on our Roadmap. Please also refer to the corresponding upgrade section in the documentation.
Kubernetes offers unparalleled flexibility and scalability for containerized orchestration. However, this dynamism can also lead to unexpected costs if you don’t efficiently manage your corresponding cloud resources. In this blog, we’ll outline a series of best practices for Kubernetes cost optimization that will help you keep your infrastructure running smoothly while staying within your budget.
Grafana k6 v0.47.0 has been released, featuring gRPC’s binary metadata support, new authentication methods, and tons of other improvements for Grafana k6 OSS. Here’s a quick overview of the latest features in Grafana k6 v0.47.0, as well as some other exciting updates related to Grafana Cloud k6 and the k6 community.
The rapid evolution of technology profoundly impacts network infrastructure monitoring. New technologies such as containerization, microservices, and serverless computing introduce complexities that require monitoring solutions to adapt. The shift to DevOps practices, where development and operations teams collaborate closely, emphasizes the need for real-time monitoring and feedback loops to ensure continuous integration and delivery of applications and services.
Support complex environments at scale, enabling agile service delivery with low opex and a great customer experience.
While Kubernetes revolutionized distributed orchestration, it also added complexity to logging and monitoring. To keep up with the challenges of working with Kubernetes clusters, you need to adapt your monitoring strategy. This includes changing the tools you use. To help keep your Kubernetes environment healthy, we made a list of the best Kubernetes monitoring tools. This list includes both open-source and commercial.
Windows services are the unsung heroes of Windows machines. This is because they act as critical components of the Windows operating system that run in the background to keep your computer running smoothly and securely. They are responsible for a wide array of tasks, including system startup and shutdown, security, performance, and application support.
We often get questions like: And while the 14-year-old in me is proud to say that we’ve done 24/7 support for clusters of 1000+ nodes holding many PB of data, I am quick to add that.
We’ve compiled a list of 9 top-notch port monitoring tools that will help you stay ahead without breaking the bank. So strap in as we explore the world of ports through these beneficial applications and tell you about the best options on the market today! In this guide, you’ll learn… Looking for more amazing monitoring tools? Check out our post about the top 7 ping monitoring tools in 2023.
Imagine you’re piloting a spaceship through the cosmos, embarking on a thrilling journey to explore the far reaches of the universe. As the captain of this ship, you need a dashboard that displays critical information about your vessel, such as fuel levels, navigation data, and life support systems. This dashboard is your lifeline, providing you with real-time insights about the health and performance of various systems within your ship, so you can quickly make critical decisions.
Welcome to the handbook on Anomaly Detection for Time Series Data! This series of blog posts aims to provide an in-depth look into the fundamentals of anomaly detection and root cause analysis. It will also address the challenges posed by the time-series characteristics of the data and demystify technical jargon by breaking it down into easily understandable language. This blog post (Chapter 1) is focused on.
Learn all about the most common challenges enterprises face when it comes to managing large-scale infrastructures and how Kentik’s network observability platform can help.
Imagine, if you will, having hundreds of devices that you need to monitor. All these devices generate data at sub-second intervals, and you need all that high fidelity data for historical analysis to feed machine learning models. Storing all that data can get really expensive, really fast. When that happens, you must decide what’s more important: keeping all your data or sacrificing insights and analysis. It may not be a big stretch of the imagination for many readers.
With our plans for InfluxDB 3.0 OSS laid out, both myself and the rest of the DevRel team have been actively searching for ecosystem platforms that would be logical integrations for the future of InfluxDB. One of these platforms is Quix! Quix is a comprehensive solution tailored for crafting, launching, and overseeing event streaming applications using Python. If you’re looking to sift through time series or event data in real-time for instant decision-making, Quix is your go-to.
Organizations are moving to micro-services and container-based architectures because these modern environments enable speed, efficiency, availability, and the power to innovate and scale more quickly. However, when it comes to troubleshooting distributed cloud native applications, teams face a unique set of challenges due to the dynamic and decentralized nature of these systems.
Grafana is an open source visualization and monitoring solution for correlating and analyzing data from various sources. From time series graphs to heatmaps to 3D charts, it gives you lots of ways to untangle complex datasets. And while that’s incredibly powerful for observability, sometimes you’re looking for something fairly straightforward.
In recent months, we’ve talked a lot about how AppNeta by Broadcom offers active monitoring capabilities, and how they enable teams to rapidly troubleshoot issues across both internally managed networks and those managed by third parties, such as ISPs and cloud providers.
When outages cost you tens of thousands of dollars each minute, pinpointing the source of disruptions as quickly as possible becomes mission-critical. This is not a time for finger-pointing and hastily assembled war rooms searching for that needle in the haystack. You need simple, intelligent, trustworthy Internet health information to expedite your incident detection.
Navigating the realm of Windows observability often referred to as O11y (short for observability), can be a complicated journey. Windows environments are known for their complexity, with various services, applications, and workloads running on each host.
We’ve compiled a list of 9 top-notch port monitoring tools that will help you stay ahead without breaking the bank. So strap in as we explore the world of ports through these beneficial applications and tell you about the best options on the market today! In this guide, you’ll learn… Looking for more amazing monitoring tools? Check out our post about the top 7 ping monitoring tools in 2024.
Organizations today rely on mobile device management (MDM) solutions to secure and manage corporate resources across a diverse range of devices. One such platform is Microsoft Intune, which offers security, patch, and access control features for mobile and desktop devices. Today, we look at Microsoft Intune and how Exoprise Service Watch helps customers ensure Intune is working well.
The 2023 Gartner Market Guide for Unified Endpoint Management Tools is here! This year’s report has been highly anticipated since Gartner retired the Magic Quadrant™ for unified endpoint management (UEM) tools last year. Organizations and IT professionals can use this research to understand the core capabilities to look out for when selecting a UEM solution, plus they’ll get insights into the future of the UEM market so they can align their investments accordingly.
Uptime checker and website monitoring tools are vital to ensure carts and CTAs are working effectively for Black Friday & Christmas sales. Black Friday online sales reached almost $10 billion last year, and getting a share of that action can make or break a retailer’s year. With that kickoff to the holiday shopping season fast approaching, businesses must be ready with website security and online monitoring to ensure their online infrastructure is secure.
Learn how new modern application optimization modules built on the Cisco Full-Stack Observability Platform can help you solve cloud cost and resource optimization challenges for your Kubernetes workloads. Controlling unpredictable cloud cost and resource utilization has become critical for organizations to ensure the profitability of modern workloads.
Alerts and notifications have been part of TrackJS since the very beginning. Our standard notification options reflect our desire to keep things simple. Over time though, our customers have asked to customize their alerts and fine tune them to specific scenarios. To support that use case, we’re releasing a new kind of notification we’re calling “Saved Filter Notifications”.
AppSignal now supports Remix! With insights into the performance of Remix components like loaders and routing, AppSignal helps you refine your Remix application. This blog post will show you how to start monitoring your Remix application using AppSignal.
Today we’re announcing the general availability of Icinga Business Process Modeling v2.5.0. You can find all issues related to this release on our Roadmap.
Whether you're a business that relies on Amazon reviews and seller feedback or planning a much-needed holiday through your favorite travel comparison site, everyday activities like these wouldn't be impossible without APIs. An integral part of app development, API technology is interwoven into a rich tapestry of popular applications that companies and consumers use daily. Without them, there would be no smartphones, social media, or instant messaging.
We're excited to share an update to our Analyze package—introducing the RQL AI Assistant, a natural language AI assistant to help you write your RQL queries. If you've ever been frustrated by the complexity of Rollbar Query Language (RQL) or the time it takes to get your data, this feature is the solution you've been waiting for. We understand working with the RQL has been a steep learning curve for many.
Kubernetes (K8s) is at the forefront of modern infrastructure, but with its capabilities comes a deluge of telemetry data. Efficiently managing and optimizing this data is crucial to harnessing the full potential of your Kubernetes deployments.
The transition from traditional on-premises IT infrastructure to the public cloud has brought substantial relief to IT decision-makers and sysadmins. Since many organizations use Microsoft Windows as their preferred operating system, Microsoft Azure has become the public cloud provider of choice automatically owing to a familiar GUI and Active Directory sync.
Distributed systems, such as modern microservices-based applications, are highly scalable, but also highly complex. Dependencies and unexpected interactions between services are a common cause of incidents, and these incidents are also notoriously hard to test for. xk6-disruptor — an extension that adds fault injection capabilities to Grafana k6, the open source reliability and load testing tool — can help overcome these challenges.
Mezmo Edge enables users to deploy telemetry pipelines and process data in their own environment. A significant advancement in Mezmo’s capabilities, Edge is especially useful when working with sensitive medical or financial records. Organizations that need to comply with PCI, GDPR, or CCPA or that generally work with PII will benefit from Edge’s secure approach to data protection. Edge also provides the telemetry data optimization benefits of a pipeline without cloud data egress charges.
With the smart home revolution in full swing, choosing the proper hardware for platforms like Home Assistant can be overwhelming. Whether you’re new to home automation or a seasoned pro, the hardware you select can make or break your experience. But fear not! This comprehensive guide will demystify the requirements, delve into the various options, and help you make an informed decision. From the compact Raspberry Pi to the powerful Intel NUC, we’ve got you covered.
Who is software for? It’s an interesting question, because there’s an obvious answer. It’s for the users, right? If your job is to write software, then it’s implied that the most important thing you should care about is the experience people have when they use your software.
To excel in embedded development in 2023, it is essential to have a solid understanding of build systems, continuous integration, and deployment strategies. This workshop by Percepio training partner Jacob Beningo aims to provide a comprehensive primer on these practices, equipping participants with the knowledge and skills necessary to tackle complex firmware projects with confidence.
Prometheus Alertmanager is a powerful tool designed to handle various alerts generated by Prometheus. It plays a vital role in the overall monitoring ecosystem, acting as a centralized hub for managing alert notifications. With Prometheus Alertmanager and its robust notification management capabilities, you can efficiently define alert routing and notification policies. This empowers you to take timely actions and mitigate potential issues before they impact your service availability.
The cybersecurity industry is experiencing an explosion of innovative tools designed to tackle complex security challenges. However, the hype surrounding these tools has outpaced their actual capabilities, leading many teams to struggle with complexity and extracting value from their investment. In this conversation with Optiv‘s Randy Lariar, we explore the potential and dangers of bringing advanced data analytics and artificial intelligence tools to the cybersecurity space.
A truism amongst operations professionals is that any alert your observability platform produces should be actionable, otherwise it is just noise. Auto-remediation is a hard problem, so the most common action triggered by an alert is for an engineer to gather more data and context.
While we all love open source technology and the community that comes with it, we don’t always have the time or resources to stand up, maintain, update, and troubleshoot a self-hosted stack.
AppNeta by Broadcom will soon offer monitoring policies that streamline monitoring setup and maintenance. Now available for preview, these capabilities will significantly reduce the time and effort required for ongoing operations, especially for customers with large-scale and dynamic sets of monitoring points.
Monitoring CPU temperature is crucial for ensuring the smooth and efficient functioning of computer systems. As processors become more powerful, they generate more heat, which can lead to performance issues, system instability, and even hardware damage. Overheating is a common problem faced by many computer users, especially those who engage in resource-intensive tasks like gaming or running complex software.
Efficient monitoring and visualization of performance metrics are paramount for ensuring seamless user experiences and reliable system operations. Grafana and Graphite, two powerful open-source tools, form an unbeatable combination when it comes to monitoring and analyzing time-series data. Grafana provides a robust and flexible platform for visualizing data, while Graphite acts as a scalable and efficient backend for storing and retrieving metric data.
We release VictoriaMetrics several times a month, including at least one major update. However, because these new releases often introduce new features, they may be less stable. That’s why we also regularly publish Long-term support releases (LTS) alongside our regular releases. These LTS versions focus exclusively on bug fixes without new features and performance improvements. We committed to publishing LTS versions every six months and supporting them for one year.
The story of how we simplified database system monitoring for generalists while making it flexible enough for specialists.
The cloud has revolutionized the possibilities of managing IT infrastructure. However, not all organizations are ready to make the move to the cloud. In this blog, we will discuss why on-premises infrastructure management solutions are still relevant in the cloud age.
Grafana is a powerful open-source platform for monitoring and observability, but what truly makes it shine are its plugins. For technology engineers looking to expand Grafana's capabilities, plugins are the way to go. In this post, we'll dive into the world of Grafana plugins and offer some unique tips to get the most out of them.
In the field of big data analytics, stream processing has emerged as a crucial paradigm, reshaping how businesses interact with data. But what is stream processing and why are more businesses using it?
Kubernetes integrations are now available for AutoSys, dSeries, and Automic Automation. It wasn’t that long ago that teams in many organizations started dipping their toes into the world of containers and microservices. It didn’t take long for this approach to application development and orchestration to take hold, and for Kubernetes to emerge as a dominant, broadly used technology.
For Azure Virtual Desktop (AVD) sessions, Microsoft exposes a set of user experience and graphics performance counters that eG Enterprise monitors out-of-the-box. These performance counters for Azure Virtual Desktop and Remote Desktop Protocol (RDP) / RemoteFX sessions can be used to troubleshoot AVD problems.
While Grafana is one of the better known names in the industry, Coralogix offers a full-stack observability platform. Despite the popularity of the Grafana brand, the cloud based solution lacks in some key areas. This article will go over the differences between Coralogix and Grafana Cloud, from features, customer support, pricing and more.
As software engineers, we all know that troubleshooting often involves sifting through heaps of data points — scanning metrics, reading logs, checking resource status and analyzing events. We manually connect the dots, and if we're experienced enough, we might spot an issue that's about to become a problem. At StackState, we've faced these same challenges.
Learn more about Nexthink Flow: https://nexthink.com/platform/flow
Digital Employee Experience is vital to attract and keep the best employees. A solid DEX strategy also increases employee productivity and motivation, a selling point for business leadership across the board. Yet, IT teams have less and less ability to control the factors that make up the digital employee experience. Although IT still own the devices, most of the network and applications are managed by third-party vendors.
OK, so you’ve decided to move from Elasticsearch to OpenSearch. Maybe our comparison helped you decide and maybe you’ve checked our guide on how to perform the migration. But how do you know if your new OpenSearch performs as well and functions as correctly as the existing Elasticsearch? Even when comparing old with new versions, upgrades don’t always translate into better performance.
According to the latest Crowdstrike report, in 2022 cloud-based exploitation increased by 95%, and there was an average eCrime breakout time of 84 minutes. Just as significantly, in 2021, the Biden administration passed an executive order to improve the nation’s cybersecurity standards. There are also upcoming laws like DORA in the European Union. So, increased cyber attacks and legislative pressures mean you need to (a) actively protect against threats and (b) prove that you are doing so.
Many DevOps teams work proactively to meet security and compliance standards. They consider security best practices when developing software with open source components, scanning code for vulnerabilities, deploying changes, and maintaining applications and infrastructure. Security is a key feature of many of the tools they’re using, and the policies and industry standards they’re following.
We are introducing a new Snooze option for items. When Snoozing an item, the user will define how long an item will stop sending notifications for - once that time period expires then the item will return to normal and begin sending notifications again. Currently, setting an Item to have a status of Muted prevents notifications from being sent until somebody changes the status back to Active.
What are the current options to migrate from OpenSearch to Elasticsearch®? OpenSearch is a fork of Elasticsearch 7.10 that has diverged quite a bit from itself lately, resulting in a different set of features and also different performance, as this benchmark shows (hint: it’s currently much slower than Elasticsearch).
In our first blog post, we introduced the concept of cloud unit economics—a system to measure cost and usage metrics. It helps maximize cloud value for better outcomes per dollar spent. We reviewed what cloud unit economics is, why it’s crucial to FinOps success, and how it enables organizations to unlock the full business value potential of cloud computing.
Metrics are closely associated with cloud infrastructure monitoring or application performance monitoring – we monitor metrics like infrastructure CPU and request latency to understand how our services are responding to changes in the system, which is a good way to surface new production issues. As many teams transition to observability, collecting metric data isn’t enough.
Kubernetes has been around for nearly 10 years now. In the past five years, we’ve seen a drastic increase in adoption by engineering teams of all sizes. The promise of standardization of deployments and scaling across different types of applications, from static websites to full-blown microservice solutions, has fueled this sharp increase.
What is Grafana? How do I change the color of a panel set? Where can I find all public dashboards? Who made the Kessel Run in less than 12 parsecs?
One of the things I really love about working for Cribl is the ability to help our customers optimize their data. Microsoft Windows Event Logs are something I have always looked to as a proverbial Rosetta Stone to help translate semi-structured, classic-style events into something more efficient and less resource-intensive to search. Extracting field values requires a large number of regular expressions to parse the events, which isn’t ideal.
In this article, we are going to discuss how to set up Kafka monitoring using Prometheus. Kafka is one of the most widely used streaming platforms, and Prometheus is a popular way to monitor Kafka. We will use Prometheus to pull metrics from Kafka and then visualize the important metrics on a Grafana dashboard. We will also look at some of the challenges of running a self-hosted Prometheus and Grafana instance versus the Hosted Grafana offered by MetricFire.
Grafana is one of the most popular dashboarding and visualization tools for metrics. The Grafana Dashboards are a very important part of infrastructure and application instrumentation. In this post, we will deep dive into Grafana dashboards. We will create a Grafana dashboard for a VM’s most important metrics, learn to create advanced dashboards with filters for multiple instance metrics, import and export dashboards, learn to refresh intervals in dashboards and learn about plugins.
Today, we released our systemd journal plugin for Netdata, allowing you to explore, view, search, filter and analyze systemd journal logs. Like most things about Netdata, this is a zero-configuration plugin. You don’t have to do anything apart from installing Netdata on your systems.This is key design direction for Netdata, since we want Netdata to be able to help even if you install it mid-crisis, while you have an incident at hand.
Distributed transaction tracing (DTT) is a way of following the progress of message requests as they permeate through distributed cloud environments. Tracing the transactions as they make their way through many different layers of the application stack, such as from Kafka to ActiveMQ to MQ or any similar platform, is achieved by tagging the message request with a unique identifier that allows it to be followed.
An easy way to communicate with Elasticsearch and Elastic Cloud using Arduino IoT devices At Elastic®, we are constantly looking for new ways to simplify search experience, and we started to look at the IoT world. The collection of data coming from IoT can be quite challenging, especially when we have thousands of devices. Elasticsearch® can be very useful to collect, explore, visualize, and discover data — for all the data coming from multiple devices.
AWS’s serverless technologies are popular because they provide cost effective scaling and great separation of concerns. However, observing serverless architectures like Lambda is challenging due to their transient nature and abstracted infrastructure. Unlike traditional systems with consistent hosts, serverless functions are ephemeral, often scaling rapidly and operating in isolation.
Icinga 2.14 introduced a new feature that allows to better model complex dependencies between your hosts and services: redundancy groups. Let’s take an e-mail server as an example. In order to deliver outgoing messages, it has to look up the addresses of the destination servers and relies on DNS for doing so. For incoming messages, it has to know which accounts exist and in a corporate environment, this typically means looking up user accounts in a directory service like LDAP.
When it comes to managing services effectively, terms like SLA, SLO, and SLI are often thrown around like confetti at a parade. They’re in meetings, in documents, and even in casual office conversations. But if you’re new to the field or simply haven’t had the chance to dig into these acronyms, they can feel like a bewildering alphabet soup. And they can’t be missing on an uptime monitoring blog such as ours! So, what do these terms really mean?
This article was originally published on The New Stack and is reposted here with permission. By taking advantage of monitoring data, companies can ensure their infrastructure is performing optimally while reducing costs. While building new features and launching new products is fun, none of it matters if your software isn’t reliable. One key part of making sure your apps run smoothly is having robust infrastructure monitoring in place.
Understanding production has historically been reserved for software developers and engineers. After all, those folks are the ones building, maintaining, and fixing everything they deliver into production. However, the value of software doesn't stop the moment it makes it to production. Software systems have users, and there are often teams dedicated to their support.
Just after midnight on October 1, 2023, the remote island of Saint Helena in the South Atlantic began passing internet traffic over its long-awaited, first-ever submarine cable connection. In this blog post, we cover how Kentik’s measurements captured this historic activation, as well as the epic story of the advocacy work it took to make this development possible.
In the previous article I covered how to set up auto-instrumented tracing for a Node.js app using OpenTelemetry (OTEL). We then sent the spans directly to the open source tracing tool Jaeger. I recommend you give that a read first before walking through this guide because we're going to re-use the instrumentation we set up last time. Today we're going to take things a step further by introducing the OpenTelemetry Collector.
Learn how collaboration fueled by business risk observability can help your teams protect what matters most. According to IDC, 750 million cloud native applications will be created globally by 2025, underscoring the seismic shift to cloud native application environments to harness the scalability and agility of the cloud.
VIPs can be hard work, but in many ways, that’s for good reason. Whether it’s your C-suite that carries the responsibility of the company on their shoulders, or if it’s your top-shelf customers that form a big part of your business, you really need to look after them all. You know that, but from an IT perspective, how can you not support them while making your life easier? You need to quit being reactive. Easier said than done… but here’s how to start making it happen.
Grafana is a visualization tool that allows you to see and analyze all of your metrics in one unified dashboard. Grafana can pull metrics from any source, display that data, and then enable you to annotate and understand the data directly in the dashboard. Grafana dashboards are designed to allow you to visualize information in a ton of ways, from histograms and heatmaps to world maps. Grafana also has an alerting feature that can communicate with you through Slack, PagerDuty, and more.
When developing modern applications, product managers, designers, and website developers need to understand how users interact with web pages in order to guide those users through their desired journeys. For example, teams need to know if users ever see the content near the bottom of the page, where to place CTAs to ensure they are in high-traffic areas, and how to compare different pages based on user engagement.
Datadog Session Replay in Real User Monitoring (RUM) enables customers to capture and visually replay the web and mobile experience of their end users. With Session Replay, customers can quickly find and address UX errors by seeing precisely what actions an end user took, the point where they got stuck, and the outcome encountered as a result. Session Replay allows for easier troubleshooting and debugging because it delivers visible, insightful context into frontend errors.
How automated are your automations? You (or your expert engineers) are probably spending hours on complicated PowerShell coding – writing, testing, reviewing, signing, and updating. What if there were a better way to coordinate your automations with workflows? Orchestrate multi-layer automated detection, communication, integration, and action.
Today, we announce a revolutionary new product that will put an end to recurring, complex IT issues and deliver continuous engineering with full scale, start-to-finish automation for EUC teams.
Nexthink’s ability to integrate with anything has long been one of the most popular aspects of our products. From your ITSM tool to Azure AD, Nexthink data can be connected across your environment – so you can act on Nexthink insights to build the best possible digital employee experience. Nexthink Flow continues our dedication to integrations by allowing for the sharing of data and actions in both directions for several key integrations.
Automation and orchestration present huge opportunities for business efficiency, time optimization, and cost savings. With Nexthink Flow, EUC teams now have the power to orchestrate full end-to-end automations that eliminate repetitive manual work and drive employee productivity. But with so many opportunities at your fingertips, it can be hard to know where to begin. Flow is a powerful orchestration engine, with incredible flexibility designed to fit diverse business needs.
In our journeys as developers, we frequently encounter the need for speed and efficiency. But often, integrating development tools can feel like a time-consuming venture, more so than our usual build processes. If you’ve ever found yourself delving into java logs looking for needles in logstacks, you’ll appreciate the beauty of this 1-click OpenTelemetry.
This release of the collection will feature a whole set of possibilities to deploy a complete Icinga 2 environment. Before diving deep into the collection, a quick recap of all roles which were available and which are included in the current release v0.3.0. New Roles in v0.3.0 To further enhance the Icinga 2 installation process via Ansible those roles are vital for a successful deployment. The Icinga DB is the future backend of Icinga 2, this can be handled with our icingadb and icingadb_redis roles.
Imagine sending logs to cost-effective storage, converting them into efficient metrics, and forwarding only essential data for analysis. This change can slash ingest and long-term storage expenses by an order of magnitude! Enter Cribl Search—an ingenious solution that skillfully navigates storage, transforms logs into actionable metrics, and seamlessly channels vital data to your analysis systems. The result? Over 99.94% reduction in volume, enhanced efficiency and substantial cost savings.
Tired of being a firefighter in your IT department who is always battling issues after they erupt? Well, you’re not the only one. With IT infrastructure becoming more complex day by day, IT managers across the globe face the same challenge. But not anymore. Infrastructure monitoring tools are here to save the day by empowering IT managers to not only predict but also prevent IT infrastructure issues. But how?
OpenTelemetry (OTel) is an open-source, vendor-neutral observability solution that provides a suite of components—including APIs, SDKs, and a data collector—that enable teams to collect and communicate telemetry data from cloud-native applications and services. OTel also defines the OpenTelemetry Protocol (OTLP), a standard for the encoding and transfer of telemetry data.
In the world of monitoring and observability, Prometheus has grown into the de-facto standard for monitoring in cloud-native environments because of its robust data collection mechanism, flexible querying capabilities, and integration with other tools for rich dashboarding and visualization.
Grafana dashboards are powerful and flexible tools for observing applications and infrastructure, so it’s no surprise we get a lot of questions from the community about how to embed them into their web applications. Over the past few releases, we’ve developed a lot of options for how to do this in Grafana, but there can be confusion about how they work, and when to use each approach.
Grafana Agent v0.37 is here! This new release brings a lot of exciting new features and marks the pinnacle of a year-long effort to achieve feature parity between Grafana Agent Flow mode and Grafana Agent Static mode. We also extended our config converter to ease the migration from Static to Flow mode and we added the possibility to split your Flow configuration into multiple files. Please make note of some breaking changes in this release.
Today’s applications are designed to be always available and serve users 24/7. Performing live debugging on such applications is akin to doctors operating on a patient. Since the advent of the “as a service” model, software is like a living, breathing entity, akin to an anatomical system. Operating on such entities requires more dexterity on the developer’s part, to ensure that the software application lives on while being debugged and improved continuously.
Control over operational costs is pivotal in Kubernetes' deployment and management. Although Kubernetes brings power and control over your deployments, it also necessitates thorough understanding and management of costs. OpenCost, specifically designed for Kubernetes cost monitoring, combined with VictoriaMetrics, an efficient time series database, offers a comprehensive solution for this challenge.
How did you like our list of the top 10 must-read DevOps blogs? This time, we welcome you to our definitive guide on the top ping monitoring tools you should consider for 2024!
Time series data is foundational in almost all applications and services. Even if time series isn’t the focus, like in an IoT sensor data centered application, it appears in monitoring data as metrics, logs, and traces. Because of time series data’s unique characteristics, it’s best served in a time series database. InfluxDB is purpose-built to handle the high volume and velocity of time series ingestion, and perform real-time analytics, alerting, and anomaly detection at scale.
This article was originally published on The New Stack and is reposted here with permission. Here is a brief case study that explores the logistics and motivations that would lead a successful company to spend time and resources completely rewriting the core of their flagship product in Rust. Calling a programming language Rust almost seems like a misnomer. Rust is the brittle byproduct of corrosion — not something that would typically inspire confidence.
In today’s landscape, what’s considered security data has expanded to encompass more diverse data types like network data, behavioral analytics, and application metrics. These sources are now essential for a comprehensive security strategy, and visibility into all that data makes proactive threat detection possible. That said, organizations often struggle to process data from various vendors and merge telemetry sets to gain a complete view of their environments.
“Why bother with it? I let it run in the background and focus on more important DevOps work.”— a random DevOps Engineer at Reddit r/devops In an era where technology is evolving at breakneck speeds, it's easy to overlook the tools that are right under our noses. One such underutilized powerhouse is the systemd journal. For many, it's a mere tool to check the status of systemd service units or to tail the most recent events (journalctl -f).
Monitoring the performance and health of web applications is paramount for ensuring a seamless user experience. Flask offers developers the flexibility to build dynamic applications. However, as applications grow in complexity, so does the need for efficient monitoring solutions. This is where Grafana and Graphite come into play.
As technology advances, operating systems play a vital role in providing a seamless user experience. Microsoft’s Windows OS has been at the forefront, constantly introducing innovative features over time. Two features related to improving the end-user digital experience are the Windows Experience Index (WEI) and Reliability Monitor. These measurements have become instrumental to Digital Experience Monitoring (DEM) in assessing system capabilities and measuring stability.
Most IT firms build their empire on Kubernetes, for its amazing flexibility and super scalability. RedHat OpenShift Container Platform (formerly OpenShift Enterprise) is a hybrid cloud application platform powered by Kubernetes, which initially only operated on-premise, and has been open to service for more than nine years.
Today’s modern applications are made up of thousands of loosely connected private and publicly exposed APIs, each serving a specific function. This dynamic API landscape, in combination with the decentralized nature of microservice development, can be overwhelmingly challenging to manage—let alone govern or secure adequately. API sprawl is often created as a result, leading to fragmented or nonexistent internal API documentation, knowledge bases, and toolsets.
As your applications grow, your teams may be faced with managing a complex, expanding mesh of potentially thousands of loosely connected APIs—each one a new point of failure that can be difficult to track and patch. API sprawl comes naturally in rapidly expanding, distributed applications, and the difficulty of maintaining centralized knowledge and toolsets for your APIs creates friction when teams need to leverage APIs they don’t own.
Businesses lose potential revenue, trust, and brand reputation every moment your website is down. Some of those things can never be earned back. Website outages sting whether you’re a blossoming startup or a seasoned enterprise. How often do they happen, and what’s the actual cost? That is exactly what we will explore together today!
Databases in one form or another are almost an inseparable part of modern applications. A popular one among them is MySQL on which this article will focus. But how to monitor MySQL? This article will give an introduction to this topic.
Prometheus is a very popular open-source monitoring and alerting toolkit originally built in 2012. Its main focus is to provide valid insight into system performance by providing a way for certain variables of that system to be monitored. Prometheus displays the performance of these variables as a graph to allow its users to see their system’s performance at a glance.
The choice of a framework isn’t merely a technical decision, it’s a commitment to a trajectory. Both Next.js and Remix are robust frameworks that cater to modern web development needs, but they differ in their approach to routing, data fetching, and performance optimization.
This is the third blog in our series on Kafka, where we continue to explore the nuances of deploying Kafka for scale. In our previous blogs, Essential Metrics for Kafka Performance Monitoring and Auto-Instrumenting OpenTelemetry for Kafka, we laid the foundation for understanding Kafka’s performance and monitoring aspects. Now, as we explore further into the Kafka ecosystem, we’re here to tackle the common challenges that can arise during deployment and scaling.
You may be ready to make the move to Grafana Cloud, but securely querying private data has been a blocker. If you wanted to query a network-secured data source like a MySQL database or an Elasticsearch cluster that is hosted in an on-premises private network or a Virtual Private Cloud (VPC), you needed to open your network to inbound queries from a range of IP addresses.
Using Grafana Cloud to manage and monitor even your most sensitive data from your AWS services just got easier. If your organization’s workloads are hosted in AWS and you are using a Grafana Cloud instance that’s also hosted in AWS, you can now use AWS PrivateLink to establish a secure connection between your virtual private cloud (VPC) network and Grafana Cloud for all your data.
CloudWatch can be a great start for monitoring your AWS environments, but it has some limitations in terms of granularity, customization, alerting, and integration with third-party tools. In this article, learn all the ways that Kentik can supercharge your AWS performance monitoring.
It’s official, summer is over. So grab yourself a pumpkin-spiced food item of choice and check out what the Sentry team has been up to this past month. From introducing new features, product improvements, and integrations, we can objectively say we made Sentry at least a smidge better this month. Keep reading to see how the latest developments can make your debugging experience less painful.
As modern software systems become increasingly distributed, interconnected, and complex, ensuring production reliability and performance is becoming harder and more stressful. Seemingly nondescript changes to our infrastructure or application can have massive impacts on system uptime, health, and performance, all while the cost of production incidents continues to grow.
As you may have already discovered (or will soon encounter), many vendors that offer uptime monitoring solutions charge a setup fee. But instead of seeing this as a legitimate cost, you should view it as stop sign. There are three reasons why.
Although the title of this blog poses the question “Why do Monitoring Service Thresholds Overlap?”, really the question should be: “In Remote Monitoring and Management Solutions, Why Do Some Monitoring Service Thresholds Overlap?”. That’s a bit of a mouthful, but it’s what I’m going to look at in this blog. Here’s why overlapping thresholds in remote monitoring matter.
DX Unified Infrastructure Management (DX UIM) is a powerful solution that enables comprehensive infrastructure observability across your digital ecosystems, including private, public, and hybrid clouds. With DX UIM, you can proactively and efficiently manage the performance and availability of your IT infrastructure and applications. DX UIM 20.4 is the current main branch of the solution. This release offers a number of significant capabilities that weren’t available in earlier versions.
Traditional logging tools are struggling to keep up with the explosive pace of data growth. Data collection isn’t the most straightforward process — so deploying and configuring all the tools necessary to manage this growth is more difficult than ever, and navigating evolving logging and monitoring requirements only adds another layer of complexity to the situation.
Observability has become one of the largest line items in the IT budget, second only to cloud costs. A main reason for this is teams are often stuck collecting significantly more data than they need. This is where Circonus Passport helps. Rather than filter data after it’s collected like current observability data pipeline management tools, Passport is used to filter data before it’s collected.
Grafana is an open-source platform for metric analytics, monitoring, and visualization. In this article, we will explore the basics of Grafana and learn how to deploy it to Kubernetes. You will find specific coding examples and screenshots you can follow to deploy Grafana.
Grafana is an open-source visualization and analytics tool that lets you query, graph, and alert on your time series metrics no matter where they are stored - Grafana dashboards provide telling insight into your organization. All data from Grafana Dashboards can be queried and presented with different types of panels ranging from time-series graphs and single stats displays to histograms, heat maps, and many more.
Collecting metrics about your servers, applications, and traffic is a critical part of an application development project. There are many things that can go wrong in production systems, and collecting and organizing data can help you pinpoint bottlenecks and problems in your infrastructure. In this article, we will discuss Graphite and StatsD, and how they can help form the basis of monitoring infrastructure.
Prometheus can be configured to read from and write to remote storage, in addition to its local time series database. This is intended to support long-term storage of monitoring data.
In this video, we'll be discussing to find out more, visit: https://www.rapidspike.com/black-friday/
Render-blocking resources are JavaScript and CSS files that prevent the web page from loading until they are downloaded. These might be critical resources that don’t get loaded immediately, or non-critical resources that are being loaded at the very beginning. Fixing render-blocking JavaScript and CSS helps improve page load times so sneakerheads don’t bounce to your competitor’s site while waiting for the images of the latest drop to load.
If generative AI is innovative for enterprises in 2023, being cloud-based is ubiquitous. What that means is that the data today is extremely voluminous and complex. Not to mention that all that data needs proactive monitoring and analysis. Thus, data in observability and monitoring can often be complex and challenging to understand due to its sheer volume and diversity.
See how higher education institutions can leverage full-stack observability to provide the best possible application experiences for students, staff and faculty. Now more than ever, delivering a superior user experience is fundamental to digital transformation — and not just in the corporate world. Higher education has discovered the value of digital experiences for engaging and supporting students, keeping faculty productive and satisfied and creating efficiencies that save money.
If you work with Kubernetes, you know that any number of issues can pose a serious threat to the stability and security of your deployments. One that's subtly damaging is configuration drift, which occurs when the actual state of how your system is set up — its configuration — strays from the way you defined. Configuration drift in Kubernetes can happen when people make changes manually, systems aren't synchronized properly or monitoring falls short.
What guarantees the success of a website today isn’t just its content and design; delivering a seamless and efficient user experience (UX) is also extremely critical. This is where Core Web Vitals are important as they provide a collection of performance metrics to evaluate the quality of website user experience. Core Web Vitals are critical to attract visitors and retain them as they directly impact a site’s visibility on Google.
A few weeks ago, we published some benchmarking that showed performance gains in InfluxDB 3.0 that are orders of magnitude better than previous versions of InfluxDB – and by extension, other databases as well. There are two key factors that influence these gains: 1. Data ingest, and 2. Data compression. This begs the question, just how did we achieve such drastic improvements in our core database? This post sets out to explain how we accomplished these improvements for anyone interested.
Microsoft Teams has become the go-to platform for seamless collaboration and communication. However, like any technology, performance issues can arise, and these issues affect user experience and productivity. For IT teams tasked with Microsoft Teams troubleshooting, having access to comprehensive data is key. In this blog, we explore the challenges faced by IT teams and how harnessing more data can make the process significantly easier.
Recently I caught up with Jamie Allen on Episode 67 of the Slight Reliability podcast to discuss the idea of a single pane of glass (SPOG). Jamie had written an article titled The Single Pain of Glass which coincidentally was what I titled Slight Reliability Episode 10. I thought given our shared use of puns and this topic that it was worth a conversation! So, what is a single pane of glass? Is it an idea with practical application? How does it fit into the world of modern observability?
Almost every study examining the hourly cost of outages invariably leads to a clear and undeniable conclusion: outages are expensive. According to a 2016 study, the average cost of downtime was estimated at approximately $9,000 per minute. In a more recent study, 61% of respondents stated that outages cost them at least $100,000, with 32% indicating costs of at least $500,000 and 21% reporting expenses of at least $1 million per hour of downtime.
At Progress Flowmon, we continue to develop and improve the Flowmon product family. The latest update takes the core Flowmon product to release 12.3 and updates our industry-leading Anomaly Detection System (ADS) to version 12.2. In this blog, we highlight several of the improvements.
Historical Trends is a new functionality introduced with Flowmon 12.3 that will enable you to easily compare your current network traffic with historical values and gain new valuable insights.
The importance of the network to businesses has increased over the years (obviously). Nowadays, they are the main way that work gets done - they're the main way anything gets done. Consequently, how organizations measure their performance needs to change as well. Rather than just focus on network availability or simple uptime, they need to dig deeper and monitor User Experience. EXperience Level Agreements (XLA) as opposed to the traditional Service-Level Agreements help them reach that goal.
Microsoft recently announced changes to Azure Active Directory. Today’s article covers the changes, providing sources for considerations, and how Exoprise’s service solutions will be affected.
In today's rapidly evolving technological and business landscapes, staying competitive requires more than just a great product or service. It demands a technological edge that can drive efficiency, innovation, and overall growth. This is where partnering comes into play - it's like turbocharging your business engine. Today, meshIQ is looking to turbocharge our sales teams, processes, and reach by adding power via partnerships.
Understanding the impact of each of your deployments is crucial, especially as they become increasingly frequent. Chances are, your team is either aiming to increase shipping velocity or has already started deploying "continuously" (which is to say, multiple times a day). The biggest tech teams at the likes of Amazon and Google deploy thousands of times daily, and Atlassian has found that 75% of enterprise DevOps teams call deployment frequency their most important success criteria. And while CD comes with a host of well-established benefits, it also introduces a heightened risk of introducing new errors and issues.
The past decade has seen a drastic growth in the adoption of public cloud. One of the primary reasons for this is its cheaper infrastructure and ease of scale. With such rapid adoption of public cloud, the need for infrastructure automation also arises. This is because teams want to quickly provision infrastructure and automate tasks that previously took weeks in the case of traditional data centers, down to minutes in the public cloud.
Prometheus is a platform for real-time systems and event monitoring and alerting. The Prometheus project is free, open-source, and available on GitHub. Originally developed at SoundCloud, Prometheus became a project of the Cloud Native Computing Foundation in 2016, alongside other popular frameworks such as Kubernetes. The core of the project is the Prometheus server, which acts as the system’s “brain” by collecting various metrics and storing them in a time-series database.
Building and deploying highly scalable, distributed applications in the ever-changing landscape of software development is only half the journey. The other half is monitoring your application states and instances while recording accurate metrics. There are moments when you wish to check how many resources are being consumed, how many files are under access by the specialized process, etc. These metrics provide valuable insights into our tech stack execution and management.
Apache Kafka is an open-source distributed streaming system that has grown in popularity and usage across the technology industry. Originating from LinkedIn and now part of the Apache Software Foundation, Kafka provides a robust and scalable platform. It’s uniquely designed with an architecture that includes both a storage layer and a compute layer.
One to One Plus is a cloud-based, all-in-one software solution, tailored specifically to K-12 institutions. They provide a comprehensive suite of integrated IT asset management (ITAM), help desk software, and inventory management. As they describe on their website, they are “designed for K-12, built by K-12,” and appear to have been started by tech directors working in K12.
In a previous post, we looked at the remote debugging features of Visual Studio Code and how Lightrun takes the remote debugging experience to the next level. This post will examine how Lightrun enables Python remote debugging in PyCharm, the Python IDE from JetBrains.
Virtana’s AI-powered platform is at the forefront of IT infrastructure management, offering a comprehensive suite of tools and services that empower IT leaders to make informed decisions on how to forecast demand and streamline operations. The rapid evolution of technology has ushered in an era of complexity and dynamism that IT leaders must navigate effectively.
Kubernetes is one of the most important and influential technologies for building and operating software today because it’s so incredibly capable. It’s flexible, available, resilient, scalable, feature-rich and backed by a global community of innovators — that’s a pretty impressive list of intangibles to apply to any particular capability.
Getting your organization to invest in a new tool requires telling a story that helps decision-makers understand its benefits. In a recent webinar, our experts discussed how to define an ROI for Cribl Stream. They also shared a sample proposal you can use to craft the story you’ll tell to leadership, and gave some tips and tricks for justifying the purchase of these key tools for your business. Engineers and architects understand core technical problems better than anyone.
With the increasing reliance on SaaS applications in organizations and homes, monitoring connectivity and connection quality is crucial. In this post, learn how with Kentik’s State of the Internet, you can dive deep into the performance metrics of the most popular SaaS applications.
Throughout the software development process, engineers can use a number of methods and tools to ensure their code is efficient. When using Go, for example, there are built-in tools, including those for benchmarking and CPU/memory profiling, to check how efficiently code will run. Engineers can also run unit tests to validate code quality.
We are pleased to announce the availability of Network Management by Broadcom, which includes DX NetOps 23.3 and AppNeta. It assures end-to-end observability, minimizing the visibility gaps beyond the network borders to Cloud, SaaS, and Sites. The solution provides a unique and industry-leading unified Network Management approach, allowing organizations to optimize network operations, accelerate transformation and enhance connected experiences.
ING Group is a Dutch-based multinational banking and financial services corporation serving more than 38 million customers globally. It’s one of the biggest banks in the world, consistently ranking among the top 30 largest banks globally. At ING, our 20-year-old COBOL-based financial messaging system — which provides electronic instructions to enable financial transactions between banks and customers — is slowly becoming obsolete and difficult to integrate.
Observability is a critical aspect of modern software development and infrastructure management. It involves the ability to gain insights into the internal workings of your systems, applications, and services through monitoring and collecting relevant data. With the increasing complexity of technology stacks and the need for real-time visibility, observability has become a fundamental requirement for businesses across various industries.
In today’s fast-paced development environment, managing your project access tokens efficiently is more crucial than ever. That’s why we're excited to unveil a series of upgrades to Rollbar’s Project Access Token user interface to streamline your workflow and enhance your project’s security.
A migration from on-premises SQL Server to Azure SQL offers many customers a number of advantages. It can enable scalability, reduce costs, enhance security, ensure high availability, and simplifies maintenance. Many organizations are looking to equivalent cloud services to move on-prem workloads such as SQL databases to the cloud, freeing themselves from the overheads of purchasing, configuring and maintaining physical hardware and infrastructure.
Check our September 2023 health report on the top most popular cloud providers. We analyze the health of the cloud providers based on the number of outages and problems during the month. The source of the data is made available by the cloud providers themselves via their status page. We normalize it and use it to generate the report.
In Part 1 of this series, we talked about some challenges with building sufficient coverage for detecting security threats. We also discussed how telemetry sources like logs are invaluable for detecting potential threats to your environment because they provide crucial details about who is accessing service resources, why they are accessing them, and whether any changes have been made.
OpenSearch is a powerful, open-source analytics and search engine that can be utilized to construct custom search solutions for a broad variety of applications, from websites to enterprise-level systems. It enables flexible search and indexing abilities, making it suitable for a range of uses, a great example of this is scalability. OpenSearch is designed for horizontal scalability, enabling organizations to input additional nodes to their cluster as data volumes and query loads increase.
Like many companies, earlier this year we saw an opportunity with LLMs and quickly (but thoughtfully) started building a capability. About a month later, we released Query Assistant to all customers as an experimental feature. We then iterated on it, using data from production to inform a multitude of additional enhancements, and ultimately took Query Assistant out of experimentation and turned it into a core product offering.
With just 30 employees, Sentry Software might be considered a small company, but they’re prioritizing sustainability in a big way. As the makers of Hardware Sentry, an IT monitoring software, a large part of their business relies on maintaining optimal temperature conditions at their data centers — an operation that contributes to the company’s overall carbon footprint.
For many IT organizations, triaging or troubleshooting starts with assessing symptoms. As practitioners investigate the causal factors by answering each of the “5 whys,” logs are often where the actual root cause answers lie. This is even more true for issues related to configuration changes, change management, and security. However, diving into log data can be overwhelming as a first step due to the high volume and velocity of logs and missing context.
Elastic Observability is the premiere tool to provide visibility into web apps running in your environment. AWS App Runner is the serverless platform of choice to run your web apps that need to scale up and down massively to meet demand or minimize costs. Elastic Observability combined with AWS App Runner is the perfect solution for developers to deploy web apps that are auto-scaled with fully observable operations, in a way that’s straightforward to implement and manage.
In today’s world of relentless data growth, security-relevant logs represent a small snapshot of an organization’s overall environment. Teams are beset with a variety of data types, including performance metrics and traces, asset configuration and state, audit logs, and much more. On top of that, teams are expected to scan all of this to compare against industry best practices and join this data with logs and metrics for added context.
The cloud’s elasticity—the ability to scale resources up and down in response to changes in demand—as well as variable cost structures offer significant advantages, enabling enterprises to move from rigid capex models to elastic opex models where they pay for what they provision, with engineers in control and focused on innovation, becoming true business accelerators.
The most popular check that Oh Dear offers is, without a doubt, our uptime check. It's enabled for almost every site we monitor. By default, this check will notify you when your site returns a non-2xx response, but you can greatly customize that behavior. You can check if the response has certain headers, if the response contains a particular string, and more! Some of our users requested a new behavior: checking the absence of a string on the response.