Operations | Monitoring | ITSM | DevOps | Cloud

January 2024

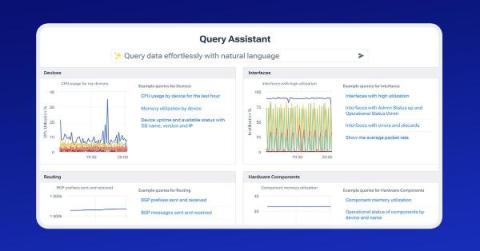
Introducing ManageEngine DDI: The key to unlocking the full potential of your critical network infrastructure

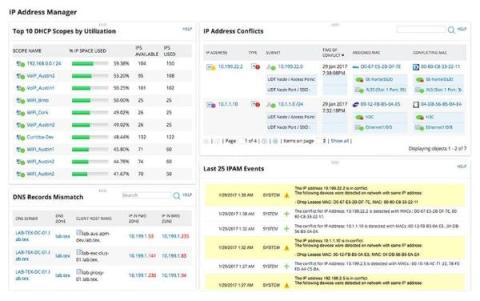
Building a future-ready network begins with integrating three core network services: DNS, DHCP, and IPAM, collectively known as DDI, which serves as the heart of network connectivity and operations.

Is Downdetector an Effective Monitoring Tool?

The internet has become an essential part of our lives, especially when it comes to business. Whether for work, communication, or entertainment, we heavily rely on the internet’s availability. However, when the internet goes down unexpectedly, it can be frustrating and disruptive. This is where Downdetector has become integral for many people in determining the status of an internet service.

Analyzing configuration problems with Icinga 2

Today, I want to showcase an old, but still very useful, tool when it comes to analyzing and debugging an Icinga 2 configuration: the icinga2 object list command. It can be helpful in a variety of situations, for example when you want to verify that a config change has the desired effect, but also for finding out where something is set in the configuration.

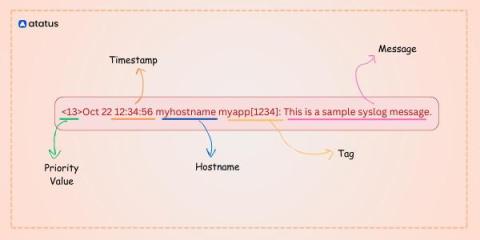
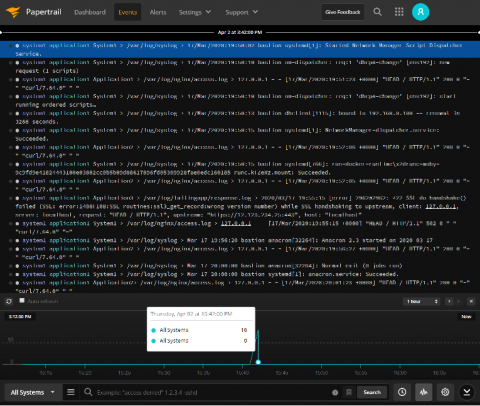
Understanding Syslog Formats: A Comprehensive Guide

Syslog, short for System Logging Protocol, is a standard protocol used to send log messages and event notifications across a network. It plays a crucial role in monitoring and managing the health, performance, and security of systems and applications. Syslog was originally developed as a part of the BSD operating system, but many other operating systems and network devices have since adopted it. One of the key aspects of syslog is its flexible and standardized message formats.

Parallel Scheduling Is Now GA: Detect Regional Outages Up to 20x Faster

I am happy to announce that Checkly now supports parallel scheduling as a new way to schedule your checks. Parallel scheduling allows you to reduce mean time to detection, provide better insights when addressing outages, and give improved accuracy in performance trends, making it a powerful new feature for all Checkly users.

OpenTelemetry and Grafana Labs: What's new and what's next

A new year is a natural time to reflect on past achievements — and consider future aspirations. When I think about the observability space, specifically, in 2023, OpenTelemetry felt omnipresent. It was a hot topic at every industry event, with at least one dedicated talk at ObservabilityCON, Monitorama, PromCon, and KubeCon + CloudNativeCon, both NA and EU. A notable highlight from KubeCon was OpenTelemetry going GA, marking a significant milestone in the project’s development.

Supercharge Your Azure Savings Strategy with Azure Dev/Test Subscription

An Azure subscription is a fundamental concept in the billing and management structure of Microsoft Azure. It serves as an agreement with Microsoft to use Azure services, where the services used are either paid for or are part of a free offer.

Never miss an Outage: Improve your monitoring with Checkly's Parallel Scheduling

In this video, you will learn how to leverage Checkly's parallel scheduling feature to simultaneously monitor and test all your essential production targets. This knowledge will help you reduce your mean time to detect outages, assess whether production problems are regional or global, and enhance your monitoring data granularity.

Mastering the Cloud Migration: The Ultimate Guide to Cloud Migration Tools

Clouds aren’t magical data farms in the sky; they’re the backbone of modern infrastructure. Whether you’re using a public cloud, private cloud, or a mix of both, migrating to cloud-based infrastructure is not just a trend; it’s a strategic move for businesses seeking agility, scalability, and cost-efficiency. Cloud migration—moving data, applications, and workloads to the cloud (or between clouds)—is a critical step in this transformation.

Log Less, Achieve More: A Guide to Streamlining Your Logs

Businesses are generating vast amounts of data from various sources, including applications, servers, and networks. As the volume and complexity of this data continue to grow, it becomes increasingly challenging to manage and analyze it effectively. Centralized logging is a powerful solution to this problem, providing a single, unified location for collecting, storing, and analyzing log data from across an organization’s IT infrastructure.

Evaluating New Tools with Cribl

Discover how Cribl's suite of products can be utilized to assess security and analytics tools, thereby reducing the duration of POVs and simplifying the process of tool migrations. Cribl, the Data Engine for IT and Security, empowers organizations to transform their data strategy. Customers use Cribl's suite of products to collect, process, route, and analyze all IT and security data, delivering the flexibility, choice, and control required to adapt to their ever-changing needs.

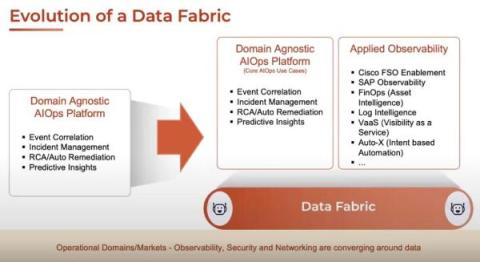
The Rise of Applied Observability, AIOps, and GenAI in Enterprises

CloudFabrix’s Macaw Conference for Observability and AIOps garnered traction and showcased modern solutions to modern IT problems in enterprises. This is a summary of the conference. CloudFabrix CMO – Shailesh Manjrekar kicked off the conference by delivering the keynote by talking about the General Market Trends & highlighting the Modern IT challenges faced by Enterprises during their Digital Transformation journey.
Sponsored Post

5 Guiding Principles of Digital Business Observability

Modern data-driven organizations are synergizing operations observability, business intelligence, and data science with digital business observability programs that break down data silos, increase productivity, and drive innovation. Digital business observability combines IT and business data with cutting-edge data science techniques, enabling deeper analysis and unlocking valuable insights that propel innovation across use cases from sales and marketing to product design and financial operations.

Elasticsearch vs MongoDB - Battle of Search and Store

Elasticsearch is primarily a search engine optimized for fast, complex search queries, especially text searches, and is often used for log and event data analysis. MongoDB, on the other hand, is a general-purpose, document-oriented database that excels in storing and retrieving structured and semi-structured data. It is commonly used for mobile, social, and IoT applications. While Elasticsearch provides superior search capabilities, MongoDB offers more robust data processing and storage features.

Why companies migrate from OSS to Grafana Cloud for metrics management

In 2022, we introduced Grafana Mimir, the most scalable and performant open source time series database in the world. And since its launch, we’ve been busy, increasing Mimir’s scale, making it easier to get started, and boosting query performance. But even with these advancements, we understand the challenges that can come with a self-hosted and self-managed OSS tool.

A Step-by-Step Guide to Conducting a Website Security Audit

In the modern world, few things are as important for a business as its website. That's because websites are the main interface through which customers tend to interact with your brand and the main location at which customers make orders. For other types of business, websites are the primary point of communication between clients and employees. That huge level of importance brings with it a huge sense of vulnerability.

How to Leverage Generative AI in IT Operations

Although Generative AI traces its origins to the earliest machine learning models in the 1950s, its popularity and usage has accelerated exponentially over the past year after OpenAI issued the first public release of its ChatGPT (generated pre-trained transformer) AI chatbot in December 2022. Generative AI holds the potential to transform many professions including IT operations.

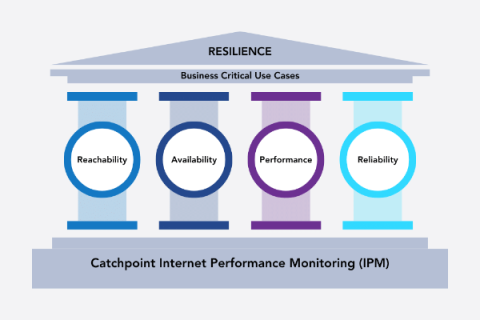
Mastering IPM: The Essential Customer Experience Monitoring Framework

In the previous installment of our Internet Performance Monitoring (IPM) Best Practices Series, we explored the critical importance of monitoring what matters, from where it matters. Now, we pivot to a core aspect of Internet Resilience: Customer Experience (CX). This blog explores the critical role of IPM in achieving faster Mean Time to Detect (MTTD) and Mean Time to Recover (MTTR).

Exploring Splunk Alternatives: Deep Dive into Log Analysis

Splunk is a powerful and widely used software platform designed for searching, monitoring, and analyzing machine-generated data, including logs, events, and other forms of structured and unstructured data. Originally developed for IT operations and log management, Splunk has expanded its capabilities to address a broader range of use cases across various industries.

K-12 Status Pages - How to Reduce Ticket Burden for K-12 Schools

In 2024, the average K-12 school or educational institution relies on many cloud providers, hosted services, and websites. Quite often, the services these K-12 schools rely on exceed over 40 different platforms – from communication tools like Zoom to learning management systems (LMS) such as Canvas or Blackboard. With this many services, the ticket burden on K-12 system admins and IT teams can be overwhelming.

Elevating DEX: Nexthink's AppLearn Acquisition Marks a New Era

In the early days of Nexthink we had a whimsical way of articulating what we were working to achieve. “We want to develop a kind of digital guardian angel,” we’d say, “sitting on the shoulder of the employee, ensuring they are getting the most out of every working hour: productive and enjoying their work, without sacrificing a single minute to IT issues or application problems.".

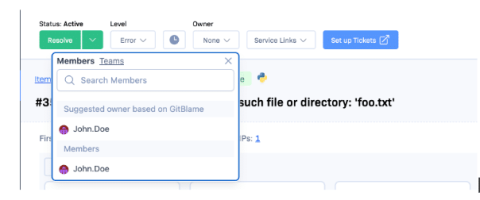
"Secret" elmah.io features #1 - Include source code in errors

This is a new series of blog posts that I have been wanting to write for a while. elmah.io offers a large range of features both through the UI and the list of integrations. While basic error monitoring is used by all of our users, there are features available that can provide huge value but are not so commonly used or known. In this first part, I'll go through including source code in errors and how it will make it easier to debug errors.

Enterprise Network Monitoring: Pro Tips for Optimal Performance!

In the battleground of modern business, your enterprise network is the backbone, and trust me, keeping it in top-notch shape is non-negotiable. Your network is like a Spartan soldier, charging into the chaos of the IT battlefield. But even Spartans need their shields, right? That's where Enterprise Network Monitoring comes in – it's your shield against network slowdowns & bottlenecks, security breaches, and those random performance hiccups.

Monitor processes running on AWS Fargate with Datadog

Serverless platforms like AWS Fargate enable teams to focus on delivering value to customers by freeing up time otherwise spent managing infrastructure and operations. However, maintaining a deep level of observability into applications running on these fully managed platforms remains challenging.

Seven innovative observability features to explore in the new year

See some of our recent observability feature and product releases that correlate application security and performance with your business critical KPIs. In our latest App Attention Index, consumers showed unprecedented levels of scrutiny when it comes to app experiences, with nearly two-thirds (62%) revealing their digital expectations are far higher now than they were just two years ago. In fact, 77% reported discontinued use or deletion of an app due to poor performance — within the past year.

Mastering Network Troubleshooting: Deep Dive into Flowmon Monitoring Center

Watch our insightful webinar as we explore the intricacies of troubleshooting network issues using the Flowmon solution. This session will focus on leveraging the Flowmon Monitoring Center for proactive analysis and resolution of common challenges, including clients encountering difficulties connecting to servers and bandwidth utilization concerns.

Optimizing APM Costs and Visibility with Cribl Stream and Search

OpenTelemetry is starting to gain critical mass due to its vendor neutrality and having worked in the APM space for the last five years. I can see the appeal. Using OpenTelemetry libraries to instrument your code frees you from putting vendor libraries in your codebase. The other challenge most customers face is balancing cost versus visibility. While effective, most APM solutions are costly.

Continuous Monitoring Best Practices

In today’s dynamic digital landscape, where security breaches pose great financial threats, adopting the best monitoring practices becomes a strategic necessity for your business. By safeguarding your business from security vulnerabilities, software bugs, and potential risks, continuous monitoring for cybersecurity lays a strong foundation for the sustained growth and success of your organization’s security.

Major Hospital System Cuts Azure Sentinel Costs by Over 50% with Observo.ai

A large North American hospital system saw rapid increases in its Microsoft Azure Sentinel SIEM expenses primarily due to the escalating growth of security telemetry data. Their primary data sources were Fortinet Firewall logs, Windows Event Logs, Active Directory, Domain Controller, and DNS logs.

On-Demand Webcast: Unleashing FinOps

The growing popularity of FinOps is creating an opportunity for you to level up your entire approach to IT financial and cost management by embracing FinOps as a foundational discipline that you apply to your entire technology estate. It’s not just about saving money — it’s about making smarter, data-driven decisions that fuel growth and innovation.

SigNoz - Open-Source Alternative to DataDog

More and more companies are now shifting to a cloud-native & microservices-based architecture. Having an application monitoring tool is critical in this world because you can’t just log into a machine and figure out what’s going wrong. We have spent years learning about application monitoring & observability. What are the key features an observability tool should have to enable fast resolution of issues. In our opinion, good observability tools should have.

Getting Started with OpenTelemetry Visualization

OpenTelemetry is a Cloud Native Computing Foundation(CNCF) project aimed at standardizing the way we instrument applications for generating telemetry data(logs, metrics, and traces). However, OpenTelemetry does not provide storage and visualization for the collected telemetry data. For OpenTelemetry visualization, you need to use a backend that can ingest the collected data and provide a web UI to visualize it.

Up Your Observability Game With Attributes

Splunk Observability Cloud includes powerful features which automatically identify patterns within your data to surface trends. The resulting insights tell you why some customers aren’t getting an optimal experience from your application, and how you can improve it. Unlocking these features requires attributes to be included with your application traces. But how do you know which attributes are the most valuable for your application and business?

The Top 15 New Relic Dashboard Examples

Among the arsenal of tools available for monitoring and managing an organisation’s mission critical applications and service, New Relic is a popular choice for many users. In our article, we will delve into the world of New Relic Dashboards, shedding light on the best use cases that demonstrate their visualisation capabilities.

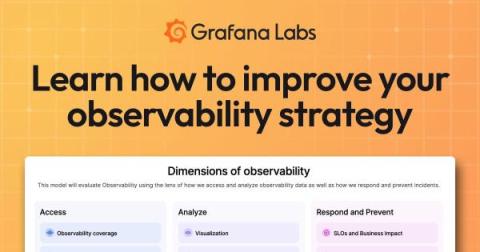
How to improve your observability strategy: Introducing the Observability Journey Maturity Model

While many segments of the IT market move quickly, the observability space seems to move at lightning speed. Fueled by open source innovation, observability toolsets and best practices constantly evolve. Sometimes, it can be tough to keep up — and even tougher to know where your own observability strategy stands. That’s the exact challenge we aim to address with our new Observability Journey Maturity Model.

Pandas Time Series: A Primer

Time series data is a fundamental part of numerous real-world applications, from stock market analysis to weather forecasting to financial market forecasting. Effectively managing, analyzing, and visualizing time series data is essential for extracting meaningful insights and making informed decisions. This is where pandas time series comes into play. It can help you organize, transform, and visualize data and examine details for a specific time period.

5 Important Reasons Why You Need Application Observability

Application performance monitoring (APM) has been around for a long time. Odds are if you’re tasked with overseeing app performance, you’ve had to deal with this technology to get an understanding of your applications and any issues that can arise in the name of troubleshooting. But there’s a new approach you should consider: application observability.

Now Available: Honeycomb Launches Data Residency in Europe

At Honeycomb, we are very concerned about privacy and data sovereignty—it’s something we take very seriously, and in an effort to serve our customers better, we’re thrilled to announce that we now offer data residency in Europe. This new instance will allow Honeycomb customers to store their data in the US, in Europe, or both. Let’s talk about the details.

Kubernetes Volume Snapshots: Ensuring Data Integrity and Recovery

In Kubernetes, managing containerized applications is essential for modern IT. As more systems move to cloud-native setups, there's a growing need for reliable data management solutions in Kubernetes clusters. Imagine a situation where important application data faces an unexpected issue or, even worse, gets corrupted. Without a reliable backup plan, the consequences could be severe. This is where volume snapshots come in handy.

Embracing IPv6: Anodot's Guide to a Smooth Transition

Mark your calendars: From February 1, 2024, AWS is introducing a $0.005 hourly charge for all public IPv4 addresses. With IPv4 addresses becoming rarer and pricier, AWS is pushing us to be more IPv4-efficient and highlights the urgent need for businesses to adopt IPv6. Where’s This Change Happening? This isn’t just a small tweak, it will affect all AWS services that use public IPv4 addresses. We’re talking about everything from EC2 and RDS database instances to EKS nodes.

50 Essential Shadow IT Statistics for 2024

From reducing risk to optimizing efficiency, your organization has many compelling reasons to enforce policies and procedures. But what happens when a policy hinders productivity more than it helps, causing employees to skirt the rules? For IT departments, this ever-present dilemma is called shadow IT. As cybersecurity risks rise in 2024, it’s more relevant than ever. Before we get into our list of shadow IT statistics, let’s review the basics.

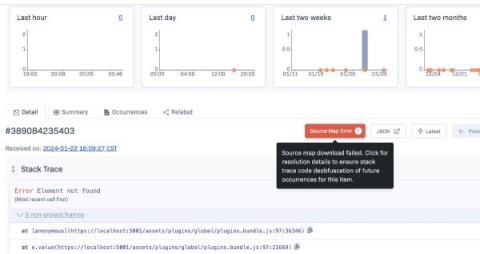
New Source Map Error Workflow

We're excited to unveil the latest enhancements to Rollbar’s Source Map handling. This new feature, directly influenced by user feedback, simplifies your debugging experience, making Source Mapping more intuitive and user-friendly. Source Map issues are a frequent concern, ranking among the top five monthly support requests. We recognize the challenges you face when dealing with errors that don't make sense due to Source Mapping configuration issues.

Elastic Observability monitors metrics for Microsoft Azure in just minutes

Developers and SREs choose Microsoft Azure to run their applications because it is a trustworthy world-class cloud platform. It has also proven itself over the years as an extremely powerful and reliable infrastructure for hosting business-critical applications. Elastic Observability offers over 25 out-of-the-box integrations for Microsoft Azure services with more on the way. A full list of Azure integrations can be found in our online documentation.

AI + Automation: A Trusted Copilot for ITOps in the Digital Age

We’re living in an unprecedented moment in time. Data is reshaping our world. From enterprise networks and the cloud to the smart refrigerators in our kitchens and the watches on our wrists, data is proliferating at an unprecedented scale, both in volume and velocity. As data owners, we continuously strive to monitor and derive intelligent insights from this data so we can catch performance anomalies and issues – from misconfigured systems to a skipped heartbeat – and quickly intervene.

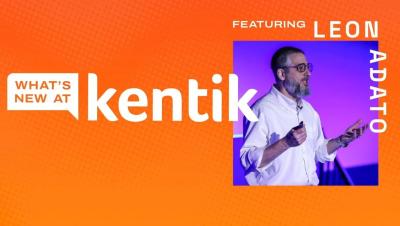
What's New at Kentik, Episode 3

Host Leon Adato dives into the latest offerings and insights from Kentik, the network observability company as we begin 2024. Whether you're a seasoned professional or new to the field of network observability, this episode is packed with information, humor, and insights into Kentik's latest developments. Don't forget to hit like and subscribe for more content from Kentik.

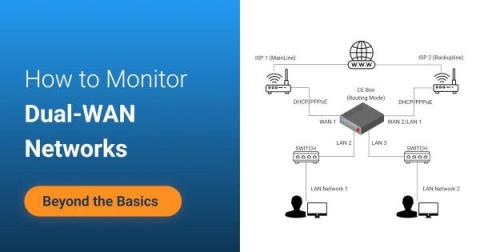
How to Monitor Dual-WAN Networks: Beyond the Basics

Dual-WAN networks have become a go-to solution for businesses looking for enhanced reliability and network performance. With not one but two Internet connections and the safeguard of a firewall, Dual-WAN configurations offer a robust solution – if one connection fails, the other seamlessly takes over. But, it's not a matter of if one will fail, but rather when.

OpenTelemetry vs Prometheus Detailed Comparison

Both OpenTelemetry and Prometheus are open-source projects under the Cloud Native Computing Foundation. OpenTelemetry is a more comprehensive observability framework with support for metrics, traces, and logs. In contrast, Prometheus is focused specifically on time-series metrics. OpenTelemetry is more versatile, and if you’re confused between choosing between the two, go for OpenTelemetry. We will delve deeper into the reason for choosing OpenTelemetry over Prometheus in this article.

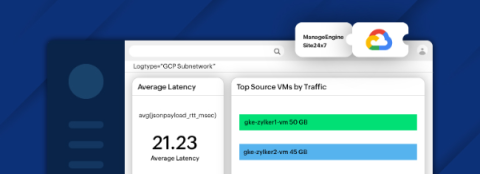
Forward logs from Google Cloud Platform to Site24x7 with Dataflow

Google Cloud Platform (GCP) enables organizations to create and scale applications. Activities in applications, whether on Compute Engine or other services from virtual machines to serverless environments on GCP, produce a significant amount of logs. Logs play a crucial role in helping you achieve effective observability and troubleshooting. But the logs may experience irregular surges in data ingestion during major system events, posing challenges for network overhead.

Comparing The Top 9 Datadog Alternatives in 2024

Are you looking for a DataDog alternative? Then you have come to the right place. In this article, we will go through top 9 DataDog alternatives. One of the biggest challenge users face with DataDog is its pricing policies. Its complex SKU-based pricing policy leads to unpredicatble bills. DataDog is a cloud monitoring software that provides an array of tools for monitoring different aspects of your application and infrastructure.

Navigating IT and Security Consolidation in 2024

Please join Cribl’s Ed Bailey and Jackie McGuire for a dynamic discussion around IT and Security vendor consolidation in 2024. The current economic landscape poses challenges for companies to sustain operations without being profitable or having a clear path to profitability. As a response, businesses are either merging with similar companies or becoming part of larger entities through acquisitions. Change is afoot, so join the conversation as we dive into the ongoing transformations, discussing the implications for security and observability. Get ready for an engaging discussion.
Sponsored Post

Avantra sets industry benchmark with outstanding NPS and CSAT scores

Today, I am thrilled and privileged to announce a remarkable achievement at Avantra - a landmark feat in customer satisfaction and loyalty! For the third consecutive year, our relentless commitment to excellence has culminated in setting the industry benchmark with an exceptional Net Promoter Score (NPS) of +63 and a Customer Satisfaction (CSAT) score of 91%. These numbers aren't just figures; they are a testament to the trust and loyalty our customers have in us.

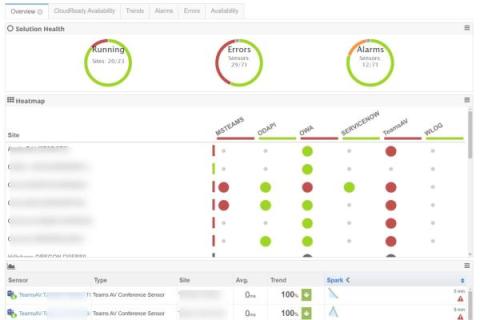
Microsoft Teams Outage, TM710344: Some users may experience multiple issues with their Microsoft Teams

Earlier today, Microsoft Teams experienced service degradation causing multiple issues for users. Users attempting to log in were presented with an “oops” page, while already-logged-in users were missing messages, experiencing issues with loading messages in channels and chats and preventing them from viewing or downloading media (images, video, audio, etc…) Exoprise proactive monitoring first detected the outage in North America starting shortly before 11 AM EST.

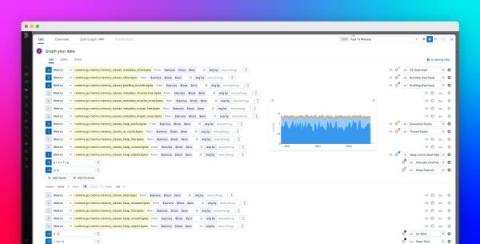
Go memory metrics demystified

For engineers in charge of supporting Go applications, diagnosing and resolving memory issues such as OOM kills or memory leaks can be a daunting task. Practical and easy-to-understand information about Go memory metrics is hard to come by, so it’s often challenging to reconcile your system metrics—such as process resident set size (RSS)—with the metrics provided by the old runtime.MemStats, with the newer runtime/metrics, or with profiling data.

Inside TeleTracking's journey to build a better observability platform with Grafana Cloud

Oren Lion, Director of Software Engineering, Productivity Engineering, and Tim Schruben, Vice President, Logistics Engineering, both work for TeleTracking, an integrated healthcare operations platform provider that is Expanding the Capacity to Care™ by helping health systems optimize access to care, streamline care delivery, and connect transitions of care.

Why Knowing the Front-End and User's Experience of Your Platform is Key to Understanding How that Platform is Working

We have all been there. When you are trying to buy a ticket and the app crashes or loads the next web page when booking a holiday only to find it takes forever and appears to hang. Our frustration level increases and if it continues, we will exit and go elsewhere. With banking apps though, we won’t move straight away but repeated bad experiences here will be remembered and eventually will make us move.

TM710344: IT Admins Scramble to Identify Source of Microsoft Teams Incident

Did Microsoft Teams chat seem a little quieter on Friday, January 26th? Maybe messages seemed to be coming in choppily or delayed – possibly some issues logging into Teams. It wasn’t a coincidence, Microsoft Teams started experiencing issues earlier in the day and at 11:45 a.m. ET issued incident TM710344 with the following message on X – formerly known as Twitter.

WhatsUp Gold & Flowmon Integration

Watch this video to learn more about WhatsUp Gold & Flowmon's out-of-the-box integration. You will learn how to integrate traditional IT Infrastructure metrics, such as CPU utilization or memory consumption on servers, with Network performance metrics, such as server response time coming from the Network traffic provided by Flowmon.

Securing the Future: The Critical Role of Endpoint Telemetry in Cybersecurity

As IT managers and security practitioners navigate the complex terrain of modern cybersecurity in 2024 and beyond, the importance of endpoint telemetry cannot be overstated. This sophisticated technology involves meticulously gathering and analyzing data from various network endpoints, such as personal computers, mobile devices, and the ever-growing network of IoT devices.

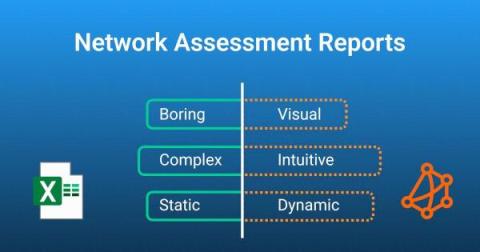
Unlocking the Potential of Visual Network Assessment Reports

Today, we delve into a pivotal tool that holds immense value for both network admins and business owners alike: Network Assessment Reports (NARs). Not only will we explore the significance of network assessments in maintaining a well-functioning network, but we'll also guide you on creating dynamic visual network assessment reports. These reports serve as a comprehensive source of crucial information, offering insights into network issues, areas for improvement, and much more.

What Did the Teams Incident Do To Your Company's Productivity on Friday Afternoon?

Judging by the tweet storm (or is that called an X storm now?), productivity in corporate North America took a big hit as the week ended. Microsoft Teams had an issue that was “impacting multiple Microsoft Teams features”. Users reported problems of: messages not posting, inability to access files, and interrupted workflows.

Observability with OpenTelemetry and Checkly

Observability isn't just a buzzword; it's a vital compass guiding us through the maze of system health and performance. As we’ve adopted microservice architectures, the ability to know ‘what is currently happening in our system’ has diminished as our operational resilience has increased. We find services scattered among a maze of interconnections and interdependencies. And even the logs that used to guide are now scattered throughout this maze.

DataDog vs Grafana - Key Features & Differences

DataDog is a paid SaaS tool that provides a range of products for monitoring applications and tech infrastructure. While Grafana is an open-source web visualization tool that can be used with a variety of data sources to create dashboards. If you're looking for a one-stop observability solution and price is not a concern for you, choose Datadog. In case you're looking to visualize data from a lot of different data sources especially time-series data, then choose Grafana.

Scaling Platform Engineering: Shopify's Blueprint

Platform Engineering is a hot topic these days. We’ve seen the hype around it in 2023, and I expect we shall see it becoming production-grade as we move into 2024. I wanted to look into this topic, and learn from those who’ve already implemented it at scale: the e-commerce hyperscaler Shopify. In the latest episode of OpenObservability Talks, I had the pleasure of hosting Aparna Subramanian, the Director of Production Engineering at Shopify.

Beyond Logs, Metrics and Traces

Despite what you may have seen and heard, the intersection of logging, metrics and tracing does not tell the whole story about observability. Our systems emit telemetry, and those previously noted telemetry signals are considered the “three pillars” of observability. They’re all important, but by themselves, they aren’t observability. Many users I see day in and day out find themselves with broken observability even though they’re collecting those three pillars.

Meeting the SEC's New Cybersecurity Rules: How Flowmon Empowers Companies to Comply

The much-anticipated cybersecurity rules by the US Securities and Exchange Commission (SEC) for public companies have arrived, signaling a significant step forward from the proposed rules released in March 2022. These final rules, effective July 26, 2023, introduce new obligations that public companies must adhere to, promising a more secure and transparent corporate landscape. However, these regulations bring significant compliance challenges and litigation risks.

Getting started with Application Observability for Java

Links: Description: Get started with instrumenting Java applications with Grafana Cloud to observe them, detect anomalies, and find root causes. In this video, Grafana Developer Advocate Leandro Melendez outlines how to quickly get started with Application Observability for Java based on these three easy steps: Download the Grafana instrumentation agent Instrument an application and send telemetry data to the Grafana Cloud OTLP Endpoint Observe the service in Application Observability.

RabbitMQ monitoring with OpenTelemetry

More about SigNoz: SigNoz - Monitor your applications and troubleshoot problems in your deployed applications, an open-source alternative to DataDog, New Relic, etc. Backed by Y Combinator. SigNoz helps developers monitor applications and troubleshoot problems in their deployed applications. SigNoz uses distributed tracing to gain visibility into your software stack. If you need any clarification or find something missing, feel free to raise a GitHub issue with the label documentation or reach out to us at the community slack channel.

AI Explainer: Demystifying Embeddings

In a previous blog post, entitled "What's Our Vector, Victor?," I went through the basics of vector databases. That post explained how vector databases are used by large language models, and one of the concepts included was this brief explanation of embeddings: So, let's dig in a little more on this. Embeddings, in the context of vector databases, refer to vector representations of data points or entities within the database.

Sending Go Application Logs to Loggly

If you’ve been building web apps long enough, you’ve certainly read through your fair share of logs. One of the more painful parts of going through web app logs is getting them all to the same place. It’s only then you can review your logs and troubleshoot your applications. In this article, we’ll build a simple Go web app to send logs to SolarWinds® Loggly®.

Accelerating Detection to Resolution: A Case Study in Internet Resilience

Today, any revenue-generating website is like a house of cards, poised to collapse with multiple points of failure. The modern service delivery chain relies on intricate multi-step transactions and third-party API integrations, making the system more complex and interconnected. A single point of failure in the architectural diagram above can lead to slowdowns and outages with tangible consequences on your bottom line.

Feature Spotlight - Introducing Smart Agent for Cisco AppDynamics

Cisco AppDynamics Smart Agent will transform how you manage your agent lifecycle. It orchestrates your agent lifecycle tasks through an enhanced UI, or through an advanced CLI. Learn about the recently released Smart Agent and Agent Management for Cisco AppDynamics in the video below. It includes an overview and short demonstration of the primary use case: identifying agents that must be updated, and how to perform agent updates in bulk.

Troubleshoot streaming data pipelines directly from APM with Datadog Data Streams Monitoring

When monitoring applications with streaming data pipelines, there are additional complexities to consider that are not present in traditional batch-processing systems. Whether you’re using streaming data pipelines to power a digital trading platform, capture sensor data from an IoT device, or recommend news articles to users, it can be challenging to identify the root cause of delays when you’re dealing with distributed systems, real-time data, and the dynamic nature of events.

How to manage Grafana instances within Kubernetes

If you’re using Grafana and Kubernetes, we’ve got exciting news — Grafana Labs will be maintaining and managing the Grafana Operator, the open source Kubernetes operator that helps you manage your Grafana instances within and outside of Kubernetes. This significant move not only elevates the Grafana Operator to an officially supported tool but also cements its place as a staple for managing Grafana as code, especially for users keen on adopting GitOps principles.

How to deal with API rate limits

When I first had the idea for this post, I wanted to provide a collection of actionable ways to handle errors caused by API rate limits in your applications. But as it turns out, it’s not that straightforward (is it ever?). API rate limiting is a minefield, and at the time of writing, there are no published standards in terms of how to build and consume APIs that implement rate limiting.

Continuous Monitoring: A Definitive Guide

Continuous monitoring is the backbone of staying ahead in your business, maintaining a constant watch on your company’s activities. It adapts to the demanding needs of modern times, whether for compliance checks, continuous control, and infrastructure monitoring or defending against cyber threats. However, before the widespread adoption of continuous monitoring, companies relied on periodic audits, manual assessments, and sporadic checks to monitor their systems.

Introducing 'Cribl Stream Fundamentals'

Join Cribl's Ed Bailey and Cjapi's James Curtis for an engaging discussion about James' new book, 'Cribl Stream Fundamentals.' We will explore why James wrote the book and what he plans next. Additionally, we'll discuss his perspective on the challenges practitioners will face in 2024 and how teams should prepare for the year ahead.

A guide to effective network management using OpManager

In today’s interconnected world, managing networks has become increasingly complex and extends across wired, wireless, and virtual IT environments. Network administrators are constantly in need of efficient tools to navigate this complexity. With numerous network management solutions available, it is crucial to identify the right one that strikes a balance between reliability, effectiveness, and affordability.

Monitoring your Spring Boot Application using OpenTelemetry

OpenTelemetry can auto-instrument your Java Spring Boot application to capture telemetry data from a number of popular libraries and frameworks that your application might be using. It can be used to collect logs, metrics, and traces from your Spring Boot application. In this tutorial, we will integrate OpenTelemetry with a Spring Boot application for traces and logs. OpenTelemetry is a vendor-agnostic instrumentation library that is used to generate telemetry data like logs, metrics, and traces.

Docker Logging One-Stop Beginner's Guide

Log analysis is a very powerful feature for an application when it comes to debugging and finding out which flow is working properly in the application and which is not. In a world of containerization and cloud computing, it is essential to understand logs generated by a Docker environment to maintain healthy performing applications. In this article, we will discuss log analysis in Docker and how logging in Docker containers is different than in other applications.

Understanding Flame Graphs for Visualizing Distributed Tracing

In the ever-evolving world of software development, one constant remains - the pursuit of better performance. As applications grow in complexity and demand, the need for tools to uncover performance bottlenecks becomes paramount. Flamegraphs, a brainchild of Brendan Gregg, has emerged as an important visualization of insight, showing those dark corners of your codebase that need optimization.

The Top 15 Splunk Dashboard Examples

The ability to extract meaningful insights from your wealth of organisational information is often the key differentiator between successful businesses and those struggling to stay competitive. Splunk, a renowned leader in the realm of data analytics and visualisation, has emerged as a powerful ally in this quest for actionable knowledge.

The Cloudification of Telcos and the Evolution of the Telecom Ecosystem

In the rapidly evolving telecom sector, the concept of “cloudification” is not just a trend but a transformative shift, reshaping how services are delivered and managed. This change is underpinned by modern software architectures featuring modularity, microservices, and cloud-native designs. As we embrace this new era, marked by the rise of “netcos” and “servcos,” we must also navigate the complexities it brings.

The Cost Crisis in Observability Tooling

The cost of services is on everybody’s mind right now, with interest rates rising, economic growth slowing, and organizational budgets increasingly feeling the pinch. But I hear a special edge in people’s voices when it comes to their observability bill, and I don’t think it’s just about the cost of goods sold.

Cisco AppDynamics reimagines agent lifecycle management with Smart Agent

Cisco Full-Stack Observability and Cisco AppDynamics are simplifying agent lifecycle management by centralizing control through UI and leveraging the Smart Agent to save you time and effort. We have come to rely on agents to help provide insights into our applications and environments through analysis with application performance monitoring (APM) solutions. And with the advent of OpenTelemetry™, we have even more ways to ingest data.

Smart Agent for Cisco AppDynamics is here!

Unlock business and performance insights... See how Smart Agent dramatically simplifies application instrumentation through intelligent agent automation and lifecycle management — saving you time, accessing new capabilities and gaining business context. Simplify your agent management in a few clicks... Save time and effort installing and managing agents at scale with a centralized agent management console. AppDynamics provides a complete agent inventory, managed by Smart Agent, to quickly flag and upgrade out-of-date agents to support better version compliance and reporting.

How NetSecOps Can Improve Network and Security Collaboration

In recent years, the pace of IT and network modernization fueled by digital transformation has only continued to accelerate. At the same time, cyber threats have continued to grow more frequent and sophisticated. Given these trends, the move to establish enhanced collaboration between network and security teams, an approach known as NetSecOps, has moved from a nice-to-have to a fundamental imperative.

Juggling multiple projects: Effective strategies for agencies to monitor website performance

Imagine this familiar scenario: You're at the helm of an agency responsible for managing a plethora of websites, each as unique as the clients they represent. It's a balancing act of monumental proportions – ensuring every site remains flawlessly operational, all while juggling the diverse demands of your client portfolio. The challenge? Each website demands constant vigilance.

What Will 2024 Bring to the ITOps World? OpsRamp's Technology Leaders Make Their Predictions

If one story stands out in the tech industry for 2023, it was the coming-out party for generative AI. OpenAI’s ChatGPT artificial intelligence chatbot, which was publicly released late in 2022, seized the industry’s imagination in 2023, becoming the fastest-growing consumer application ever. The technology quickly evolved throughout 2023 with a paid subscription service; an API; iOS and Android versions; an enterprise version; plug-ins; and an AI image generator.

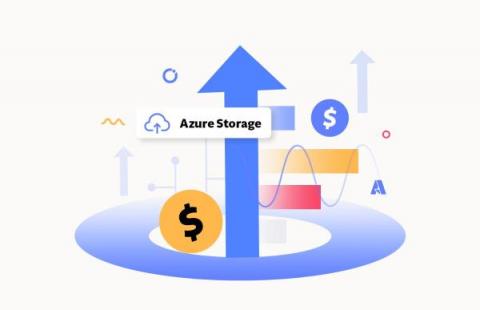
Azure Storage cost optimization to achieve maximum cost savings

Azure Storage Cost Optimization is a crucial aspect for organizations looking to harness the power of Azure storage while keeping expenses in check. This involves implementing strategies to minimize expenses, optimize resource utilization, and select appropriate storage types. It encompasses understanding and leveraging various features to optimize resource utilization, choosing the right storage types, and implementing best practices.

Azure Unit Economics for Crafting a Financially Sound Strategy

Embarking on a journey through the cloud landscape, Azure Unit Economics is a compass, guiding through the intricacies of financial optimization in the realm of Microsoft Azure. This blog post aims to clarify the complexity of Azure Unit Economics, underscoring its critical role in optimizing resource allocation and ensuring cost-effectiveness within the realm of cloud computing.

Grafana Beyla 1.2 release: eBPF auto-instrumentation with full Kubernetes support

We’re excited to announce that with the release of Grafana Beyla 1.2, Kubernetes support is now fully integrated. With this update, the Grafana Beyla configuration now “understands” Kubernetes semantics to provide a more fine-grained selection of services to instrument. Beyla users can decorate metrics and traces with the metadata of Kubernetes entities, such as pods and deployments, that run the automatically instrumented services.

Streamline Azure container monitoring with the Datadog AKS cluster extension

Azure Kubernetes Service (AKS) enables you to easily deploy and manage containerized applications in Azure while leveraging Microsoft resources such as development tools, security features, and more. As with any Kubernetes service, the sheer volume of containers being orchestrated makes monitoring AKS cluster health challenging, which can slow response times to critical incidents and create bottlenecks around long-term optimizations.

How to combine Playwright locators to test non-deterministic application flows

Sometimes, applications can behave differently even though your users do the same things. How can you test these non-deterministic flows? Learn in this video how Playwright's "locator.or()" method helps to write tests that can handle different application flows.

When to Automate Recurring Events

“Is it worth it?” is probably the most common question customers ask business architects and value advisors. Whether it’s a software deployment or process improvement, customers want to be assured that the effort and risk of a project delivers real value. That is the question people in my line of work spend their days trying to answer. In many cases, the answer is complicated and requires a great deal of experience to explain.

Monitor Heroku Add-Ons Using Hosted Graphite

Monitoring your Heroku stack helps you understand the performance of your application and infrastructure. You can identify bottlenecks, slow-performing queries, or resource-intensive processes and optimize them. Monitoring also allows you to detect issues or anomalies in real-time. By setting up alerts based on predefined thresholds, you can be notified as soon as something goes wrong, enabling you to address the issue before it affects users.

Scaling Up: Website Monitoring for Growing Businesses

In the bustling world of tech, finance, and real estate, your website is the lifeblood of your business. It is the first handshake with potential clients and a critical tool for maintaining your business operations. The complexity of your website grows exponentially as your business scales up. This is where website monitoring services become your silent yet most efficient ally.

Why Do Some Routers Drop Packets or Have High Latencies?

Ever wondered why some routers act up, dropping packets or causing annoying latency spikes? We get it – it's frustrating. In this blog post, we're skipping the tech jargon and going straight to the point. In this blog post, we'll uncover the underlying reasons behind the perplexing phenomena of packet loss and high latency.

Best Tools for Preventing and Detecting Cyber Attacks

Being a website owner usually means that at least a part of your livelihood is tied to the security of your site (if not your entire livelihood). It means losing access, getting DDoS attacked too often, getting your private site data leaked, and similar issues can seriously jeopardize everything you’ve been working so hard to accomplish. With so many threats out there, keeping your site safe is a challenge; however, there are some tools that can help you out with this.

How SaaS Changed Network Management

Work environments, the network that supports them, and the network management tools to fix those work environments seem to have changed overnight. But the shift was one which was long in the making, several decades to be exact. With the acceleration of work from home due to the pandemic, SaaS services accelerated into a necessity. Along with this dramatic shift, network management shifted to accommodate SaaS and gone were seemingly static paradigms about work and networking.
Sponsored Post

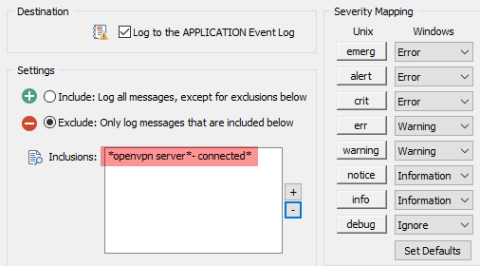
Revealing Suspicious VPN Activity with Anomaly Detection

Anybody who monitors logs of any kinds, knows that the extracting useful information from the gigabytes of data being collected remains one of the biggest challenges. One of the more important metrics to keep an eye on are all sorts of logons that occur in your network – especially if they originate on the Internet – such as VPN logins.

OpenTelemetry Collector - architecture and configuration guide

OpenTelemetry Collector is a stand-alone service provided by OpenTelemetry. It can be used as a telemetry-processing system with a lot of flexible configurations to collect and manage telemetry data. Let's do a deep dive on OpenTelemetry Collectors to understand how it works. The first step in setting up observability with OpenTelemetry is instrumentation. The application code is instrumented with OpenTelemetry client libraries that help generate telemetry data like logs, metrics, and traces.

How to Monitor Network Devices: From Routers to Switches

Welcome to the world of networking, where routers, switches, firewalls and other network devices reign supreme. From the backbone routers that facilitate data flow to the intricate web of switches managing local connections, maintaining a vigilant eye on your network devices is at the core of ensuring a high functioning network infrastructure.

Building the NextGen Factory with Splunk and Bosch Rexroth

For centuries there have been many wise sayings on how to deal with disruptions and prevail amidst uncertain circumstances. Read on to learn how Splunk and Bosch Rexroth are building the next-generation factory to help manufacturers elevate their resilience and take advantage of new market trends and operating models.

How to Customise Detectors for Even Better Alerting

In the previous blog, we introduced what makes a bad alert and how being able to simply customise and fine-tune your detectors is critical to creating great alerts. The first category of detectors in Splunk Observability Cloud that we dived into was the out-of-the-box offering called AutoDetect. Customising and subscribing to these detectors is a great way to get up and running straight away with industry best-practice alerts and bring down MTTx.

Grafana 10.3 release: Canvas panel updates, multi-stack data sources, and more

Grafana 10.3 is here! Download Grafana 10.3 The latest version of Grafana brings advanced controls for anonymous access in your Grafana instance and new options for multi-stack data source configuration in Grafana Cloud. The release also enhances Grafana visualizations, with additions like pan and zoom for the canvas panel and updated tooltips for better data interpretation. Plus improvements in Grafana Alerting and log analysis capabilities provide more efficient monitoring and troubleshooting tools.

Why Splunk customers face a choice for observability and modernization

Elastic Observability is fast, simple, and built for the future Businesses everywhere are facing a challenging environment: increased cost pressures coupled with high volumes of data generated by complex, distributed, cloud-native environments. As a result, teams need smarter analytics, access, and retention across all their data — instantly and from anywhere — to resolve issues, make decisions, and ensure resiliency.

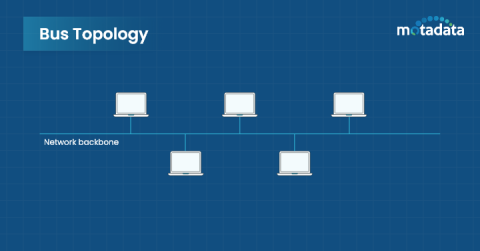
Understanding Network Topology: Types, Best Practices

When you Google ‘Topology,’ it’s defined as ‘the way something is arranged or interconnected’. A similar definition extends into the digital world, especially in a computer network. Network topology is the structure and arrangement of the network and its devices. The question is- why should you care about network topologies? The answer is that your whole work depends on the digital realm in this era, and you want everything to run smoothly.

Database Trends 2024: The Power of Cloud, Consumption Models, and the Popularity of PostgreSQL

A large proportion of our customers rely on eG Enterprise to monitor and troubleshoot application and end-user experience problems caused by problems in underlying database dependencies. Our end-to-end unified monitoring and root-cause analysis platform supports all major database technologies. Over recent years, we have witnessed a significant shift from traditional on-premises databases to more dynamic, scalable solutions.

SysAdmin's guide to migrating from CentOS

CentOS EOL - Are you affected? CentOS used to be community driven. Imagine an OS being tested by a global community of volunteers against a testing team in a company—that gave CentOS unmatched stability. An OS that came with Securuty-Enhanced Linux (SELinux) by default and also included 10-year support meant it was the favorite of both individual developers and enterprises as well (even Facebook, now known as Meta, used CentOS for its data centers).

Mastering IPM: Monitor What Matters From Where It Matters

In the first installment of our IPM Best Practices Series, we explored the vast expanse of the Internet Stack and how its complex layers work in unison to keep digital services running. We laid the groundwork for understanding why Internet Performance Monitoring (IPM) is pivotal for the resilience of our interconnected world. This post zeroes in on the imperative of monitoring precisely what matters, and from the right vantage points.

Solve Teams Performance Challenges for Revenue Growth

As a business leader, you know the power of seamless digital communication. In today’s fast-paced landscape, Microsoft Teams has become the backbone of collaboration, client interaction, and overall efficiency. But when Teams falter, the consequences can be dire. It can erode your revenue streams and dull your competitive edge. That is why overcoming Teams performance challenges is essential for your organization’s success.

Getting Started with Elasticsearch and Python

In the ever-evolving landscape of data management and analytics, the integration of Python with Elasticsearch stands out as a game-changer. Elasticsearch, renowned for its robust distributed search and analytics capabilities, finds a powerful ally in Python through the Python Elasticsearch client. Elasticsearch is an open-source, distributed search and analytics engine known for its scalability and real-time capabilities.

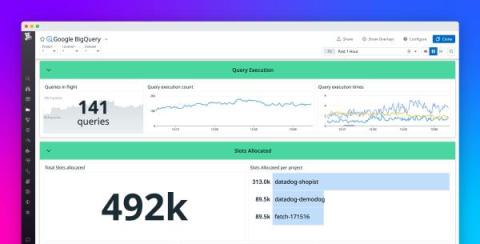
Monitor BigQuery with Datadog

BigQuery is Google Cloud Platform’s fully managed serverless data warehouse. It enables data analysis and storage at petabyte scale while eliminating the overhead of managing infrastructure. As a managed service, BigQuery autoscales and provisions compute resources and storage as needed, helping you reduce the overhead of managing infrastructure but also reducing your visibility into performance. And BigQuery users face other challenges when it comes to visibility.

Managing Kubernetes Events with Cribl Edge

When we discuss observability for applications running in Kubernetes, most people immediately default to Metrics, Logs, and Traces – commonly referred to as the “three pillars.” These pillars are just different types of telemetry – signals that can be fed into observability platforms to help understand how an application behaves. But did you know that Kubernetes offers another valuable signal? When combined with the other signals, you get MELT.

Data Lake Strategy: Implementation Steps, Benefits & Challenges

Data lakes have emerged as a revolutionary solution in the current digital landscape, where data growth is at a 28% CAGR with no signs of slowing. These repositories, capable of storing vast amounts of raw data in their native format in a vendor-neutral way, offer unprecedented flexibility and scalability.

All in the family Architecting and Managing Shared Graylog Clusters

Joel from the Solution Engineering team at Graylog discusses ways to deploy Graylog in a multi-tenant or shared environment and the challenges involved. He dives into the architecture of Graylog, explaining how to use streams, indexes, and permissions. The video focuses on running Graylog in shared capacities, depending on the diverse needs of various departments. Moreover, Joel also talks about traffic accounting and methods to extract data from Graylog. The video is loaded with useful insights from real-world customer experiences, making it a resourceful guide for anyone looking to optimize their Graylog setup.

Step-by-step Guide for Monitoring Redis Using Telegraf and MetricFire

Monitoring Redis instances is essential for maintaining performance, reliability, and security. It allows you to detect issues early, optimize resources, and provide a seamless experience for both developers and end-users. Monitoring your database allows you to track key performance metrics such as memory usage, CPU usage, and query response times. By analyzing these metrics, you can identify performance bottlenecks, optimize queries, and ensure that Redis is operating efficiently.

Graylog Cluster: Navigating Shared Data Like a Pro

As data-rich solutions are important for many businesses, technical information can become overwhelming, especially regarding shared environments and multi-tenancy. In the world of Graylog, we understand these challenges and present the tools you need to keep your cluster running smoothly. Let’s dive into how you can effectively manage shared Graylog clusters.

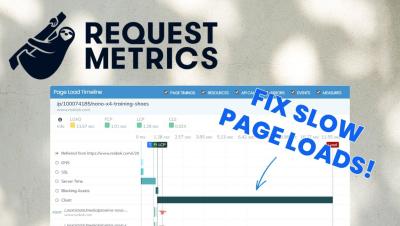
Tracking your Core Web Vitals automatically

Request Metrics Launch Week Day 2 - Core Web Vital Tracking Real-time Core Web Vital tracking. This is a game-changer. Request Metrics gives you real-time information about the Core Web Vitals, as your real-users experience them — everywhere in your website. AND we include the context about WHY something is slow, and where to look, so that the data is actionable and you can fix the problems.

Loki vs Elasticsearch - Which tool to choose for Log Analytics?

Elasticsearch, or the ELK stack, is a popular log analytics solution. The Loki project was started at Grafana Labs in 2018. Grafana leads the development of Loki, while Elastic is the company behind Elasticsearch. In this article, we will do a detailed comparison between these two tools for log analytics. Log data helps application owners debug their applications while also playing a critical role in cyber security.

Top 11 Splunk Alternatives in 2024 [Includes Free & Open-Source Tools]

Splunk is a powerful unified security and observability tool that analyzes data and logs. Splunk allows you to monitor and visualize data in real-time. It analyzes machine-generated data and logs through a web interface. It was recently acquired by Cisco in a $28 billion deal. While Splunk is a powerful platform, it might not suit your needs. In this post, we discuss 11 top Splunk alternatives that you can consider.

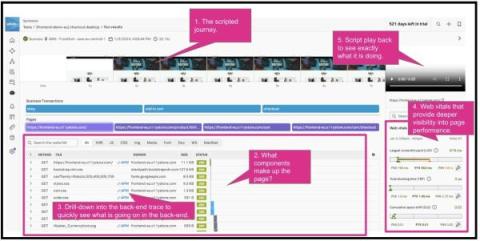
What is Synthetic Transaction Monitoring? (And How Does it Affect User Experience)

In today's world, your web applications must work properly to capture your audience's attention and keep them on your website for longer than a few seconds. It's a battle to keep potential customers engaged, and you'll lose out on valuable leads if your website isn't performing optimally. Before synthetic transaction monitoring (STM), developers used consumer data to examine their website or app's performance closely. Now, they can replicate behavior using synthetic scripts and models.

How DevAlert Can Boost Your Embedded Software Development

Percepio DevAlert is a powerful observability solution for embedded software developers providing alerts on anomalies in your software, such as errors, crashes, and cybersecurity warnings. The alerts provide deep observability into the device software behavior for diagnosing the issues, such as core dumps, software traces, logs and any other device data you choose to include. There are several use-cases for this kind of observability.

What's New in Open 360? January 2024 Update

At Logz.io, we recently announced the release of App 360, a new solution that aims to shift the paradigm around application performance monitoring (APM) systems. To better give our customers a look at the new solution within the Logz.io Open 360™ platform for essential observability, we recently hosted a webinar explaining App 360 in greater depth and provided a detailed product demonstration. Let’s take a closer look at the key highlights and insights we shared during the webinar.

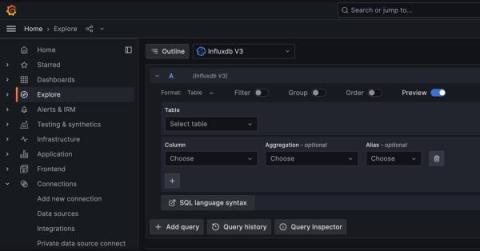
Grafana Unleashes Official InfluxDB V3 Data Source: A Quick-start Guide to Configuration and Usage

Yes, the title says it all: Grafana released the official V3 plugin for InfluxDB Data Source! Before delving into the tutorial, we’d like to thank Ismail Simsek, a Tech Lead at Grafana. Ismail was pivotal in adding the V3 SQL plugin to the InfluxDB data source and making significant backend code improvements. To clarify, this release isn’t an entirely new data source.

Elastic recognized with 2024 EMA Allstars award for its AI-assisted observability

We are thrilled to be recognized with the 2024 EMA Allstars award. This award acknowledges Elastic’s focus on delivering a full-stack observability solution that provides unified visibility and AI-powered insights into complex hybrid cloud deployments. The EMA Allstars award celebrates trailblazers and innovators who are reshaping the enterprise technology landscape.

Scale Your Splunk Cloud Operations With The Splunk Content Manager App

Effectively managing both public and private Splunk Apps across multiple Splunk environments poses a considerable challenge, demanding significant time and effort with the potential for tedious and manual tasks. Recognizing this complexity, the Splunk Cloud Service has been progressively introducing additional features and capabilities to streamline and simplify these intricate administrative responsibilities.

Accelerate TraceQL queries at scale with dedicated attribute columns in Grafana Tempo

With Grafana Tempo 2.3, we introduced a new storage format (vParquet3), which enabled an exciting new feature (dedicated attribute columns) that focused on the read path. Dedicated attribute columns offer a wide range of benefits primarily centered around query performance and memory usage. These columns can improve read speed across most queries, and they can have a major impact on resource utilization.

Trying and failing and trying again

Starting software products is hard, and it’s easy to make mistakes. We’ve started a lot of products – and we’ve made a whole lot of mistakes along the way. But that’s not going to stop us. We’re stubborn like that. Today we are launching Request Metrics for the third time, and I’m reflecting on what we did wrong in the first two attempts, and how we’re going to be better, faster, and strong next time.

Our complete cron job guide for 2024

When it comes to system administration, the need for automation and precise scheduling has never been greater. That’s where cron comes in, the time-based job scheduler that has been a steadfast companion of Unix-like operating systems for decades. If you’re a seasoned sysadmin or just a curious enthusiast, understanding the ins and outs of Cron is a valuable skill.

OTel Applications on Retrace

We are excited to inform you that Open Telemetry is now available for you with the introduction of “Netreo OTel Appliance”. With the OTel Appliance, cloud-native services like AWS Lambda, AWS ECS, AWS EKS, Azure Functions, Azure App Services, Azure Container Instances, and Azure Kubernetes Services can be monitored and you see application traces and logs in Retrace UI (s1.stackify.com). The applications hosted in the cloud Serverless and containers can be monitored without running the Retrace agent within the instance itself.

Overcoming Messy Cloud Migrations, Outdated Infrastructures, Syslog, and Other Chaos

As businesses grapple with increasing data volumes, the need for practical tools to manage and use this data has never been greater. High-quality tools are great — but imagine what you could accomplish with one that made all the others in your toolbox even better? That’s exactly how we design every Cribl solution — we exist to help IT and Security teams get more out of their existing infrastructure.

Monitor Oracle managed databases with Datadog DBM

Datadog Database Monitoring (DBM), which provides host-level and query performance metrics and insights for PostgreSQL, MySQL, and SQL Server, is now available for Oracle. Oracle is one of the most common database types, and now teams that operate Oracle databases can use Datadog to monitor these resources alongside telemetry from across their environments.

Azure VM Autoscaling to enhance performance and cost efficiency

Azure VM Autoscaling is a feature provided by Microsoft Azure that allows to automatically adjust the number of Virtual Machines (VMs) in a specific scale set based on predefined criteria such as load, performance metrics, or a schedule. This post delves into the significance of autoscaling within Azure VMs, spotlighting its role in cost optimization, performance enhancement, and improved availability.

Real user performance monitoring, the easy way

Request Metrics Launch Week Day 1 - Real User Performance Monitoring. Real User Performance Monitoring from Request Metrics is a game-changer. It’s never been this easy to automatically get your performance reports, and with our data and alerts, you’ll know exactly when you need to act to protect your experience, boost your SEO, and increase the revenue of your site.

Understanding Cardinality with Levitate's Cardinality Explorer

Predicting the future is hard, especially with metrics-based monitoring systems, because metrics cardinality can snowball. This is important because it affects query performance adversely. Having visibility into what’s happening now and workflows to manage cardinality is crucial. Because the answers depend on the quality of questions, a system allows you to ask. The questions one may have is —

Elevate Your FinOps Career: Expert Tips for Success and Growth

Back in 2014, DevOps took the tech world by storm, and now we’ve got another game-changer: the rise of FinOps. FinOps is stepping up as a key player, helping companies manage and optimize their cloud costs, shaping it into an investment in a company’s financial health. However, a significant challenge has emerged: the demand for skilled FinOps professionals far exceeds the supply.

Making sure Laravel's debug mode is always disabled in production

Recently, people started talking about a malware called “Androxgh0st” specifically targeting Laravel apps. In a recent edition of Securing Laravel, Stephen Rees-Carter wrote a good explanation of how it works. The malware targets apps with APP_DEBUG set to true. When enabled, Laravel will give detailed error messages, and some security features will be disabled. In production, you always want this value to be set to false.

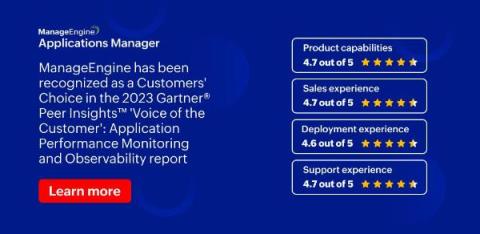
We've done it again: ManageEngine named a 2023 Gartner Peer Insights Customers' Choice for Application Performance Monitoring and Observability!

At ManageEngine, customers are at the heart of everything we do. That’s why we are excited to be recognized as a 2023 Gartner Peer Insights™ Customers’ Choice for Application Performance Monitoring and Observability. This year marks the fifth time we have been recognized with this distinction.
Sponsored Post

Managing Hybrid Environments Using SCCM, Intune, and SCOM

In the dynamic landscape of IT management, organizations face the challenge of monitoring infrastructure health and managing diverse endpoints efficiently. Microsoft offers two powerful solutions, System Center Operations Manager (SCOM) and Intune, each tailored to address distinct aspects of IT management. In this blog post, we will delve into the functionalities of SCOM and Intune, explore their detailed differences, and understand why paying attention to Intune alerts is crucial. Download PDF.

Challenges in Oracle Monitoring and How to Overcome Them

In the ever-evolving landscape of data management, Oracle databases stand as stalwarts, driving critical operations for countless organizations worldwide. Yet, the complexity of these environments presents a formidable challenge in monitoring them effectively. Efficient monitoring is the cornerstone of ensuring optimal performance, security, and compliance within Oracle ecosystems. However, the multifaceted nature of Oracle databases poses several challenges that demand nuanced solutions.

How to Create Great Alerts

We’ve all been guilty of it. Creating rules and filters to hide those alerts that, for the most part, are just noise. Only then to have notifications about a legitimate issue also get swept up by those same filters. There’s only so many times we can break concentration and disrupt productivity before getting fed up with false positives and ignoring everything completely.

A Guide to Visual Regression Testing With Playwright and How to Get Started

I’m pretty sure that you’ve had a situation where you deployed a major UX change on your web app and missed the most obvious issues, like a misaligned button or distorted images. Unintended changes on your site can cause not only a sharp decline in user satisfaction but also a large fall in sales and customer retention. By identifying and resolving these discrepancies before the update went live, you could have prevented these outcomes.

Alerts Are Fundamentally Messy

Good alerting hygiene consists of a few components: chasing down alert conditions, reflecting on incidents, and thinking of what makes a signal good or bad. The hope is that we can get our alerts to the stage where they will page us when they should, and they won’t when they shouldn’t. However, the reality of alerting in a socio-technical system must cater not only to the mess around the signal, but also to the longer term interpretation of alerts by people and automation acting on them.

NGINX Access and Error Logs

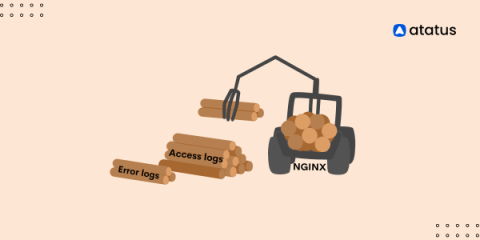
Nginx, a widely used web server and reverse proxy, maintains two crucial logs that provide valuable insights into its performance and user interactions: the access log and the error log. These logs play a pivotal role in monitoring and troubleshooting web server activities. The access log records every request made to the server, capturing details such as the requested URL, client's IP address, response status code, and user agent.

Partitioning Data for Query Performance in InfluxDB 3.0

Query performance is critical in any database. Data partitioning is a mechanism that helps prune unnecessary data, allowing queries to run faster. However, there are always trade-offs between large and small numbers of partitions. For instance, fine-grained partitioning on high cardinality columns can reduce performance. This post describes different partitioning schemes supported by InfluxDB 3.0 and explains their trade-offs.

5 Cloud Outages Tracker Tools To Monitor Vendors in 2024

Whether you’re a business owner, a tech enthusiast, or simply a user who relies on cloud services for daily tasks, the cloud outage tracker can be a useful tool. It informs you of downtime, degraded performance, and maintenance of services that modern businesses rely on. Here’s the list of cloud outage tracker tools that can help you prepare for and mitigate the effects of inevitable disruptions in the cloud.

Understand & Optimize Your Telemetry Data (Subtitled)

The explosion of telemetry data also massively increases your data bill. Teams also cannot control the data they do not understand and often lack the capabilities to act on it once it is understood. Mezmo makes it easier to understand and optimize your data. It helps reduce unnecessary noise and cost, and improve the quality of your data, so that your developers and engineers can consistently deliver on their service level objectives.

Managing Telemetry Data Overflow in Kubernetes with Resource Quotas and Limits

One of the inherent challenges you'll face when working with Kubernetes is that a typical cluster includes many resources that produce telemetry data. Because producing and moving telemetry data consumes resources, you can end up in situations where different workloads are competing for the resources necessary to manage telemetry data.

Analyze Your Mailchimp Campaigns Using Telegraf

Monitoring your email campaigns helps you track key performance indicators (KPIs) such as open rates, click-through rates, and conversion rates. This evaluation provides insights into the success of your email campaigns and allows you to identify areas for improvement and by analyzing metrics like open rates and click-through rates, you can gauge the level of engagement your emails are generating.

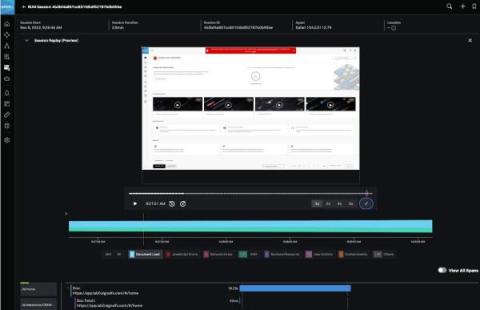
Debugging weird stack traces with Session Replay

Imagine this: Your website is getting a lot of traffic and you have some kind of metrics, logging, or performance monitoring setup (maybe even Sentry). You’re alerted to something… odd. You open up your error and see that a request was interrupted by another request. Uh oh. This sounds like a user was rage-clicking , clicking like crazy making duplicate requests. You weren’t expecting that!

Decoding PostgreSQL Monitoring | 101 Guide

Monitoring PostgreSQL for performance issues is critical. PostgreSQL is a powerful open-source relational database system that stands out for its robustness, scalability, and strong emphasis on extensibility and standards compliance. In this guide on PostgreSQL monitoring, we will cover key PostgreSQL metrics that should be monitored, best practices for monitoring PostgreSQL and some tools with which you can set up PostgreSQL monitoring.

Guarantee Network Uptime with Network Uptime Monitoring

Network downtime is no fun for anyone. End users (tied to their computing devices) don’t know what to do, customers and partners can’t do business with you and IT pulls out more hair than a barber shop floor. Network downtime leads to lost productivity, business and precious IT time. Here are a few uptime facts to consider: The answer to all these ills is to avoid network downtime in the first place by ensuring the opposite: network uptime.

GDPR Compliance in 2024

The EU General Data Protection Regulation (GDPR) came into force in May 2018, affecting all organizations doing business in the EU, regardless of where the organization operates. This affects every type of company from small online stores to very large enterprises. By now everyone knows this, we hope. But let’s have a little recap before sharing some updates. Europe’s General Data Protection Regulation (GDPR) is considered one of the toughest global privacy and security laws.

Best New Relic Alternatives Updated

If you are someone who has explored monitoring and observability solutions for your program, New Relic One is hard to miss. It is a comprehensive monitoring and management application initially started out by Lew Cirne in 2008. Then on, it expanded its product base to include over twenty products ranging from front-end to back-end, infrastructure, logs, and even vulnerability addressing. Today, it stands as one of the most successful analytics platforms for enterprises dealing with data.

How to calculate uptime accurately: Essential guide & expert tips

Ever wondered how businesses ensure their websites are always up and running? That's where the concept of uptime comes in. This key metric is crucial for any online service, reflecting the reliability and availability of websites and digital platforms. Uptime isn't just about keeping sites operational; it's about guaranteeing consistent access for users and maintaining business continuity.

A Look Back at 2023

As we've turned the final pages of 2023 and now set our sights on 2024, it felt like an appropriate moment to pause, reflect, and shine a light on the steps we've made over the past year at BugSplat. There are a couple of compelling reasons to do this: First, we recognize that some of our key updates might slip under the radar amidst the hustle and bustle of daily tasks. Highlighting these changes is our way of giving you a second chance to discover some useful new features at your disposal.

Effective Trace Instrumentation with Semantic Conventions

There’s plenty of literature on the mechanics of instrumenting code with OpenTelemetry and delivering it to Honeycomb. However, I’ve not found many guides on the craft of instrumenting code in order to have a good observability experience in your system. A lot of focus is placed on automatic instrumentation—which is great, particularly if you’re new to observability or retrofitting—but it misses the power of good instrumentation at the application level.

EMA explores Elastic AI Assistant for Security

Spoiler alert: it’s great! Elastic Security has been making waves among busy security analysts everywhere with the launch of Elastic AI Assistant. Whether it’s synthesizing alert details and suggesting next steps, or the recent addition from Elastic 8.11 to generate ES|QL queries from natural language, there’s a lot to love about Elastic AI Assistant for security efforts.

The Story of Grafana | Episode 3: Open (Source) for Business | Grafana Documentary

In 2014, Grafana Labs (formerly known as Raintank) was founded with one mission in mind: To build a sustainable business around the popular open source Grafana project and use the revenue from our commercial offerings to re-invest in the technology.

How to do continuous profiling right with Grafana Pyroscope's Ryan Perry (Grafana Office Hours #26)

Ryan Perry, co-founder of Grafana Pyroscope, talks to us about how to do continuous profiling right. Ryan is also an Engineering Director at Grafana Labs, and he discusses the main concerns in continuous profiling and how to avoid those pitfalls. Pyroscope is an open-source project for aggregating continuous profiling data about your system's resources. He is joined by Developer Advocates Nicole van der Hoeven and Paul Balogh.

AI at Splunk: Trustworthy Principles for Digital Resilience

There’s no doubt AI will radically reimagine the way we live, work and interact. It will empower new ways to solve business challenges and deliver customer value, but such a widespread impact requires a holistic approach. Building AI responsibly is one thing, but embedding trust into every aspect of our AI strategy is another entirely – and that’s what Splunk sets out to do.

How Cribl Helps the UK Public Sector Manage Challenges Around Growing Data Costs and Complexity

As the Data Engine for IT & Security, Cribl helps organisations overcome several challenges, including : In this first blog, we will concentrate on how Cribl can help the UK public sector deal with ever-rising data volumes whilst controlling costs.

How to Monitor Your RabbitMQ Performance Using Telegraf

Monitoring RabbitMQ is essential for maintaining the health, performance, and reliability of your messaging infrastructure. It empowers you to take proactive measures, prevent downtime, and deliver a seamless messaging experience for your applications and users. Monitoring helps you keep an eye on the performance metrics of RabbitMQ, such as message rates, queue lengths, and resource utilization.

Monitoring an Open Banking Flow With Playwright & Checkly

Open banking offers users a way to have easier access to their own bank account information, like via third-party applications. This is achieved by allowing third-party financial service providers access to the financial data of a bank's customers through the use of APIs, which enable secure communication between the different parties involved.

Cloud vs On Premise: Comparison Chart for Network Management

Few contemporary topics have led to greater debate among networking professionals than cloud-based networking and, by extension, cloud-based network monitoring and management solutions. From its niche beginnings with distributed organizations, cloud-based network management has been adopted by organizations ranging from SMB to large, carpeted enterprises. However, traditional on-premise (aka on-prem) solutions persist, helping give customers unprecedented choice when shopping for a solution.

Observability vs. Monitoring: Decoding Key Distinctions

In the evolving digital landscape, transformation has become a necessity for businesses in order to stand out and remain competitive. As per stats records, around 91% of businesses use digital technologies and platforms to run their business more successfully. With excessive dependency on digital technologies, there also comes the challenge of navigating through the complex web of dependencies and interactions.

How to Monitor PostgreSQL metrics with OpenTelemetry

PostgreSQL metrics monitoring is important to ensure that PostgreSQL is performing as expected and to identify and resolve problems quickly. In this tutorial, you will install OpenTelemetry Collector to collect PostgreSQL metrics and then send the collected data to SigNoz for monitoring and visualization. In this tutorial, we cover: If you want to jump straight into implementation, start with this prerequisites section.

Icinga DB Web migration made easier

For users using monitoring module, migrating their custom dashboards, navigation items and permissions and restrictions to Icinga DB Web has been made easier with the recent Icinga DB Web release (v1.1.1) through its migrate command. Once Icinga DB Web has been upgraded to v1.1.1, run the command icingacli icingadb migrate --help to see the avaliable actions under migrate command and what each action does.

Elastic Observability 8.12: GA for AI Assistant, SLO, and Mobile APM support

Elastic® Observability 8.12 announces general availability (GA) for the AI Assistant, Service Level Objectives (SLO), and Mobile APM support: Elastic Observability 8.12 is available now on Elastic Cloud — the only hosted Elasticsearch® offering to include all of the new features in this latest release. You can also download the Elastic Stack and our cloud orchestration products, Elastic Cloud Enterprise and Elastic Cloud for Kubernetes, for a self-managed experience.

Swisscom breaking through internal silos with Cisco AppDynamics

Switzerland's leading telecom provider, Swisscom, managed to break through their internal silos and gain end- to-end application performance visibility. This led to on-track performance in reaching their goal of delivering 100% service quality to their customers. Understand how they did it, and which Cisco AppDynamics products they implemented to eliminate the barriers and obstacles blocking success.

How to monitor a MySQL NDB cluster with Grafana

Jason Mallory is a senior MySQL/SQL server database administrator who develops monitoring and alerting solutions for operations departments in the aerospace industry. Jason is also a Grafana Champion. MySQL Network Database — or NDB, for short — is an in-memory, sharded database platform. Consisting of several moving parts, NDB can be one of the most challenging database platforms to monitor. However, monitoring NDB cluster health is crucial to ensure reliability and performance.

Success Stories: How Obkio Transformed SMB Network Monitoring for These Companies

Explore real use cases of how Obkio revolutionizes SMB network monitoring, enhancing efficiency, and delivering top-notch user experiences. The heartbeat of success for Small and Medium-sized Businesses (SMBs) often echoes through the intricate network infrastructures that keep operations running smoothly. Yet, the journey to maintain and optimize these networks is riddled with challenges, a story familiar to many SMBs worldwide.

Why Your Logging Data and Bills Get Out of Hand

In the labyrinth of IT systems, logging is a fundamental beacon guiding operational stability, troubleshooting, and security. In this quest, however, organizations often find themselves inundated with a deluge of logs. Each action, every transaction, and the minutiae of system behavior generate a trail of invaluable data—verbose, intricate, and at times, overwhelming.

Anatomy of an OTT Traffic Surge: Peacock Delivers First Exclusively Streamed NFL Playoff Game

NFL playoffs are here, and Doug Madory tells us how Saturday’s first-ever exclusively live-streamed NFL playoff game was delivered without making any references to pop superstar Taylor Swift or her sizzling romance with nine-time Pro Bowler Travis Kelce.

Unleashing Real-Time Insights: Pairing InfluxDB with Data Lakes and Data Warehouses

Imagine a bustling city with millions of people going about their daily lives. Now, picture a network of interconnected roads, each representing a data point, capturing the pulse of the city in real-time. This is the essence of data lakes and data warehouses, where vast amounts of information flow in and out, shaping the decisions that drive businesses forward. However, to harness the power of these architectures, real-time analytics is essential.

The Hidden Challenge of Microsoft Teams Performance

In today’s quickly changing modern workplace, digital collaboration tools are incredibly important. Microsoft Teams, a cornerstone of Microsoft 365, has become a pivotal platform for communication and collaboration, especially in the age of remote work. However, as IT managers navigate the complex terrain of ensuring seamless connectivity and productivity, a hidden challenge often lurks beneath the surface – the substantial challenge of Microsoft Teams performance.

Optimizing usability for evolving applications

In line with enterprise applications transitioning to the cloud, the need for simplified and efficient observability solutions is growing. AppDynamics’ cloud native response is an innovative platform designed to effortlessly onboard customer cloud environments, automate monitoring of ephemeral environments, and streamline MELT (Metrics, Events, Logs, and Traces) data correlation. By leveraging the power of data science—including machine learning and AI—it provides comprehensive solutions to challenges arising from applications, Kubernetes, infrastructure, or other cloud-native aspects in a multi-cloud world.

Datadog on Design Systems

Over the last five years, the Datadog platform has grown. We added Application Performance Monitoring to complement our core infrastructure monitoring product, Log Management, Synthetic and Real User Monitoring, and more. For an enterprise software platform to be successful, the whole has to be greater than the sum of its parts. In Datadog’s case, this means users must be able to connect different types of data, pivot seamlessly from one context to another, and follow the thread of an investigation wherever it might lead.

How to Monitor PostgreSQL With Telegraf and MetricFire

Monitoring your PostgreSQL instance is essential for maintaining performance, reliability, security, and compliance. It allows you to stay ahead of potential issues, optimize resource utilization, and ensure a smooth and efficient operation of your database system. Database monitoring helps you can pinpoint problematic queries, analyze execution plans, and make necessary adjustments to improve overall application responsiveness.

Monitoring-as-Code for Scaling Observability

As data volumes continue to grow and observability plays an ever-greater role in ensuring optimal website and application performance, responsibility for end-user experience is shifting left. This can create a messy situation with hundreds of R&D members from back-end engineers, front-end teams as well as DevOps and SREs, all shipping data and creating their own dashboards and alerts.

How To Troubleshoot False Alerts in Netreo

Regardless of the attention given to configuring monitoring solutions, the dynamic nature of today’s modern infrastructures can impact alert functionality. Optimizing network performance in complex, hybrid infrastructures leveraging SD-WANs, real-time provisioning and other advanced features is really tough. So what should IT teams do when receiving false alerts or notifications that appear inaccurate?

How to easily add application monitoring in Kubernetes pods

The Elastic APM K8s Attacher lets the Elastic APM agent auto-attach to the application in your pods by adding just one annotation to your deployment The Elastic® APM K8s Attacher allows auto-installation of Elastic APM application agents (e.g., the Elastic APM Java agent) into applications running in your Kubernetes clusters. The mechanism uses a mutating webhook, which is a standard Kubernetes component, but you don’t need to know all the details to use the Attacher.

Why Network Load Balancer Monitoring is Critical

Your networks are the highways that enable data transfers and cloud-based collaboration. Like highways connect people to physical locations, networks connect people to applications and databases. As you would look up the fastest route between two physical locations, your workforce members need the fastest connectivity between two digital locations. Network load balancers enable you to prevent and identify digital “traffic jams” by redistributing incoming network requests across your servers.

Incident Response Plans: The Complete Guide To Creating & Maintaining IRPs

Speedily minimizing the negative impact of an information security incident is a fundamental element of information security management. The risks — loss of credibility in the eyes of users and other stakeholders, loss of business revenue and critical data, potential regulatory penalties — can significantly jeopardize your organization’s mission and objectives.

Collecting OpenShift container logs using Red Hat's OpenShift Logging Operator

This blog explores a possible approach to collecting and formatting OpenShift Container Platform logs and audit logs with Red Hat OpenShift Logging Operator. We recommend using Elastic® Agent for the best possible experience! We will also show how to format the logs to Elastic Common Schema (ECS) for the best experience viewing, searching, and visualizing your logs. All examples in this blog are based on OpenShift 4.14.

StatusGator Alternatives in 2024

In this realm of cloud and SaaS service uptime, StatusGator offers unparalleled monitoring of nearly 3,000 services. This article delves into the alternatives to StatusGator in 2024, but first, let’s understand what sets StatusGator apart. Unlike typical status page aggregators, StatusGator offers advanced status aggregation with unique capabilities. StatusGator collects the status of almost 3,000 services from official, published, status pages to gain as much information as possible.

Mastering Internet Performance Monitoring: A Best Practices Series

The digital landscape has dramatically transformed since the world’s first website went live at CERN on August 6, 1991. What began as a single webpage has exploded into a sprawling, intricate web of interconnected services and systems. The modern web is mind-bogglingly vast, complex, and, when it works, beautiful in its precision and technological harmony.

What MSPs Need to Know About Our Partner Program

MSPs using CloudHealth are in for an abrupt start to 2024. VMware, which acquired CloudHealth, is ending its partner programs. Instead, they’re rolling out the exclusive Partner Program, starting from February 5, 2024. The switch will impact solution providers, resellers, and cloud services partners. With this new selective partner program, MSPs face fresh challenges in meeting the latest standards.

A Basic Introduction to OpenTelemetry Python

Think of a tool that simplifies application monitoring and helps developers and staff trace, collect logs and measure performance metrics. That is what OpenTelemetry Python provides. OpenTelemetry (OTel) Python acts as a guiding light, offering insights into the behaviors and interactions of complex, distributed systems and enabling a deeper understanding of performance bottlenecks and system dependencies. The significance of OTel lies in its pivotal role in modern software development.

Zabbix plugin for Grafana: Grafana Labs will manage and maintain the popular plugin

I’m happy to share some exciting news! Grafana Labs is taking ownership of the Zabbix plugin, one of the most popular third-party data sources for Grafana over the years. The Zabbix plugin for Grafana allows you to visualize data from the Zabbix monitoring system, offering a quick and powerful way to create dashboards. I personally started the project in 2015, with the goal of bringing a better dashboarding experience to Zabbix users.

Easily Monitor URL and IP Availability Using Telegraf with Ping

Monitoring your domain URLs and server IPs is important for many reasons and plays a crucial role in ensuring the health, performance, and security of a network or web application. Monitoring hosted IPs within your infrastructure helps track the availability and uptime of websites and services. It also allows organizations to identify and respond quickly to downtime or outages, minimizing the impact on users.

VoIP Latency Exposed: A Guide to Identifying, Analyzing, and Resolving Issues

Welcome to the world of seamless communication, where Voice over Internet Protocol (VoIP) has revolutionized the way we connect. However, amidst the convenience and clarity that VoIP promises, there's a subtle disruptor that often goes unnoticed but can significantly impact the user experience: VoIP latency. In this article, we’ll be exploring VoIP latency—unveiling the mysterious delays that can occur during your virtual conversations.

Anodot vs. Cloud Ctrl Cost: Which is better for Cloud FinOps capabilities?

Our solution (Anodot) and Cloud Ctrl Cost are two popular choices for a FinOps solution. With the increasing number of businesses moving to the cloud, having a third-party cost management solution like FinOps can handle all the challenges and maximize productivity in the cloud. So, which platform offers a complete FinOps solution? Let’s dig deeper and analyze who provides the best solutions, technology, and support to make the most of your FinOps culture.

How to Analyze Problems with Root Cause Analysis - Full Guide

To understand what a Root Cause Analysis (RCA) is, we must start from the fact that a root cause is a factor that causes a non-conformance and must be deleted through process improvement. The root cause is the central issue and the highest-level cause that sets in motion the entire cause-and-effect reaction that ultimately leads to the problem.

Identify and rectify network issues proactively with the OpManager-Jira integration

As technology evolves, it has become incredibly difficult for IT teams to work in the conventional siloed environment. Technologies such as NetDevOps and site reliability engineering (SRE) call for collaborative efforts between various IT teams. This allows them to develop and deploy products much faster, streamline and automate their operations, and proactively detect and rectify issues as they crop up.

Docker Log Rotation Configuration Guide | SigNoz

It is essential to configure log rotation for Docker containers. Log rotation is not performed by default, and if it’s not configured, logs on the Docker host can build up and eat up disk space. This guide will teach us how to set up Docker log rotation. Logs are an essential piece of telemetry data. Logs can be used to debug performance issues in applications.

Does Step Function's new TestState API make end-to-end tests obsolete?

Step Function added support for testing individual states . Which lets you execute individual states with the following: And returns the following: With the TestState API, you can thoroughly test every state and achieve close to 100% coverage of a state machine. So, does this eliminate the need for Step Functions Local ? Can we do away with end-to-end tests as well? If not, where should this new API fit into your workflow, and how should you use it?

Observability and Telecommunications Network Management [Part 1]

The border between the management of telecommunications networks and the services that they support and the management of IT infrastructures and the applications that they support has always been a porous one. One might say that they are like two dialects of the same language rather than different languages. Nonetheless, these areas, whether characterised by technology or practice, are different and have, for the most part, been served by different vendors and products.

MSP Monitoring For Top-Notch Network Performance

The role of Managed Service Providers (MSPs) has become increasingly pivotal nowadays, with businesses relying on their expertise to manage and optimize complex network infrastructures. The effective monitoring of these intricate networks is central to the success of MSPs, a practice known as MSP Monitoring.

Azure App Service Pricing (2024)

Azure App Services, part of Microsoft Azure’s platform-as-a-service (PaaS) offerings, simplifies web application and API development, deployment, and scalability without managing underlying infrastructure complexities. Supporting various programming languages and frameworks, its versatility suits diverse applications. Understanding Azure App Services pricing is crucial for effective cost management and resource optimization.

Website Monitoring: A Vital Component of Disaster Recovery Plans

Imagine this: It’s a calm, ordinary day at your office. Your website is the main gateway through which customers interact with your business, be it tech, finance, or real estate. Suddenly, without warning, your website goes down. Panic ensues. Sales halt, customer complaints skyrocket, and your brand’s reputation takes a nosedive. This isn’t a doomsday scenario, but a very real possibility in today’s digital-first world.

8 Server Performance Monitoring Tools To Consider in 2024

Are you tired of dealing with server crashes, downtime, and slow response time? Join the club. Server monitoring and maintenance is key to keeping your organization running smoothly, but it's notoriously difficult to manage. That's why it's important to have the right tools in place for server performance monitoring and uptime tracking. Not sure which tool to choose? You're in the right place.

Debugging 5 Common Networking Problems With Full Stack Logging

Infrastructure is a complex and difficult concept for developers. When an issue occurs, where do you even begin to look? I’ve spent years of my life playing the “What looks like one but not like the other” game, wrestling with confirmation bias and hunting through haystacks of logs to find a clue to my hosted applications. This takes away from time spent improving my applications—and it isn’t fun.

I built my HTTP API docs from scratch

You might be thinking “building HTTP API docs from scratch? in 2024? wtf?”, and you’re probably right. After all redoc has been around since 2016, and there are hundreds of “generate beautiful documentation from your OpenAPI spec” startups around, some even use AI now. To be honest, I didn’t even know it was possible to do-it-yourself when I started looking into it.

A Guide to Continuous Security Monitoring Tools for DevOps

DevOps has accelerated the delivery of software, but it has also made it more difficult to stay on top of compliance issues and security threats. When applications, environments and infrastructure are constantly changing it becomes increasingly difficult to maintain a handle on compliance and security. For fast-moving teams, real time security monitoring has become essential for quickly identifying risky changes so they can be remediated before they result in security failure.

What are Cloudwatch Metrics? How to implement Custom Metrics in Cloudwatch?

CloudWatch metrics play a critical role in monitoring AWS resources and facilitating effective troubleshooting during system failures. It allows for continuous monitoring of AWS resources like EC2 instances, Lambda functions, and RDS databases. Using Cloudwatch metrics, DevOps teams can monitor and manage their AWS infrastructure easily. Amazon CloudWatch is a comprehensive monitoring and observability service provided by Amazon Web Services (AWS).

ManageEngine: A Leader in UEM for SMBs and a Product Challenger in DEX Solutions

It is raining recognitions at ManageEngine! Adding another feather to our cap, we are thrilled to announce that we have received two significant accolades. We have been named a Leader in Unified Endpoint Management (UEM) for SMBs and a Product Challenger in Digital Employee Experience (DEX) Solutions in the 2023 Provider Lens™ Future of Work (Workplace) – Solutions report by Information Services Group (ISG).

How We Leveraged the Honeycomb Network Agent for Kubernetes to Remediate Our IMDS Security Finding

Picture this: It’s 2 p.m. and you’re sipping on coffee, happily chugging away at your daily routine work. The security team shoots you a message saying the latest pentest or security scan found an issue that needs quick remediation. On the surface, that’s not a problem and can be considered somewhat routine, given the pace of new CVEs coming out. But what if you look at your tooling and find it lacking when you start remediating the issue?

Cybersecurity & Compliance: What the Board needs to know and needs to ask

Vigilance and awareness are critical for compliance and cybersecurity maturity. If board members are not familiar with the key indicators of success for maintaining a resilient business and meeting compliance requirements, they are not fulfilling all their responsibilities. Board members need to understand the principles of their duties to alleviate potential exposure to cyber risk and other outage causing events that could harm the organization’s revenue, and reputation.

Whats New in WhatsUp Gold 2023.1

In this webinar, product experts Greg Collins and Jason Alberino will discuss how WhatsUp Gold lets you find and fix network infrastructure problems fast – with its unmatched combination of out-of-the-box functionality, intuitive workflows, visual mapping and system integrations. They will dive deeper into the new functionalities.

Incident response that's fast and cost-effective: Why 3 companies chose Grafana Cloud

When an incident occurs, every second counts. On-call staff need to quickly get all the relevant information in front of them in a way that’s easy to digest so they can more successfully investigate the issue and communicate with relevant stakeholders.

Transform Your Customer Experience with DevOps Collaboration

Learn how end-to-end monitoring and observability enable enterprises to break down team silos and deliver industry-leading experiences for their customers and achieve business benefits such as: Improved business resilience by identifying and resolving IT risks faster before they result in customer service outages Increased competitive standing with DevOps and shift-left best practices to accelerate software releases.

OpenTelemetry VS Prometheus: The Essential Guide

OpenTelemetry vs Prometheus is a commonly searched and debated topic in the Observability and monitoring space. While both platforms are widely used in software and infrastructure management today, most people don’t understand the difference between the two. Both platforms stand as robust tools in the realm of observability, each offering unique capabilities. OpenTelemetry offers a uniform approach for gathering, instrumenting, and exporting telemetry data.

How the All-In Comprehensive Design Fits Into the Cribl Stream Reference Architecture

In this livestream, Ahmed Kira and I provided more details about the Cribl Stream Reference Architecture, which is designed to help observability admins achieve faster and more valuable stream deployment. We explained the guidelines for deploying the comprehensive reference architecture to meet the needs of large customers with diverse, high-volume data flows. Then, we shared different use cases and discussed their pros and cons.

Incident response that's fast and cost-effective: Why these 3 companies chose Grafana Cloud

When an incident occurs, every second counts. On-call staff need to quickly get all the relevant information in front of them in a way that’s easy to digest so they can more successfully investigate the issue and communicate with relevant stakeholders.

How to Set Up ISP Performance Monitoring: Formula for Success

In the vast landscape of connectivity, Internet Service Providers (ISPs) serve as the architects behind the intricate web that links residential users and businesses to the global digital realm. ISP networks are a sophisticated combination of technologies and infrastructure that require efficient management from administrators for maximum value for all parties involved.
Sponsored Post

Landing the CloudFabrix Spacecraft - Summarizing 2023

India scripted history when Chandrayaan-3 spacecraft touched down successfully near the moon’s south pole on 23 August 2023. Following up on CloudFabrix’s “Artemis 1 moment analogy” in 2022, we had our “Chandrayaan-3” moment in 2023. It was an incredible year of innovation, execution and global growth for the CloudFabrix team and the following summarizes our key 2023 achievements –

Hybrid Cloud Monitoring: The Ultimate Guide to Benefits

In the fast-moving tech world, your business faces two main challenges: maintaining control of in-house servers and harnessing the flexibility of cloud computing. It is where “Hybrid cloud monitoring” emerges as a torch bearer, guiding your organization through the complexities of a dual environment. A hybrid cloud monitoring solution functions like the control centre for your business’s digital operations.

Beyond the box: Custom monitoring with Site24x7 plugin integrations

Organizations today navigate through a myriad of popular and unique applications, intricate systems, and custom services in their IT infrastructure. Each of these elements plays a crucial role, offering insights into the organization's performance or indicating potential issues on the horizon early. This visibility enables organizations to maintain system functionality and ensure uninterrupted operations.

Scaling Down Kubernetes Clusters

Datadog, the observability platform used by thousands of companies, runs on dozens of self-managed Kubernetes clusters in a multi-cloud environment, adding up to tens of thousands of nodes, or hundreds of thousands of pods. This infrastructure is used by a wide variety of engineering teams at Datadog, with different feature and capacity needs.

IoT Monitoring Challenges

With the increasing prevalence of IoT devices, which are being used in a wide range of applications, from smart homes and cities to industrial and agricultural systems, monitoring thei performance and health is extremely important. However, it’s essential to remember that monitoring IoT devices involves more than just tracking device-level data. In addition, monitoring data from the IoT platform or application layer is equally important.

Application-down Troubleshooting Through the Eyes of a Network Engineer

Imagine yourself wearing the hat of a network engineer, where no two days at work are alike. In this dynamic environment, you're often the first point of contact when something remotely IT-related goes wrong, with users frequently pointing fingers at the network. Yet, your expertise lies in knowing the intricacies of network traffic, a vital skill for addressing operational and performance challenges.

Exploring Observability's Role in Retail & E-Commerce

For retailers and ecommerce store owners, your bottom line is always affected whenever your service is down, due to today's consumers expecting their digital interactions to operate around the clock. This is particularly crucial during spikes in traffic due to sales, like Black Friday or Cyber Monday.

Now's The Time For Delayed Open Source

Sentry was born and bred in the Open Source community, and we very much think of ourselves as part of it today. One thing we’ve learned together over the years is that an over-emphasis on user freedom can come at the cost of developer sustainability, to the point that we are now in an Open Source sustainability crisis.

Upgrade to DX UIM 23.4 During Broadcom Support's Designated Weekend Upgrade Program

DX Unified Infrastructure Management (DX UIM) 23.4 is a major, new release of our cornerstone solution for full stack infrastructure observability. This release is due for general availability on January 15, 2024. This release meets the requirement for addressing web-scale IT complexity in enterprises, government agencies, and managed service providers. With this release, customers can manage hybrid, multi-cloud environments and optimize IT operations intelligence.

InfluxData Achieves AWS Data and Competency Status

InfluxDB, the leading time series database, and AWS, the leading web services vendor, have a long-standing partnership. InfluxDB has been available as a SaaS product on AWS for many years. And as InfluxDB has grown and matured, most notably with the release of InfluxDB 3.0 this year, so has our partnership with AWS. That’s why we’re excited to announce that InfluxData achieved AWS Data and Analytics Competency status in the Data Analytics Platforms and NoSQL/New SQL categories.

The Last Mile of Observability - Fine-Tuning Notifications for More Timely Alerts

No one wants to get an alert in the middle of the night. No one wants their Slack flooded to the point of opting out from channels. And indeed, no one wants an urgent alert to be ignored, spiraling into an outage. Getting the right alert to the right person through the right channel — with the goal of initiating immediate action — is the last mile of observability.

11 Top MongoDB Monitoring Tools; Free & Open-Source [2024]

Are you looking for MongoDB monitoring tools? Then you’re at the right place. MongoDB is one of the most popular and powerful NoSQL databases out there. The fact that it’s a document-based database makes it blazing fast. With all the features that MongoDB comes with, you need to keep an eye on your MongoDB's health and performance - especially as it directly deals with your data. There are many monitoring tools out there, and choosing the right one can be confusing.

VoIP Jitter Survival Guide: How to Diagnose, Monitor & Troubleshoot

Step into the world of VoIP, where the battle for crystal-clear communication is often waged against a formidable opponent – jitter. For those immersed in the world of VoIP, the term "jitter" may send shivers down the spine, as it introduces disruptions, delays, and overall degradation of call quality.

10 Networking Trends, Statistics, and Predictions for 2024

Understanding emerging networking trends is increasingly important for IT professionals and companies of all sizes to stay competitive. The global network infrastructure market is expected to reach $197.8 billion by the end of 2024 and increase to $256 billion by 2028 at a compound annual growth rate (CAGR) of 6.67%. This is a projected $58.2 billion increase in just four years. Staying current with developments in the industry, as well as anticipating where these trends may lead, is vital.

User Session Process CPU and Memory at the Core: Elevating Citrix Monitoring with SCOM-Centric Reports

In Citrix environments, where administrators face the ongoing challenge of managing resource-intensive processes, maintaining system stability, and optimizing performance, GripMatix's MetrixInsight for Citrix VAD/DaaS introduces a new suite of SCOM reports with a specific focus on detailed process-level CPU and memory usage. These reports offer an unprecedented depth of insight, enabling a more targeted and effective approach to system performance and resource management in Citrix environments.

Interaction to Next Paint (INP) - From Click to Paint!

Interaction to Next Paint (INP) emerges as a critical metric in assessing and enhancing web performance. As users navigate through websites, the speed at which a page becomes interactive, responding promptly to clicks and taps, profoundly influences their overall satisfaction. INP delves into the intricate lifecycle of user interactions, scrutinizing the intervals between input initiation and the subsequent visual updates on a webpage.

What is Cloudwatch Metrics? Detailed 101 Guide

CloudWatch metrics play a critical role in monitoring AWS resources and facilitating effective troubleshooting during system failures. It allows for continuous monitoring of AWS resources like EC2 instances, Lambda functions, and RDS databases. Using Cloudwatch metrics, DevOps teams can monitor and manage their AWS infrastructure easily. Amazon CloudWatch is a comprehensive monitoring and observability service provided by Amazon Web Services (AWS).

Monitoring Docker Containers Using OpenTelemetry [Full Tutorial]

Monitoring Docker container metrics is essential for understanding the performance and health of your containers. OpenTelemetry collector can collect Docker container metrics and send it to a backend of your choice. In this tutorial, you will install an OpenTelemetry Collector to collect Docker container metrics and send it to SigNoz, an OpenTelemetry-native APM for monitoring and visualization.

Monitoring CouchDB with OpenTelemetry and SigNoz

OpenTelemetry can help you monitor CouchDB performance metrics with the help of OpenTelemetry Collector. In this tutorial, you will install OpenTelemetry Collector to collect CouchDB metrics and then send the collected data to SigNoz for monitoring and visualization. Before that, let’s have a brief overview of CouchDB. If you want to jump straight into implementation, start with this Prerequisites section.

Boost Your Microsoft Teams Performance for Revenue Triumph

Microsoft Teams is a key tool for collaboration in the modern workplace, connecting with other Microsoft 365 apps. When many businesses moved to a mix of remote and in-person work, 45.5% said Microsoft Teams performance became much more important. Additionally, 43% of businesses that use Teams rated it as strategic to their daily operations.

How to set up home automation: A beginner's guide with Grafana Cloud and Home Assistant

I first learned about Home Assistant when my previous job’s manager shared that he charms his wife by using home automation to have Alexa announce the weather as she starts getting ready for the day. After that, he showed us the cool Grafana dashboards where he visualizes his entire home automation setup on a screen in his basement. As fate would have it, I got a chance to work for Grafana Labs soon after that, and I started building my own home automation setup using Grafana Cloud.

Top 3 Icinga Components You Can't Ignore

Monitoring your systems is like having a superhero keeping an eye on your digital realm. And when it comes to superheroes in the world of monitoring, Icinga takes center stage. But did you know that Icinga becomes even mightier with the help of components? In this post, we’re going to unveil the top three Icinga components that are not just cool but downright essential for your monitoring game.

Privacy by default

While companies tout the importance of user privacy, few put their money where their mouth is – or in our case, actually live and breathe the concept the way we do as a company. From how we think about our Product to the way we implement our Marketing, Sentry’s take on privacy is rooted in three key fundamentals: Don’t make me choose, think like your customer, and build for tomorrow today.

We removed advertising cookies, & here's what happened | Sentry

This is not another abstract post about what the ramifications of the cookieless future might be; Sentry actually removed cookies from our website a few months ago. Here’s how it impacted us positively and negatively, in both expected and unexpected ways. I hope this can serve as a guide or inspire others who are considering making this change.

The Benefits and Drawbacks of SNMP and Streaming Telemetry

Is SNMP on life support, or is it as relevant today as ever? The answer is more complicated than a simple yes or no. SNMP is reliable, customizable, and very widely supported. However, SNMP has some serious limitations, especially for modern network monitoring — limitations that streaming telemetry solves. In this post, learn about the advantages and drawbacks of SNMP and streaming telemetry and why they should both be a part of a network visibility strategy.

Detect Ransomware with Flowmon

Experience Ransomware attack step by step and see how you can leverage Flowmon AI-powered threat detection to detect and stop ransomware attacks, before it reaches your storage and your critical data. Progress® Flowmon® is a network and security monitoring platform with AI-based detection of cyber threats and anomalies, and fast access to actionable insights into network and application performance. The solution supports cloud, on-prem and hybrid environments suitable for company-wide coverage, market’s fastest deployment time and has been recognised by Gartner since 2010.

Ensuring Effective IT Infrastructure Monitoring in the Public Sector

Public sector organizations have needs very different from their commercial counterparts. Cybercriminals go after public sector organizations because they hold confidential, often classified, information – the exact data state-sponsored and other criminal groups salivate over. Being based on tax payments, these organizations serve and answer to the public. Progress WhatsUp Gold offers ample out-of-the box monitoring features, helping you to monitor more of what matters to your organization.

Organization Admin Console

Coralogix supports multi-tenancy, allowing multiple teams to be connected under a single organization. Some companies prefer separate teams to isolate data based on the environment it originates from like: Dev, QA, or Production. While others prefer to isolate the data based on organizational units like: Infrastructure, Security, and Application. Coralogix allows you to associate multiple teams with an Organization.

Provisioning and Autoscaling

Datadog, the observability platform used by thousands of companies, runs on dozens of self-managed Kubernetes clusters in a multi-cloud environment, adding up to tens of thousands of nodes, or hundreds of thousands of pods. This infrastructure is used by a wide variety of engineering teams at Datadog, with different feature and capacity needs.

Cribl Stream's Replay vs Cribl Search's Send: Understanding the Differences

In today’s contemporary landscape, organizations produce more data than ever, which needs to be collected, stored, analyzed, and retained, but not necessarily in that order. Historically, most vendors’ analysis tools were also the retention point for that data. Still, while this may first appear to be the best option for performance, we have quickly seen it creates significant problems.

What are networks?

Networks are present in numerous aspects of our daily lives. It's essential for organizations to keep track of their networks to prevent unexpected outages that may result in a drop in productivity. In this segment, we will delve into the subject of networks and their various types. If you already have a basic grasp of networks, this video will act as a refresher. However, if you're unfamiliar with networks, our objective is to provide you with a clear understanding of the concepts.

Receive zipped messages (or files) in BizTalk Server Solutions

Welcome again to another BizTalk Server to Azure Integration Services blog post. In my previous blog post, I discussed how to send zipped messages or files. Today, we will discuss the same topic but in the opposite direction, which is also a classic requirement in legacy BizTalk Server solutions: How do you receive zipped messages (files)?

SLOs with Prometheus done wrong, wrong, wrong, wrong, then right

We have Carson Anderson, Sr. DevOps Engineer at Weave HQ, talking about how they implemented SLOs using Prometheus, what went wrong, and how they fixed it. This talk was given at "Last9 of Reliability" Discord community on 13th December. Talk Description: First thing's first: Yes, it really did take us 5 tries to implement our SLOs with Prometheus. While that may seem embarrassing, we are very happy to be able to share our SLO journey so that we can hopefully help you avoid the same mistakes.

JS Toolbox 2024: Essential picks for modern developers (Overview)

Staying ahead of the curve in JavaScript development requires keeping on top of the ever-evolving landscape of tools and technologies. As we head into 2024, the sprawling world of JavaScript development tools will continue to transform, offering more refined, efficient, and user-friendly options. This ‘JS Toolbox 2024’ series is your one-stop for a comprehensive overview of the latest and most impactful tools in the JavaScript ecosystem.
Sponsored Post

10 Reasons for Poor Teams and Zoom Call Quality

Unified Communications and Collaboration (UCC) platforms play a vital role in facilitating seamless communication and efficient teamwork within the modern digital workplace. This reality is particularly important in light of the growing prevalence of hybrid and remote work. Zoom and Microsoft Teams, two leading UCC applications, have gained widespread popularity across global organizations. Before the rise of Zoom, often Cisco Webex or Goto-Meeting was the collaborative and presentation platform of choice for Enterprises. What's detailed here for Zoom and Teams, also holds true for the more traditional remote meeting apps like Webex and Goto.

101 Guide to RabbitMQ Metrics Monitoring

This guide covers key metrics important for efficiently monitoring RabbitMQ. We will also talk about in-built RabbitMQ monitoring tools with which you can start monitoring your RabbitMQ instances. In fast-paced, data-driven applications where our data flows between the systems at lightning speed - the reliability and efficiency of your messaging infrastructure can make or break your whole application.

Enhance Employee Engagement with Parametric Campaigns

In today's digital workplace, IT-employee engagement is crucial for communicating timely information, fixing issues collaboratively, and understanding employees’ experience with technology. At Nexthink, we have met this evolving need with our investments in engagement campaigns. And now, we are pleased to introduce the newest innovation to connect IT and employees: parametric campaigns.

How Your Website's Performance Can Skyrocket Your Conversion Rates

Welcome to the Uptime.com Blog, where we turn website woes into wins! You’re diving into the fascinating world of website monitoring, and guess what? It’s going to be a game-changer for your site’s conversion rates. Let’s get you up to speed — and we mean that literally!

Cisco Secure Application: Fulfilling the APM + ASM promise for OpenTelemetry

Cisco AppDynamics is making big strides in enabling both application performance and security monitoring for OpenTelemetry. Learn what we’ve done so far. When DevOps began taking hold around 2007, it was meant as a mechanism to remove silos between IT teams and accelerate software development.

Unified Observability: The Right Way Ahead

Observability, in modern software engineering, has evolved into a paramount concept, shedding light on the intricate inner workings of complex systems. Three essential pillars support this quest for clarity: logging, traces, and metrics. These interconnected elements collectively form the backbone of observability, enabling us to understand our software as never before. Think of a system as a bustling city.

How to deploy Grafana Beyla on Kubernetes as a sidecar container

Principal Staff Engineer Nikola Grčevski demonstrates how to deploy Grafana Beyla on Kubernetes as a sidecar container. Grafana Beyla is an eBPF auto-instrumentation tool for application observability: you just have to tell it what to listen to, give it permissions, and deploy it-- and you can see metrics and logs from that component or service without having to do any manual instrumentation.

Observability vs. APM: What to Know on Your Monitoring Journey

In the ever-evolving landscape of software development and IT operations, monitoring tools play a pivotal role in ensuring the performance, reliability, and availability of your applications. Two key disciplines in this domain are observability and Application Performance Management (APM). This post will help you understand the nuances between observability and APM, exploring their unique characteristics, similarities, benefits and differences.

Choosing the Right Observability Tools for Developers

This is the third and final blog post in a series about shifting Observability left. If you have not yet read the first two, you can find the first post here and the second post here. Observability is fundamental to modern software development, enabling developers to gain deep insights into their application’s behavior and performance.

Browser Profiling Learnings from Sentry.io

Since enabling browser profiling on our Sentry.io dashboard a month ago, we have collected over 2M profiles and learned a lot about how our users experience our dashboard. The profiles collected gave us insight into how our dashboard performs in production and surfaced some issues causing UI jank. In this post, we will look at an example of an issue we discovered using Profiling.

Building a Secure OpenTelemetry Collector

The OpenTelemetry Collector is a core part of telemetry pipelines, which makes it one of the parts of your infrastructure that must be as secure as possible. The general advice from the OpenTelemetry teams is to build a custom Collector executable instead of using the supplied ones when you’re using it in a production scenario. However, that isn’t an easy task, and that prompted me to build something.

Monitor Amazon EC2: key metrics for instances, regions, and more in one view

Amazon EC2 was one of the first services available on AWS, helping propel the cloud platform into the mainstream of IT. And while EC2 instances come in a wide range of sizes and flavors to address all sorts of use cases, keeping tabs on those instances isn’t always easy. That’s why we’re excited to introduce our new EC2 monitoring solution in Grafana Cloud.

DX UIM 23.4 Sets a New Standard for Infrastructure Observability

DX Unified Infrastructure Management 23.4 (DX UIM 23.4) is now available. DX UIM 23.4 is the latest version of our cornerstone, full-stack infrastructure observability solution for hybrid cloud and traditional data center environments. DX UIM is a key component of AIOps by Broadcom, a suite of solutions that leverage best-of-breed domain monitoring tools and advanced analytics to deliver actionable insights and enable intelligent automation across the IT operations stack.

Effective strategies for managing cron jobs: Best practices and tools

Cron jobs are essential for automating repetitive tasks and streamlining website and application management. Properly managing cron jobs is crucial for maintaining system efficiency and minimizing risks. In this article, we will explore the significance of cron jobs in tech environments, delve into common challenges in their management, and introduce advanced monitoring solutions like WebGazer. We will also provide best practices to ensure efficient and secure cron job management.

How To Set Up Monitoring for Your Hybrid Environment

The modern IT landscape consists of many distributed systems, which can pose a challenge if you are responsible for the end-to-end performance of these systems. As a platform engineer today, that is exactly what the job requires. You must juggle between dozens of tools to meet SLAs. This is why a modern solution is needed to bridge the gap between disjointed infrastructure and application stacks…and this is why the Splunk Observability platform was born.

What is Network Error Rate & How to Measure It

If you've ever wondered why your network occasionally plays hard to get or experienced those head-scratching moments when everything seems fine, yet something's not quite right – you're in the right place. As the digital landscape evolves, understanding and effectively managing Network Error Rate has become a pivotal aspect of maintaining a robust and efficient network infrastructure.

AIOps in Telecom Industry: Challenges, Benefits, and Use Cases

The telecom industry is rapidly evolving, with network operations becoming increasingly complex. To navigate this complexity, telecom operators are turning to Artificial Intelligence for IT Operations (AIOps) solutions. AIOps combines artificial intelligence, machine learning, and big data analytics to optimize network performance, enhance customer experience, and drive business outcomes.

Sponsored Post

Improving API error responses with the Result pattern

In the expanding world of APIs, meaningful error responses can be just as important as well-structured success responses. In this post, I'll take you through some of the different options for creating responses that I've encountered during my time working at Raygun. We'll go over the pros and cons of some common options, and end with what I consider to be one of the best choices when it comes to API design, the Result Pattern. This pattern can lead to an API that will cleanly handle error states and easily allow for consistent future endpoint development.

The Role of Observability in Media and Entertainment

Digital transformation is at the core of media and entertainment organizations, it’s vital for these firms to constantly evolve to provide the best user experience to their customers. These companies must seek new and interesting content, services, and tailored offerings that enhance the audience’s experience and supply personalization. However, whilst these investments are essential to remain competitive, they’re also particularly costly.

Mastering NGINX Monitoring: Comprehensive Guide to Essential Tools

NGINX, is a versatile open-source web server, reverse proxy, and load balancer, stands out for its exceptional performance and scalability. Monitoring Nginx is pivotal for maintaining its optimal functionality. By tracking and analysing performance, including real-time insights into server health, resource utilization, and user requests, administrators can proactively identify issues.

What is Observability? Monitoring vs Observability

When the process of an application malfunctions, it can have a negative impact on users and the business. Companies need a way to identify and resolve the root cause of problems smartly. This is where monitoring and observability come in. Monitoring and observability are two methods for identifying the underlying cause of problems. Observability in IT is a concept that goes further than simple monitoring.

Observability trends and predictions for 2024: CI/CD observability is in. Spiking costs are out.

From AI to OTel, 2023 was a transformative year for open source observability. While the advancements we made in open source observability will be a catalyst for our continued work in 2024, there is even more innovation on the horizon. We asked seven Grafanistas to share their predictions for which observability trends are on their “In” list for 2024. Here’s what they had to say.

Grafana 10.2.3 release: new features and breaking changes

On Dec. 18, 2023, we unintentionally introduced some new features and two minor breaking changes in the Grafana 10.2.3 patch release. These changes were originally intended for Grafana 10.3, which we plan to release later this month, but these commits were merged into the 10.2.3 release branch early due to a mistake in our release process. Because Grafana 10.2.3 introduces more changes than expected in a typical patch release, there’s a risk of more bugs than expected.

How to Monitor Your Hybrid Applications Without Toil

About seventy-two percent of businesses operate in a hybrid IT environment, mixing their cloud-based services with traditional on-premises infrastructure. These hybrid environments offer many benefits, from scale, speed, and flexibility to security, cost savings, and control, blending the best of both worlds.

Catch JavaScript Errors from your Shopify Theme

As a Shopify theme gets more fully featured, it is likely that large amounts of JavaScript are being used to improve and expand the user experience. Making theme changes gets more nerve wracking as the amount of code increases. Did my sales go down because I broke something with the last JavaScript change? If you’re worried about that next theme publish, it’s time to start monitoring user experiences for JavaScript errors. TrackJS makes error monitoring quick and easy to do!

Unlocking Innovation Down Under: ScienceLogic's Strategic Impact in Australia and New Zealand

In the ever-evolving global business landscape, companies are continually seeking new frontiers to expand their operations. Recently, I returned from one of the most thrilling and innovative regions of the world: Australia and New Zealand (ANZ), where we anticipate a 30%+ growth in our sales, service, and support offerings in the coming year.

Performing Geolocation Lookups on IP Addresses to Use in Cribl Search

Are you tired of sifting through data without context? Cribl Search adds valuable depth to your data, making it much easier to understand and analyze. No more squinting at cryptic logs or puzzling over unknown IP addresses! ️ Some common examples of how Cribl Search can enrich your data are adding service names or matching to threat intelligence. Another popular data enrichment is adding geographical location to events based on IP addresses.

Network Monitoring for Dummies: It's Not Rocket Science

You know the feeling when you are peacefully cruising through your day as a network admin and suddenly, bam! Wi-Fi at the entire head office decides to play hide-and-seek, leaving you stuck in no man’s land. All you hear from everyone is “Fix it now!”. Frustrating, right? That's where network monitoring swoops in to save your day.

BizTalk Server to Azure Integration Services: Send zipped messages (or files)

Welcome again to another BizTalk Server to Azure Integration Services blog post. In my previous blog post, I discussed how you can migrate one-way BizTalk Server routing solutions. Today, we will address another classic requirement in legacy BizTalk Server solutions.

8 Incident Management Tools You Need To Consider In 2024

You're probably aware that downtime is expensive—but do you know how expensive it is? The short answer is—very. According to the Ponemon Institute, outages cost organizations an average of $9,000 per minute (or $540,000 per hour). That's why companies of all sizes are investing in incident management tools to reduce their downtime and improve the customer experience.

Log Monitoring 101 Detailed Guide [Included 10 Tips]

Log monitoring is the practice of tracking and analyzing logs generated by software applications, systems, and infrastructure components. These logs are records of events, actions, and errors that occur within a system. Log monitoring helps ensure the health, performance, and security of applications and infrastructure. Log Monitoring helps in early detection of potential issues, ensuring systems run smoothly and efficiently. In this detailed 101 guide on Log monitoring, we will learn.

5 Tools to Optimize Your Kubernetes Costs Without Sacrificing Performance

As Kubernetes environments become increasingly complex, the balance between reducing expenses and maintaining high performance is paramount. Businesses must leverage cost optimization tools to navigate this complexity without compromising on efficiency. These specialized tools provide crucial visibility into clusters, nodes, pods, and containers, allowing for precise management of resources and costs.

OpenTelemetry in 2023 - What we learnt from the community and our users

OpenTelemetry has brought a sea change in the world of observability. The idea of the project was to standardize the instrumentation needed for generating telemetry. Teams shouldn’t need to change how they collect data if they want to try a new visualization/backend for the telemetry data. That was the vision. This idea seems to have resonated with the developer and devops communities.

Introduction to eBPF with Grafana Beyla, with Nikola Grcevski (Grafana Office Hours #25)

Nikola Grcevski, Principal Software Engineer at Grafana Labs, gives us an introduction to eBPF with Grafana Beyla. We discuss what is eBPF, how you can use it to auto-instrument applications, and how to get started with Beyla. eBPF observability is all the rage because we all want automagical instrumentation-- but does it live up to that promise? Nikola's here to tell us what eBPF can and can't do, and where he'd like to take Beyla next.

Looking at nth degree's Innovative Fractional Service Delivery Model

The nth degree team joins Cribl's Ed Bailey and Andrew Duca to discuss nth degree's innovative fractional service delivery model. This is a discussion anyone who has had to engage professional services should be interested in hearing. nth degree has developed a service delivery model that enables fast engagement and removes friction around service delivery and planning. Imagine not having to get an SOW reviewed by legal for every engagement. That alone solves a big problem for almost everyone.

Popular Kubernetes Distributions You Should Know About

In the realm of modern application deployment, orchestrating containers through Kubernetes is essential for achieving scalability and operational efficiency. This blog deals with diverse Kubernetes distribution platforms, each offering tailored solutions for organizations navigating the intricacies of containerized application management.

The Future of Higher Education: Observability As A Strategic Asset

Schools, universities and other organizations within higher education have been shifting to modernize their learning experiences. With the intake of new students each year, some of these being based remotely, these organizations are seeking to manage large-scale and highly distributed infrastructure.

Simplify customer support with Datadog's integrations for Zendesk

Zendesk provides support teams with an integrated solution for processing all types of customer inquiries and feedback. But as organizations scale, support tickets multiply, making it increasingly difficult to parse all of your customers’ feedback and time-consuming to investigate issues. Customers often report issues without providing the detailed context needed for troubleshooting, creating unclear and indirect paths to remediation.

Home Assistant Tutorial: A Beginner's Guide to Automation

In this post, we’ll be taking a closer look at Home Assistant, an open source platform for connecting your smart devices at home. We’ll walk through every important section of Home Assistant: dashboards, integrations, add-ons, devices and entities, automation, scripts, and scenes. In addition, we’ll be walking through how to set up your Home Assistant and create automation using Home Assistant’s graphical user interface.

Escaping the Cost/Visibility Tradeoff in Observability Platforms

For developers, understanding the performance of shipped code is crucial. Through the last decade, a tablestake function in software monitoring and observability solutions has been to save and track app metrics. Engineers love tools that get out of your way and just work, and the appeal of today’s best-in-class application performance monitoring (APM) suites lies in a seamless day zero experience with drop-in agent installs, button click integrations, and immediate metrics collection.

Teams Call Quality Dashboard: The First Step In Teams Insight

Do you have much experience using the Call Quality Dashboard (CQD)? Does your team go on about it being a ‘good starting point’? Do you even know what the CQD does? Fear not. If you answered ‘no’ to any of those questions, we’re going to fill you in with all the details that matter and give you some additional direction on how to get the most out of them. The bottom line is they’re a good starting point, but a long way from being a proactive performance solution.

Paving the Road for Proactive Reliability

At Expedia Group, Kaushik Patel and Nikos Katirtzis have thousands of engineers and micro-services. Heterogeneity in terms of infrastructure and technologies used over the years created inefficiencies and posed the need for a set of automated best practices for our engineering teams. Over the past 2 years, using a data-driven approach, we’ve worked on creating a set of platforms that helps teams to adopt good reliability practices, including chaos engineering, release safety, or automatic failover between cloud regions. In this talk Kaushik and Nikos will cover the platforms they’ve built, including how they used data to drive their investment decisions.

Elevating Banking Excellence: Anodot's Real-Time Monitoring Revolution

In a recent article published by Economic Times on Dec 29, 2023, titled “Banks Told to Explore Dashboard with Real-Time Info on Services,” the Reserve Bank of India (RBI) has urged banks to embrace real-time transparency through the creation of an online dashboard. Anodot, a leader in business monitoring, is at the forefront of transforming the banking sector with its advanced real-time business monitoring dashboard designed for internal usage within banks. What does this mean?

Integrating Cribl Stream with the Built-in Tables of Microsoft Sentinel

Cribl’s integration catalog is ever-expanding. At Cribl, we constantly collect feedback on where to integrate next and channel it to deliver more high-impact integrations into our catalog. Whether it is Sources, Collectors, or Destinations, we constantly add new integrations to expand our reach in the IT security and observability ecosystem.

Browser Synthetic Monitoring: What is it, Types and Use Cases

Synthetic monitoring is a proactive approach that actively tests websites or apps, either scheduled or on demand, using automated testing scripts, ensuring that any issues are identified and resolved before they impact real users. This approach provides continuous oversight of the online presence, akin to having a vigilant eye on the website 24/7. In this article, we’re discussing synthetic monitoring, putting the accent on using browsers.

3 Straightforward Pros and Cons of Datadog for Log Analytics

Observability is a key pillar for today’s cloud-native companies. Cloud elasticity and the emergence of microservices architectures allow cloud native companies to build massively scalable architectures but also exponentially increase the complexity of IT systems.

What sets OpManager apart as reliable virtual server management software?

Fluctuations in network usage within organizations can occasionally surge due to several factors. For instance, increased traffic might stem from activities such as large-scale promotional campaigns, sudden software updates or patches, escalated remote work demands, or even unforeseen security incidents. An article published by the Financial Express claims e-commerce order volumes spiked by 23% in 2023 during Black Friday sales on the Unicommerce platform.

Network Assessment for A Successful IT Migration or Deployment

Deploying or migrating to a new service infrastructure within your business is always an exciting, but highly stressful venture. In order for a new service deployment or migration to be successful, businesses need to plan and prepare beforehand. A network assessment is the surest and easiest way for businesses to prepare their network for a deployment or migration without any hiccups.

The Importance of Traces for Modern APM [Part 2]

In part 1, we looked at how the design plan of traditional monitoring technologies depended heavily on properties of the systems that were intended to monitor and then showed how those properties began to be undermined by an increase in complexity, an increase which can ultimately be captured by the concept of entropy. In this part, we will explore how increased entropy forces us to rethink what is required for monitoring.

LLM Observability with OpenTelemetry and SigNoz

In the rapidly evolving world of Large Language Models (LLMs), ensuring peak performance and reliability is more critical than ever. This is where the concept of 'LLM Observability' comes into play. It's not just about monitoring outputs; it's about gaining deep insights into the internal workings of these complex systems.

Head in the Clouds - Understanding Why Cloud Monitoring is Important

Deploying an infrastructure in the cloud has become THE standard across the industry. According to O’Reilley Research, more than 90% of organizations are on the cloud or are using it in some capacity. As reported by Precedence Research, cloud deployment will surpass $1 trillion by the year 2028. But with the adoption of a new platform comes the need for tools and best practices to keep it up and running efficiently, which includes cloud-based monitoring.

Harmony in Chaos: Uniting Team Autonomy with End-to-End Observability for Business Success

Imagine a symphony where every musician plays their part flawlessly, but without a conductor to guide the orchestra, the result is just a discordant mess. Now apply that image to the modern IT landscape, where development and operations teams work with remarkable autonomy, each expertly playing their part. Agile methodologies and DevOps practices have empowered teams to build and manage their services independently, resulting in an environment that accelerates innovation and development.

AI, Privacy and Terms of Service Updates

Like everyone else in the world, we are thinking hard about how we can harness the power of AI and machine learning while also staying true to our core values around respecting the security and privacy of our users’ data. If you use Sentry, you might have seen our “Suggested Fix” button which uses GPT-3.5 to try to explain and resolve a problem. We have additional ideas being developed as well that we’re excited to preview.

Detect Java code-level issues with Seagence and Datadog

In Java applications, concurrency issues can be difficult to reproduce and debug. Because work is scheduled nondeterministically across threads, the conditions that have led to an error in one execution of the program may not trigger the same issue the next time around. Exceptions that are silently handled—also known as swallowed exceptions—can also be challenging to debug because they typically do not leave any trace in the logs.

A Day In The Life of Teams Productivity Loss

C-suiter, VP’er, or anyone who’s top of the pile in an enterprise faces inherent pressure that comes part and parcel with the role that they’re taking on. Many of the pressures can’t be overcome, it’s simply the nature of the beast. But dealing with technical issues in their day-to-day life is one of their biggest gripes, because it always feels like a problem that should be solved – not one needing to be dealt with again and again.

Shadow IT & How To Manage It Today

In the business world, shadow IT is a controversial topic. Gartner defines Shadow IT as any IT devices, software and services that are used outside or beyond the ownership or control of IT departments/ organizations. This includes: In a standard work environment, the IT department would be responsible for providing whatever IT solutions and work tools were needed across all business functions.

The concise guide to Loki: How to work with out-of-order and older logs

For this week’s installment of “The concise guide to Loki,” I’d like to focus on an interesting topic in Grafana Loki’s history: ingesting out-of-order logs. Those who’ve been with the project a while may remember a time when Loki would reject any logs that were older than a log line it had already received. It was certainly a nice simplification to Loki’s internals, but it was also a big inconvenience for a lot of real world use cases.

How HEAL Can Help You Manage Service Incidents Better

Service incidents are unavoidable in today’s complex and dynamic IT environments. They can cause significant disruption to business operations, customer satisfaction, and revenue. However, many organizations are still struggling to manage service incidents effectively. Here, we will explore some of the common challenges faced by ITOps team and how HEAL, an AI-powered tool, can help conquer them.

2023 at a glance: The digital enterprise era and ManageEngine

2023 was not just another calendar year; it was a testament to our relentless pursuit of empowering digital excellence in global enterprises. As the sun sets on another remarkable 12 months, we at ManageEngine reflect on a journey marked by innovation, growth, and profound impact.

Client Testimonial - Carhartt

In this featured video, Earl Williams, a Systems Engineer at Carhartt and a longtime Galileo customer, shares a story about how Galileo helped them address a persistent issue within a critical application at their distribution center. Despite increasing CPU and memory resources as instructed by the application vendor, a problem persisted for Carhartt.

10 Most Asked Network Performance Questions

From speaking with IT professionals, clients, and employees from other network-reliant departments, our team has put together a list of the 10 most asked network performance and network questions to give you a basic understanding of network performance. With many businesses booming, and remote work on the rise, monitoring your business’ network performance has become more important than ever.

Top 11 Grafana Alternatives & Competitors [2024]

Are you looking for Grafana alternatives? Then you have come to the right place. Grafana started as a data visualization tool. It slowly evolved into a tool that can take data from multiple data sources for visualization. For observability, Grafana offers the LGTM stack (Loki for logs, Grafana for visualization, Tempo for traces, and Mimir for metrics). You need to configure and maintain multiple configurations for a full-stack observability setup.

With OpenTelemetry, ComplyAdvantage overhauled its observability (twice)

ComplyAdvantage, which provides compliance and risk management tools, has overhauled its observability platform twice in two years, first moving from on-prem Grafana OSS to Datadog, and then migrating from Datadog to Grafana Cloud. Join Principal SRE Adam Wilson to hear how his team’s approach to observability evolved, and how their increased OTel usage made it possible to migrate twice — and to get the most out of Grafana Cloud for metrics, logs, traces, Kubernetes monitoring, and more.

Optimizing your website's health: A comprehensive guide to monitoring alerts

Website downtime can significantly negatively impact businesses that rely on their online presence and connectivity. Without a website, companies can lose sales, damage their reputation, and frustrate customers trying to access information or services. That's why having an effective alert system for website and application monitoring is critical.

Understanding Scalability in Cloud Services - Azure and AWS Face-Off

As businesses expand and adapt to the digital era, the need for scalable cloud services becomes paramount. Scalability—the ability of a system to handle growing workloads—ensures that enterprises can thrive without hardware constraints. Industry leaders such as Azure and AWS have been at the forefront of this evolution, continuously enhancing their platforms to provide seamless scalability.

RED Monitoring: Rate Errors, and Duration

The RED method is a streamlined approach for monitoring microservices and other request-driven applications, focusing on three critical metrics: Rate, Errors, and Duration. Originating from the principles established by Google's "Four Golden Signals," the RED monitoring framework offers a pragmatic and user-centric perspective on service performance.

Fix your actual slow-loading assets with Resource Monitoring

Slow-loading assets on your web pages can lead to frustrated users, high bounce rates, and lost conversions. For the vast majority of websites, slow-loading resources will be your main performance bottleneck. There’s no way to get around going through the network for essential resources like JavaScript, CSS, and images — thus, it’s crucial that you can quickly identify and fix your slow-loading assets.

How to create alerts to monitor sensor data with Grafana, Prometheus, and Telegram

When monitoring sensor data, such as data from a weather station, a home security system, or a home automation assistant, it’s useful to have an alerting system in place, as well. By setting up alerts for sensor data, you can automatically receive notifications when any significant event occurs — whether that’s someone arriving at your front door or a thunderstorm rolling in.

Product Managing to Prevent Burnout

I’m currently working on a small team within Honeycomb where we’re building an ambitious new feature. We’re excited—heck, the whole company is—and even our customers are knocking on our door. The energy is there. With all this excitement, I’ve been thinking about a risk that—if I'm not careful—could severely hinder my team's ability to ship on time, celebrate success, and continue work after launch: burnout.

Quickly remediate issues in your Azure applications with Datadog Workflow Automation

Datadog Workflow Automation speeds up incident response and remediation for DevOps, SRE, and security teams by enabling them to automatically run predefined task sequences whenever specific alerts or security signals are triggered. After the feature’s initial release in 2023, Datadog is now excited to announce a significant expansion of its Workflow Automation capabilities with Azure actions, allowing engineers to create automated workflows for their Azure resources for the first time.

Lightrun LogOptimizer Gets A Developer Productivity and Logging Cost Reduction Boost

Lightrun’s LogOptimizer stands as a groundbreaking automated solution for log optimization and cost reduction in logging. An integral part of the Lightrun IDE plugins, this tool empowers developers to swiftly scan their source code—be it a single file or entire projects—to identify and replace log lines with Lightrun’s dynamic logs, all within seconds.

Implementing OTEL for Kubernetes Monitoring

Kubernetes is a top container orchestration platform. The Kubernetes clusters manage everything much from collecting to storing vast magnitudes of data from your multiple applications. It is this very property that can sometimes boom into an unending data pile later on. Imagine a large warehouse of apparel, it has every size of clothing for men, women, and children. Now if you are asked to pick out one particular type from it within a small time frame, I know you will totally dread it.

How to Scan Network for IP Addresses? - Guide With 6 Best Tools

In an age of connectivity, identifying IP addresses within your network is crucial for maintaining, managing, and protecting your network infrastructure. Your network may include printers, routers, IoT devices, computers, and servers. Trying to identify them manually can be daunting, as it may take time and be error prone. Thus, you need an efficient solution to scan IP addresses. How to Scan a Network for All IP Addresses? Scanning a Network With IP Scanners 6 Best IP Scanners 1.

What's New at Kentik, Episode 2

Join Leon Adato in the second episode of "What's New at Kentik" as he shares the latest updates and insights from Kentik. In this episode, Leon discusses Kentik's participation at AWS re:Invent, highlighting the significance of such events for networking and business development. He shares some new capabilities of Kentik's Data Explorer query API, making it more robust and user-friendly.

Improved Dashboard Performance, Better Trace View UX & New Logs Processors - SigNal 32

Welcome to the last SigNal of 2023! 12 months of building and shipping things to make open-source observability available to teams of all sizes. What a great journey it has been for Team SigNoz in the year 2023. We crossed some great milestones - raised $6.5MN to supercharge our growth, more than 15,000 Github stars, and 8.6 million Docker downloads. And the best part of our journey has been building with our community.

Database monitoring for beginners: 6 steps to get you started

Database monitoring refers to the continuous process of tracking and analyzing the health and performance of a database. It’s essentially a regularized health check-up for your data management system that diagnoses anomalies and helps identify potential issues before they escalate. By persistently monitoring databases, you can ensure that they’re functioning optimally and there is no obstruction of data flows to dependent resources.

Optimizing macOS Digital Experience

In the realm of tech diversity, organizations face the formidable task of delivering flawless digital experiences on many devices and operating systems. The performance and reliability of these disparate systems, and their networks, significantly impacts user experience, be it web browsing, application sharing, or remote server operations. Among these challenges, macOS, Apple’s widely adopted operating system, holds particular challenges when it comes to optimizing experience and networking.

Top 6 Distributed Tracing Tools in 2024

Distributed tracing is the functionality to trace requests or messages flowing through different systems or environments like frontend, Backend, middleware. Distributed tracing brings connectivity or visibility of various services using a unique identifier. This identifier is passed to different services to correlate them as a single flow. We track data from different services with distributed tracing, but how do we visualize them? Visualization is a tedious task.

Top 10 Consent Management Platforms to Make Your Website Compliant

In the online world, the unassuming cookie plays a pivotal role and serves as small data stored by websites in visitors’ browsers. As users navigate the Internet using their browsers, these cookies — which are crucial for recognizing returning users — accumulate in vast numbers, even during a single website visit. Various entities, including the website itself and third-party platforms like Google Analytics, add virtual cookies.

An Introduction to OpenTelemetry JavaScript

Monitoring and observing application performance is a cornerstone for maintaining robust and efficient systems in the ever-evolving development landscape. One key player in this domain is OpenTelemetry. This post provides a comprehensive tutorial and unpacks what OpenTelemetry is, its applications and integration into the JavaScript ecosystem.

New Year's Resolutions For Peak Microsoft Teams Productivity and ROI

Ready for the New Year? Got your obligatory one-month gym membership lined up and a wine rack that’s empty on purpose? Most people at this time of year set themselves some resolutions to make this year the best yet. Unfortunately, pretty much everyone flakes out by about the third week of Jan… so why don’t you beat the trend and make some of them stick?

Committed to Observability Excellence: Logz.io's Open 360 Observability Platform Takes Home Over a Dozen Winter G2 Badges

As we continue to iterate and help organizations meet their observability goals, Logz.io is thrilled to announce we’ve earned over a dozen Winter 2023 G2 Badges for our Logz.io Open 360™ essential observability platform! G2 Research is a tech marketplace where people can discover, review, and manage the software they need to reach their potential. Here are the Winter 2023 G2 Badges we’ve taken home for Application Performance Monitoring (APM) and Log Analysis.

Transforming Web Performance with Catchpoint's Enhanced Website Experience Solution

Delivering flawless customer experiences is no longer a luxury but a necessity in today’s digital landscape. Any interruption in the user journey can lead to lost sales and revenue and damage your brand’s reputation. At Catchpoint, we’re dedicated to helping you deliver exceptional digital experiences to your users worldwide. That’s why we constantly enhance our Website Experience solution, powered by WebPageTest, the gold standard in web performance testing.

The MongoDB Monitoring Toolkit

MongoDB is renowned for its ability to scale horizontally, accommodate dynamic schemas, and deliver high-performance results. However, the seamless operation of any database, including MongoDB, relies heavily on efficient monitoring to uncover insights, identify potential bottlenecks, and proactively address issues that may compromise performance and reliability.

How Observability Enhances Financial Services

Financial services and financial technology (FinTech) companies often depend upon complex infrastructure to handle their financial data. Security and compliance are paramount for these organizations, for gaining full visibility into the health and performance of these services to guarantee security is essential.

How to export Azure Monitor Metrics using OpenTelemetry to SigNoz

Using OpenTelemetry Collector, you can collect metrics from Azure monitor and export them to any backend of your choice. Azure Monitor is a powerful service within the Microsoft Azure ecosystem that provides extensive metrics and logging capabilities. Yet the siloed nature of data in such tools can obscure the bigger picture, hindering a holistic view of system health. In this tutorial, we cover: If you want to jump straight into implementation, start with this Prerequisites section.

Evolving Cribl's Own Observability Practice at Blazing Speed

Cribl.Cloud has grown substantially since its launch, and our observability practice has developed in parallel. Gone are the early days of manageable logs and metrics. As we continue to grow, that problem will become even more challenging. We used Splunk internally, a well-used internal system, as our primary event management system. With Cribl Edge nodes deployed across our entire cloud fleet, we collect logs and metrics and send them to Cribl Stream for processing and routing.

Log Wrangling: Leveraging Logs to Optimize Your System

Today, we delve into the art and science of Log Wrangling. This process involves corralling, organizing, and deriving maximum benefits from your logs like handling unpredictable livestock. Why do we do this? Managing logs can be challenging, but we can transform them from a daunting task with the correct approach into a beneficial tool… Graylog.

Cloud Network Monitoring: Ensuring Visibility in a Distributed World

As businesses transition to the cloud, the need for strategic implementation of Cloud Network Monitoring has become essential. This is because IT managers and CIOs across organizations are looking for robust real-time monitoring, performance optimization, and security vigilance for their distributed network. If you’re also thinking of cloud networking monitoring and want to know more about it in detail, continue reading this article further.

Coralogix vs Cloudwatch: Support, Pricing, Features & More

Cloudwatch is a standard component for any AWS user, with tight integrations into every AWS service. While Cloudwatch initially seems like a cost-effective solution, its lack of functionality and flexibility can result in higher costs. Let’s explore Coralogix vs Cloudwatch.

Two smallish improvements to our DNS check

As you probably know, Oh Dear is run by a small but capable team. One of the advantages of being small is that we can implement stuff pretty quickly: there’s no red tape, and our code base is very healthy. So, when our users have feature requests that make sense to add to Oh Dear, we can move fast. In the past month, we implemented two smallish feature requests for our DNS check we got through support. Here’s what our new DNS settings screens look like.
8 Best IT Monitoring Tools and Software of 2024 (Updated)

Monitoring tools, also known as observability solutions, are designed to track the status of critical IT applications, networks, infrastructures, websites and more. The best IT monitoring tools quickly detect problems in resources and alert the right respondents to resolve critical issues. Response teams use observability solutions to gain real-time insights into resource availability, stability and performance.

Laravel Pulse cards to show response times, scheduled jobs, broken links

Today, we released the ohdearapp/ohdear-pulse package, which contains Laravel Pulse cards to show you the status of your scheduled jobs, any broken links you have in your Laravel app, and uptime / HTTP performance stats. All of these cards use the Oh Dear API to fetch their data. Laravel Pulse is a first party package that can display a dashboard with information surrounding usage and performance of your Laravel app. Here’s how a default installation looks like.