Operations | Monitoring | ITSM | DevOps | Cloud

How the DoD is embracing OSS and DevSecOps modernization with Grafana

When it comes to observability, we believe open source will win in the end. It’s a sentiment shared by a wide spectrum of users, whether they work in auto manufacturing, banking, or shipping. The U.S. federal government is yet another industry to prove this, showing that even those operating under the strictest security and compliance requirements see OSS as their preferred approach.

Translate Datadog metrics into OTLP with the OpenTelemetry Collector and Grafana Alloy

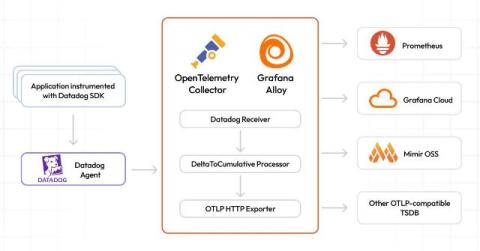
Today, we are excited to announce that we are releasing new code for the OpenTelemetry Datadog receiver as open source. This code allows users to translate Datadog metric formats into native OTLP format. These metrics can then be sent to any OpenTelemetry-compatible metrics system, whether it’s Prometheus, Grafana Mimir, or another backend database.

How to use OpenTelemetry resource attributes and Grafana Cloud Application Observability to accelerate root cause analysis

Let’s imagine a scenario: you use OpenTelemetry, and your observability backend runs on several hosts. You collect data on application latency, and notice a recent increase that you want to investigate. But how will you know which host caused the degradation? This is exactly where OpenTelmetry resources come in. In the context of OpenTelemetry, a resource represents the entity producing the telemetry data, such as a container, host, process, service, or operating system.

Introduction to Ingesting OpenTelemetry Logs with Loki | Zero to Hero: Loki | Grafana

Have you just discovered Grafana Loki and are planning to use OpenTelemetry as your instrumentation tool of choice? Or looking for an introduction to what OpenTelemetry is? In this Zero to Hero episode, we cover the basics of instrumenting your code with the Otel SDK, the Otel Collector and the new native Otel endpoint of Loki.

Curated dashboards in Honeybadger

Earlier this year, we introduced a new logging and performance monitoring tool, Honeybadger Insights. You can finally send your logs, application events, and telemetry data to Honeybadger! Once you do, you can query your logs and events to diagnose performance issues, perform root-cause analyses, and create beautiful charts and dashboards to see what's happening in real time.

How Dell successfully migrated to Grafana Cloud and consolidated its observability in the process

While some monitoring tools excel at a specific task, observability works best when you have a holistic view of your system. You need a platform capable of working with all of your telemetry collectively, otherwise you can end up with a complex, inefficient, and expensive collection of incongruent, siloed tools. That’s what one team at Dell Technologies realized before they made a switch to Grafana Cloud last year.

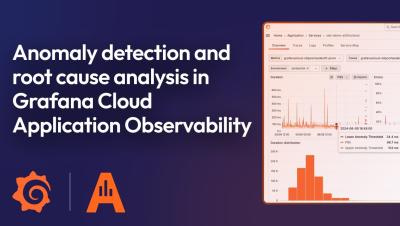
Anomaly detection and root cause analysis with Application Observability | Grafana Cloud

In this video, we walk you through the latest features of Grafana Cloud Application Observability, designed to accelerate anomaly detection and root cause analysis. Application Observability offers an out-of-the-box solution for monitoring applications and minimizing MTTR. It natively supports both OpenTelemetry and Prometheus and allows you to seamlessly unify application and infrastructure insights.