Operations | Monitoring | ITSM | DevOps | Cloud

Get insights from logs without writing a query: Explore Logs is in Public Preview

Whether it’s 3 in the morning and you’re trying to resolve an outage, or you’re testing a new feature and you need to resolve a recurring issue so you can move on to your next task: time is of the essence. Wouldn’t it be great if your observability tooling could direct you to your “aha” moment, without you needing to fumble with writing a query?
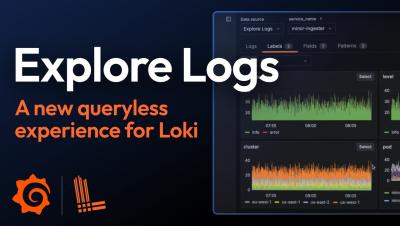
Explore Logs - A new queryless experience for Loki | Grafana

Mat Ryer takes you through the new way to explore your logs using a queryless, click-based user experience for Grafana Loki. Grafana Cloud is the easiest way to get started with Grafana dashboards, metrics, logs, and traces. Our forever-free tier includes access to 10k metrics, 50GB logs, 50GB traces and more. We also have plans for every use case.

How to visualize Azure Resource Graph data with KQL

Using SquaredUp, you can query Azure Resource Graph with KQL to pull Change history, Azure Service Health and maintenance schedules. For the uninitiated, Azure Resource Graph is a series of tables holding information on Azure resources and how they are related. Its data is used many places within Azure itself (such as the Azure Portal’s native search) and it’s data can help us with many use cases as it is designed to help with queries at scale.

Grafana Cloud updates: Kubernetes Monitoring enhancements, browser tests in Grafana Cloud k6, and more

We consistently roll out helpful updates and fun features in Grafana Cloud, our fully managed observability platform powered by the open source Grafana LGTM Stack (Loki for logs, Grafana for visualization, Tempo for traces, and Mimir for metrics). In case you missed it, here’s a roundup of the latest and greatest updates for Grafana Cloud this month. You can also read about all the features we add to Grafana Cloud in our What’s New in Grafana Cloud documentation.

SQUPCAST Ep. 8: Relayed from behind enemy lines

In this episode we're chatting with Matthew Long from our engineering team about how our Relay Agent get's behind enemy lines to surface all your juicy on-prem enterprise data into our fancy cloud dashboards. We'll cover the classic server deployment and chat about some container-based options too.

Performance testing with Grafana k6 and GitHub Actions

By running performance tests continuously and automatically, you can identify and correct performance regressions as they occur. One way to do this is by integrating performance testing into your development process. In this step-by-step post, we explore how to do just that, using Grafana k6 and GitHub Actions. k6 is an open source load testing tool to test the performance of APIs, microservices, and websites.

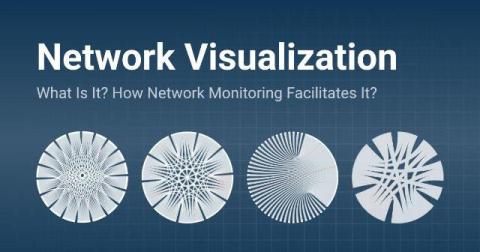
What is Network Visualization & How Network Monitoring Facilitates It

Tired of endless data and complex graphs? Learn what network visualization is and how network monitoring helps you achieve it to visualize your network. Networks are the backbone of business operations, connecting everything from data centers and office branches to cloud services and remote workers. As these networks grow increasingly complex, managing, maintaining and understanding the various flows of traffic in larger networks becomes a significant challenge for many companies.

API monitoring with Traefik, Grafana, and OpenTelemetry (Grafana Office Hours #28)

Maytham Alfouadi (Solutions Architect) and Immánuel Fodor (Product Manager) from Traefik Labs give us a demonstration of how to do API monitoring with Traefik, Grafana, and OpenTelemetry. They talk about Traefik, an open-source reverse proxy, among other things, that is now included by default in k3s and Rancher. They are joined by Usman Ahmad and Nicole van der Hoeven, both Senior Developer Advocates at Grafana Labs.

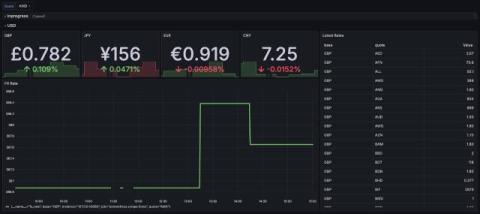
Observing exchange rates: How to keep tabs on currencies during the summer travel season

It’s summertime in the Northern Hemisphere, and for many people that means it’s also travel season. But before you depart for your dream holiday, don’t forget the essentials: passport, suitcase, and … Grafana? That’s right. If you’re headed to a different country, odds are you’ll use a different currency when you get there. And you can use Grafana to track changes in the exchange rates so you can get the most bang for your buck.