Operations | Monitoring | ITSM | DevOps | Cloud

AppSignal for Ruby Gem 3.1: MRI VM Magic Dashboard

We're very excited to release AppSignal for Ruby gem 3.1, which adds a Magic Dashboard for MRI VM stats. By upgrading to the latest Ruby gem, you'll automatically get this dashboard created in AppSignal as soon as data from the new probe starts flowing in. Here's what you'll see: Magic Dashboards give people amazing insights into applications with zero setup. They work automagically to give your team performance insights into gems like Puma, Sidekiq, ActiveJob, ActionMailer, and others.
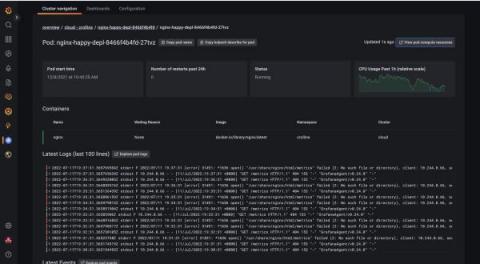
Introducing instant Kubernetes logging with Kubernetes Monitoring in Grafana Cloud

Kubernetes, Prometheus, and Grafana are a trio of technologies that have transformed cloud native development. However, despite how powerful these three technologies are, developers still face gaps in the process of implementing a mature Kubernetes environment.

Grafana Labs founders on the future of observability and how to scale an open source company

“Overwhelming.” It was the only word Grafana Labs CEO and Co-founder Raj Dutt could use to describe how it felt to look out at the sea of more than 600 Grafanistas gathered together in Whistler, British Columbia, for the first company-wide employee event in two years.

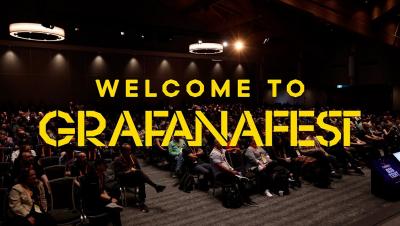
Welcome to Grafanafest

Grafana Labs brought together more than 600 Grafanistas in Whistler, British Columbia for Grafanafest, our first-ever company-wide celebration of the people behind our products. As a remote-first company, we recognize the value of in-person connections and were thrilled to host Grafana Labs employees from more than 40 countries representing all departments within the organization in May 2022. We bonded, we skiied, we danced, and we wore a lot of Grafana swag.

How to improve uptime with real-time monitoring, Grafana dashboards, and Grafana Loki: Inside Dish Network's observability stack

Dish Network is on a mission to connect people and things by changing the way the world communicates. With products ranging from Dish and Sling TV to retail wireless services and 5G networks, monitoring their satellite communications equipment is mission critical to maintaining extreme uptime for Dish’s 20 million customers across the United States.

How to get One-click SCOM Root Cause Analysis

SCOM has incredible powers, but it’s not always easy to find the root cause of issues fast. And you definitely don’t get one-click SCOM root cause analysis. We’ve all been there. A business-critical server goes down and you don’t know why. Let’s imagine you had a dashboard showing the health statuses of all your server groups and you notice that the United States is showing as critical.

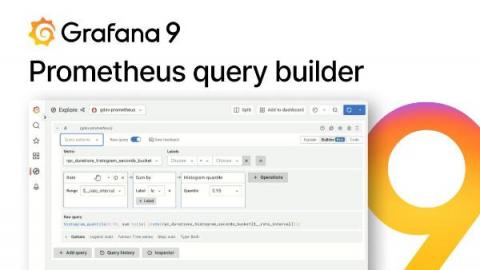
New in Grafana 9: The Prometheus query builder makes writing PromQL queries easier

When Grafana started in 2014, its main goal was to be a great dashboarding solution for Graphite. Around the same time, the Prometheus project started to gain steam, but it wasn’t clear whether it should be added to Grafana. After all, Grafana was a Graphite frontend, it was uncertain at the time if Prometheus would take off in popularity, and it would take resources away from the core purpose of why Grafana was created.

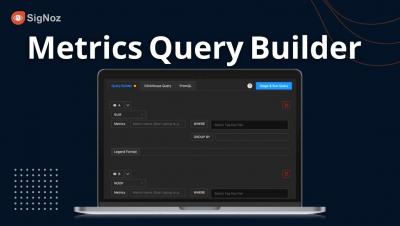
Metrics Query Builder to make Advanced and Custom Dashboards for your Application | SigNoz

In this video, Pranay Prateek (CEO, SigNoz, [email protected]) walks you through the basic functionality of Query Builder using Signoz followed by Srikant, one of our best software engineer at SigNoz shows us in detail of all the super useful and advanced features of Metrics Query Builder. Agenda of the video: Do checkout our other Instrumentation videos as well!