Operations | Monitoring | ITSM | DevOps | Cloud

How to reduce MTTR with Grafana Loki and Grafana Tempo: Inside the Houzz observability renovation

Houzz is where millions of homeowners and home improvement professionals go to seek inspiration and supplies for their remodeling projects. But to continue as the leading platform for home remodeling and design, the Houzz tech stack needed a renovation of its own as the company scaled. In response, the Houzz team began by revamping their monoliths into microservices.


How to get started with the new Grafana Ansible collection for Grafana Cloud

More than 20,000 companies around the world use Ansible as their Infrastructure as Code and configuration management tool. With the rising popularity towards managing infrastructure using IaC and config management tools, Ansible is one of the best open source tools to choose from. That is why we are excited to announce a new Grafana Ansible collection available to all Grafana Cloud users, including those in the generous free tier.

Automatically Convert Grafana Dashboards from InfluxQL to PromQL with a New Open Source Tool

It’s monitoring time. We all collect metrics from our system and applications to monitor their health, availability and performance. Our metrics are essentially time-series data collected from various endpoints. Then, it is stored in time series specialized databases, and then visualized in the metrics graphs we all know and love.

Monitor Ruby Application Performance with Magic Dashboards

Application teams must understand what their customer experience is like. This is true not only from a general perspective (in terms of usability and responsiveness) but also on a day-to-day, minute-by-minute basis. In particular, when you work with distributed systems, errors are inevitable. Site traffic fluctuates throughout the day, and any one of a system’s dependencies could also encounter an issue at any time.

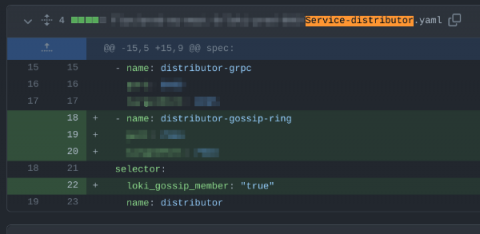
How adding Kubernetes label selectors caused an outage in Grafana Cloud Logs - and how we resolved it

Hello, I’m Callum. I work on Grafana Loki, including the hosted Grafana Cloud Logs offering. Grafana Loki is a distributed multi-tenant system for storing log data — ingestion, querying, all that fun stuff. It also powers Grafana Cloud Logs.

Introduction to various Kubernetes dashboards by @Saiyam Pathak

In this session, Saiyam Pathak, Director of Technical Evangelism at Civo will discuss various Kubernetes dashboards that can be used to view the cluster and its related metrics and discuss the benefits of each. Saiyam will also look into the Kubernetes dashboard, Skooner, Headlamp, Lens, and Octant.

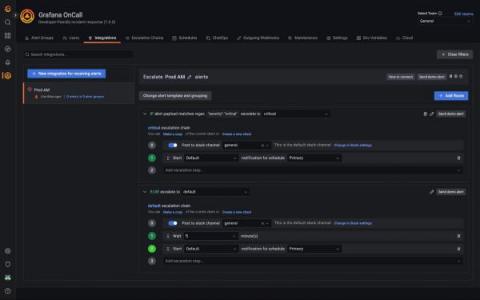
Get started with Grafana OnCall and Terraform

Managing on-call schedules and escalation chains, especially across many teams, can get cumbersome and error prone. This can be especially difficult without as-code workflows. Here on the Grafana OnCall team, we’re focused on making Grafana OnCall as easy to use as possible. We want to make it easier to reduce errors with your on-call schedules, create schedule and escalation templates quickly, and fit on-call management into your existing as-code patterns.

An Introduction to PromQL: How to Write Simple Queries

PromQL is a flexible language designed to make it easy for users to perform ad-hoc queries against their data. By default, Prometheus indexes all of the fields in each metric except for source and target, which are not indexed by default. Prometheus is an open-source tool that lets you monitor Kubernetes clusters and applications. It collects data from monitoring targets by scraping metrics HTTP endpoints.