Operations | Monitoring | ITSM | DevOps | Cloud

Grafana 9.2: Create, edit queries easier with the new Grafana Loki query variable editor

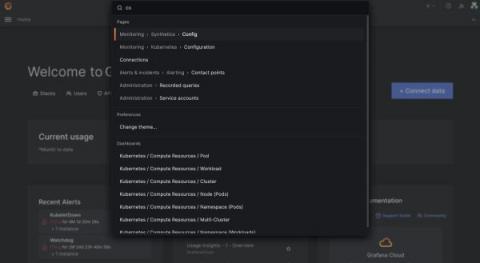
As part of the Grafana 9.2 release, we’re making it easier to create dynamic and interactive dashboards with a new and improved Grafana Loki query variable editor. Templating is a great option if you don’t want to deal with hard-coding certain elements in your queries, like the names of specific servers or applications. Previously, you had to remember and enter specific syntax in order to run queries on label names or values.

Watch: How to get started with Grafana Phlare for continuous profiling

A big piece of news to come out of ObservabilityCON in early November was the launch of Grafana Phlare. Phlare is an open source, horizontally scalable, highly available, multi-tenant continuous profiling aggregation system. Continuous profiling has been dubbed the fourth pillar of observability, after metrics, logs, and traces. The idea behind Phlare was sparked during a company-wide hackathon at Grafana Labs.

How many data sources do you monitor? Find out how you measure up in our Observability Survey

Here at Grafana Labs, we’re deeply committed to our “big tent” philosophy — the idea that disparate data sources, from different software providers, in different industries, built for completely different use cases, can come together in one composable observability platform. As part of that commitment, we’ve set out to hear from our community about their observability practice and what they hope to see in this space in the future.

Grafana Agent 0.29.0 release: New OpenTelemetry components

Today the Grafana Agent team is excited to announce the release of Grafana Agent v0.29.0. This September, we introduced a new way to easily run and configure Grafana Agent called Grafana Agent Flow, our new dynamic configuration runtime built on components. Within Flow, we are also embracing Grafana Labs’ big tent philosophy by introducing OpenTelemetry (OTel) Collector components and converters for traces, metrics, and logs in Agent v0.29.0.

How to monitor Windows logs with the updated Windows integration for Grafana Cloud

As we all know, Windows is one of the most popular operating systems in the world. It has a dominant share in the desktop computer market, with more than 70% of the machines running the operating system. It makes sense, then, that the Windows integration is also one of the most used and popular integrations in Grafana Cloud.

Grafana Labs Writers' Toolkit: This is the way

At Grafana Labs, we understand that clear, informative technical documentation is critical to users’ success, whether they’re just getting started or trying to quickly troubleshoot an issue. That’s why the Documentation and Technical Writing Team at Grafana Labs is pleased to announce the launch of our very first, very own writers’ toolkit.

How to correlate performance testing and distributed tracing to proactively improve reliability

At ObservabilityCON, we announced our first step towards launching a native integration between Grafana k6 load testing and Grafana Tempo tracing (k6 x Tempo) in Grafana Cloud. We created k6 x Tempo to help dev, testing, and operation teams analyze their performance test results more effectively and proactively improve the reliability of their business-critical applications.

Introduction to continuous profiling

In this video, we will review the advantages of continuous profiling, the difference between continuous profiling vs. traditional profiling, and how continuous profiling can fit into your overall observability strategy. You’ll also learn more about Grafana Phlare, the new open source continuous profiling database, and get a look at the latest flame graph visualization in Grafana.