Operations | Monitoring | ITSM | DevOps | Cloud

Grafana ObservabilityCON 2022 Keynote

Live from New York, it’s Grafana ObservabilityCON! Join CEO/Co-founder Raj Dutt, VP of Technology Tom Wilkie, and members of the Grafana Labs engineering team for a look at the latest developments in the open and composable LGTM (Loki-Grafana-Tempo-Mimir) observability stack. Spoiler alert: There will be some exciting announcements!

Introduction to continuous profiling

In this video, we will review the advantages of continuous profiling, the difference between continuous profiling vs. traditional profiling, and how continuous profiling can fit into your overall observability strategy. You’ll also learn more about Grafana Phlare, the new open source continuous profiling database, and get a look at the latest flame graph visualization in Grafana.

Watch Grafana Labs CEO, Co-founder Raj Dutt discuss why companies need observability

Grafana Labs CEO and Co-founder Raj Dutt sat down with “NYSE Floor Talk” ahead of ObservabilityCON to discuss why companies are increasingly focused on observability as a means to improve customer satisfaction. In his conversation with Judy Khan Shaw, host of “NYSE Floor Talk,” Dutt also talked about Grafana Labs’ big tent philosophy and the growth of Grafana Labs and the Grafana open source community.

Reduce MTTR and improve UX with Grafana Enterprise: Inside Optum's observability stack

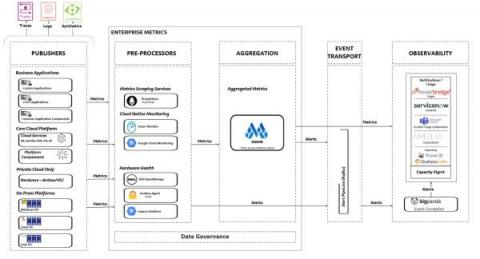
Among the 12 greatest stressors in life, six revolve around healthcare issues. From loss of a loved one to pregnancy and even retirement, these events often involve interactions with healthcare services — interactions that can either add to an individual’s stress or, ideally, help alleviate it.

How to monitor the health and resource usage of Kubernetes nodes in Grafana Cloud

The spine is essential to perform every activity, like crawling, walking, or swimming. Just as the spine is necessary to enable these functions, your Kubernetes infrastructure needs a backbone to be efficient and effective. So if Kubernetes clusters act as the spine of your architecture, then Kubernetes nodes are like the vertebrae — they make up a Kubernetes cluster in the same way the vertebrae form the spinal column.

Grafana and Cilium: Deep eBPF-powered observability for Kubernetes and cloud native infrastructure

Today, Grafana Labs announced a strategic partnership with Isovalent, the creators of Cilium, to make it easy for platform and application teams to gain deep insights into the connectivity, security, and performance of the applications running on Kubernetes by leveraging the Grafana open source observability stack.

How to autoscale Grafana Loki queries using KEDA

Grafana Loki is Grafana Labs’ open source log aggregation system inspired by Prometheus. Loki is horizontally scalable, highly available, and multi-tenant. In addition, Grafana Cloud Logs is our fully managed, lightweight, and cost-effective log aggregation system based on Grafana Loki, with free and paid options for individuals, teams, and large enterprises.