Operations | Monitoring | ITSM | DevOps | Cloud
November 2021
AppDynamics is now an AWS Migration and Modernization Competency Partner
The AWS Migration and Modernization Competency identifies industry leaders with proven technical proficiency and customer success. That's AppDynamics.
Microsoft Teams on Citrix: Configuration and Deployment
Since early 2020, there has been a massive growth in the number of active Microsoft Teams users and organizations deploying Teams; now, there are more than 200 million monthly active users across the globe. With an increase in market share, it’s one of those applications that you either expect an organization to be already using or planning to deploy out to their environment sooner rather than later.
Best Practices to Monitor Node.js Performance
Built on the V8 JavaScript engine of Chrome, Node.js is a very lightweight, open-source framework with minimum modules. And since it is an asynchronous system by default, it is faster than most other frameworks. DevOps still need Node.js monitoring to ensure performance better than other frameworks. In order to understand how relevant Node.js still is, note that PayPal, Reddit, LinkedIn, Amazon, Netflix and other high-use, high-visibility service providers use the framework.
What is APM? Overview and Features (The Beginner's Guide)
Application performance monitoring (APM) extends observability beyond system availability, service performance, and response times in current, cloud-native contexts. Organizations can improve user experiences at the scale of modern computing by using automatic and intelligent observability. User experiences in software applications are monitored and managed using APM technologies.
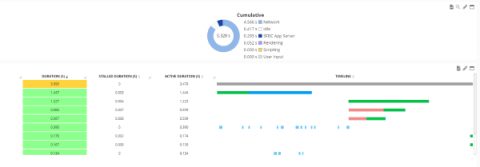
Troubleshoot Javascript (in real-time)
Javascript execution analysis on dev environments is easy—just use Google Developer or some other free tools. However, getting the same level of analysis while your application is being used by a real user is much harder. You can’t possibly ask the end-user to help you troubleshoot. Even if you did, the user probably wouldn’t know what to do and they definitely wouldn’t be impressed by your organization.
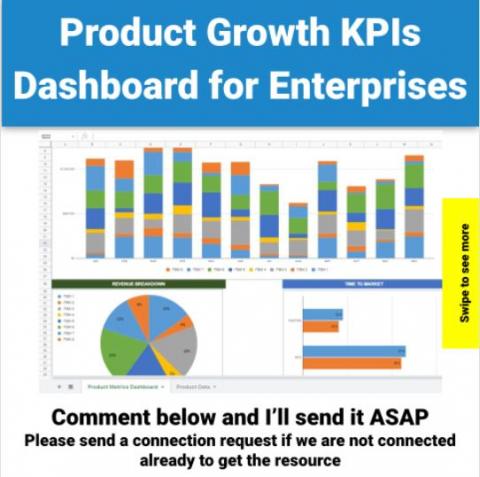
Product Growth KPIs Dashboard for Enterprises
There can be as many as 64 important business metrics for your company to track (according to nTask). That can sound daunting. But if your organization doesn’t have the capacity to track all of them, it should at least track the most important ones according to its business model, stage and focus areas. For example, key product metrics not only provide information to product managers, but also other relevant stakeholders across the organization.
Setting up Alerts on Metrics with SigNoz
Tip of the Month: Measuring Cluster Performance within a Tier
This Month in Datadog: November 2021 (Episode 6)
Monitoring Elastic Enterprise Search performance using Elastic APM
Elastic APM is a free, open and powerful observability tool that provides intelligence into application performance for a myriad of production applications (e.g., throughput, error rates, latency, resource usage, transaction traces). You can now enable Elastic APM integration to gain deep insight into the performance behaviors of your Elastic Enterprise Search deployment!
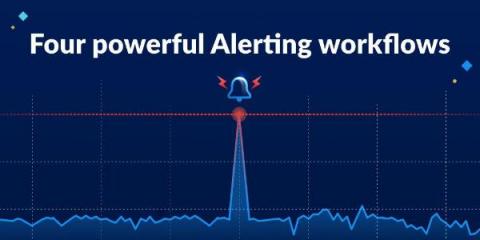
Four powerful Alerting workflows
Datadog vs. Dynatrace vs. Scout
Application Performance Monitoring is undoubtedly the hottest tool to accelerate any product’s growth in the modern market. The term has grown from a simple performance tracking operation to full-fledged infrastructure, network, and application observability. This evolution has only helped bring more and more growth into products. It is essential to choose the best-suited monitoring solution for your apps since observability involves way too many moving pieces.
Rest easy; you won't kill Santa Claus
Slow applications don’t make the season any brighter. For many IT pros, it’s a time of war rooms and swarming. How are you going to sleep this holiday season? “It sems that when people have a less-than-favorable online experience, they fault the company immediately.
Partner Integration - Dynatrace with PagerDuty and Rundeck
Tip of the Month: Experience Journey Map
Tip of the Month: Instrumenting AWS Lambda Functions with AppDynamics
Tip of the Month: Customer Resources
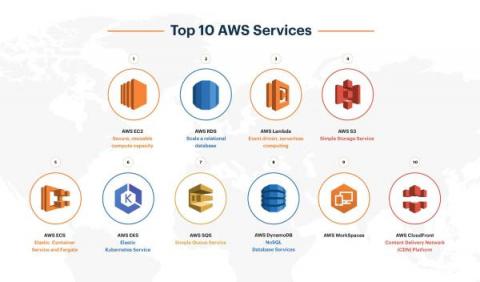
Top 10 AWS Services Explained With Use Cases
Amazon Web Services (AWS) is one of the most comprehensive and broadly adopted cloud service providers in the industry, offering over 200 fully featured services from data centers globally. A large spectrum of clients across verticals uses AWS to lower costs, become more agile and innovate faster. A recent survey estimates that AWS is the largest cloud service provider and accounts for 32% of the worldwide cloud services market.
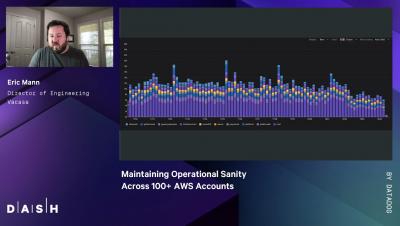
Maintaining Operational Sanity Across 100+ AWS Accounts | Eric Mann / Ryan Tomac (Vacasa)
Reverse Connect for Azure Virtual Desktops (AVD)
There’s something common between AVD and eG Enterprise. Can you take a wild guess? Listening on open TCP ports is an extremely bad practice for cloud architectures, as it exposes products and services to accepting incoming messages from malicious parties. This is something eG Innovations avoids in our own products (see details). This is also a best practice adopted by Microsoft for Azure Virtual Desktops (AVD).
Gain real-time, end-to-end visibility across your containers with the AppDynamics Prometheus Extension
Gain full-stack observability across your containerized applications and services with AppDynamics and Amazon Managed Service for Prometheus (AMP).
11 Reasons Why You Should Migrate to Next-Generation DX APM
The current version of DX APM continues a long history of innovation for APM technology. More than two decades ago, the solution was the pioneer in byte code instrumentation. DX APM is now a next-generation solution for today’s complex and hybrid enterprise environments. Figure 1: Broadcom’s DX APM has evolved from Wily Technology’s invention of byte code instrumentation-based APM, which was introduced in 1998.
The Importance of Application Performance Monitoring.
In this digital era, applications are used on a daily basis to make our life easier. A lot of software applications are launched every day, continuously increasing competition in the market. There are thousands of applications available for a task. But, the success of any application highly depends on its performance. A good-performing application provides a flawless user experience to the customers.
Prometheus Metrics setup with SigNoz
An overview of key .NET 6 features
New Relic vs. Sentry vs. Scout
In the digital economy, software applications have become a primary product for a large number of companies. On top of that, customers expect a flawless user experience from the applications as it evolves. To provide such a great experience, companies need to have powerful performance monitoring across their applications. We will discuss APM tools that are popular in the market right now and compare them in different aspects. Feel free to use these links to navigate the guide.
Full-stack observability is within your grasp in the revamped Cisco Enterprise Agreement (EA)
With Cisco’s revamped Enterprise Agreement (EA) buying program, it’s easier than ever for your business to achieve full-stack observability.
A Comprehensive Guide Of Website Navigation: How You Can Improve Your Site?
Do you want to give your visitors excellent navigation so they can land on their desired page correctly? Easy navigation around a website is of the up-most importance when it comes to website performance. In this guide we will share a detailed guide for you to make organized website navigations on your site.
We've been named a Customers' Choice for the third year in a row!
The market has spoken! ManageEngine has been named a Customers’ Choice in the 2021 Gartner Peer Insights ‘Voice of Customer’: Application Performance Monitoring report for the third time in a row. It’s an honor to be trusted and loved by customers all around the globe.
Crossed 5000+ GitHub stars, metrics generation from spans - SigNal 06
Alerting has landed: Never miss another mission-critical issue again
Time is of the essence when identifying and resolving issues in your software. The longer it takes for a fix to be deployed, the greater the consequences for your customers. Visibility and speed are core to what makes Raygun powerful and is why today we're excited to continue this journey with our latest feature - Alerting.
Elevate your call center experiences with AppDynamics in Cisco Unified Contact Center Enterprise (UCCE)
Full-stack observability has entered the call center world. Raise the experience bar with AppDynamics in Cisco Unified Contact Center Enterprise (UCCE).


