PagerDuty Expands Generative AI Offerings and Enhances Analytics Capabilities PagerDuty
Operations Cloud's AI-generated runbooks accelerate automation efforts to drive cost optimization and efficiency for customers.


Operational efficiency is as critical within the IT and engineering teams as any other part of the business. Automating repetitive tasks and reducing escalations within and to these teams is of immense value. While automation saves time and boosts productivity, the complexity of developing automation can be a limiting factor and bottleneck. Generative AI is a paradigm shift here, in that it brings consumer-style simplicity to assisting in the development of enterprise-grade automation.
More and more developers are worried about the end-to-end delivery of online apps as the DevOps movement gains attention. This covers the application's launch, functionality, and upkeep. Understanding the function of the server becomes more and more important as an application's user base grows in a live setting. You must collect speed data for the computers hosting your web apps in order to assess the health of your applications.
Kubernetes orchestrates the management of containerized applications, with an emphasis on declarative configuration. A DevOps engineer creates deployment files specifying how to spin up a Kubernetes cluster, which establishes a blueprint for how containers should handle the application workloads.
Are business outcomes, with the potential to make or break an organization’s future, becoming more important than they’ve ever been before? It sure seems that way. Embarking on the journey of business growth despite a treacherous path of challenges, all departments are biting at the bit for stability, solid strategies, and a reliable plan for what’s ahead.
Command Line Interface (CLI) for VMware is not just a feature but a cornerstone for effective virtualization management. Think of it as the hidden trapdoor that takes you straight to the control room of a spaceship. It’s less fancy than the graphical user interface (GUI), but it gets you direct access to the nuts and bolts of your VMware environment.
Kubernetes offers undeniable benefits—scalability, portability, reliability—and enterprises everywhere are jumping on the bandwagon to adopt it. However, as incredible as Kubernetes is, its adopters are learning a difficult lesson: Without taking the steps to standardize Kubernetes adoption across the organization, costs and risk can skyrocket.
The U.S. Department of Defense’s Software Modernization Strategy calls for gaining a competitive advantage to achieve strategic and tactical superiority. Leveraging artificial intelligence (AI) and implementing zero trust security are critical parts of the movement to modernize the U.S. military. To this end, U.S. Deputy Secretary of Defense Kathleen H. Hicks issued a memorandum in February 2022 establishing the formation of the DoD Chief Digital and Artificial Intelligence Officer (CDAO).
We're excited to introduce a new enhancement to help teams build more reliable software: Detected Risks. Available today, Detected Risks helps you find and fix the most common causes of infrastructure outages and incidents in minutes—without running Chaos Engineering experiments or reliability tests.
Microservices architecture has become increasingly popular in modern software development due to its scalability, resilience, and flexibility. However, with the benefits of microservices come the challenges of debugging and monitoring these distributed systems. Using the Istio service mesh, OpenTelemetry distributed tracing, and Apica’s Kubernetes-native observability platform, developers can easily collect and visualize performance data in real-time to identify and fix issues quickly.
The consequences of downtime and data breaches can be devastating to organizations, leading to substantial financial losses and irreparable damage to a business’s reputation. If last week's outage by the Bank of England is anything to go by, after losing trillions of £’s per day due to downtime, resilience shouldn’t just be an afterthought for organizations.
Gartner recently published its Hype Cycle for Site Reliability Engineering, 2023, (July 2023) report. OnPage was inspired by this report to share its prediction about the future of site reliability engineering. In this blog, OnPage will review evolutionary tools that can improve site reliability engineering practices.
Discover the pivotal role of artifact management platforms in software delivery. Learn how Cloudsmith streamlines storage, boosts security, scales effortlessly, and more. Elevate your software delivery with indispensable tools and insights. The tools and strategies you employ in software delivery can make all the difference when distributing and managing software. As the intricacies of software projects amplify, the call for streamlined, secure, and adaptable solutions becomes undeniable.
After a span of 5 long years, we've bid farewell to Cycle's old portal. Our engineering team has been working tirelessly over the last 10 months to bring a fresh, new interface to the platform for our users. This new design encapsulates the wealth of insights we've gained during this period. Just last week, we took the decisive step of launching it into production, and the initial feedback has been overwhelmingly positive.
When looking at any automation task in System Center Orchestrator, it will inevitably need to connect to other enterprise management systems to automate the process. This means using an Integration Pack or writing your own piece of PowerShell script to build an integration yourself.
Reliability impacts every organization, whether you plan for it or not. Leading companies take matters into their own hands and get ahead of incidents by building reliability programs. But since many of these programs are still nascent, how do you know what good looks like? Of course, the right tools and technology that can enable your team to uncover reliability risks before they impact users play an important role. But improving reliability goes beyond technology.
When it comes to managing your database, monitoring is crucial for maintaining data integrity, optimizing performance, and ensuring efficient resource allocation. In today's fast-paced technological landscape, having real-time insights into your database's health is more important than ever. This is where Heroku Postgres and Hosted Graphite come into the picture.
Printers play a crucial role in various industries, helping businesses efficiently manage their document workflows. However, ensuring optimal printer performance and minimizing downtime can be a challenge. This is where hosted graphite comes into the picture. Hosted graphite is a powerful monitoring tool that allows businesses to graph metrics and gain valuable insights into their printer systems.
In the realm of IT infrastructure monitoring, Nagios has long been a popular choice due to its robust feature set and flexibility. However, even reliable systems can encounter issues, and one recurring problem that Nagios users might encounter is the "Return code of x is out of bounds" error. In this blog post, we'll dive into the details of this error, what causes it, and how it can impact your monitoring efforts.
We have recently added a more detailed anomaly rate chart to Netdata that breaks out the overall node anomaly rate by type, this lets you more easily see what parts of your infrastructure might be experiencing an uptick in anomalies when you see the overall node anomaly rate increase.
Containers and microservices have revolutionized the way applications are deployed on the cloud. Since its launch in 2014, Kubernetes has become a de-facto standard as a container orchestration tool. With traditional approaches of deploying applications in production, developers often release updates or new features all at once, which can lead to issues if there are bugs or other issues that weren’t caught during testing.
The colocation data center is a type of service where organizations can rent out space in a data center facility to house their IT infrastructure. These facilities provide the power, cooling, and network connectivity that companies require to operate their servers, storage devices, and applications. Colocation services allow companies to reduce costs and avoid the hassle of building and maintaining their data center facilities.
We’ve all experienced latency in some form. It’s unfortunately something we’re all too familiar with. We’ve even gone so far as to accept it as a regular albeit undesirable part of the user experience. Yet despite various steps taken over the years, it still exists and is as disruptive as ever.
The more people realize the many ways automation makes their jobs easier, the more they want to apply it – and not just in IT, but across business departments and for multiple processes. By 2025, Gartner predicts: IT individuals have been taking advantage of automation for at least 10 years, but as the stats show, organizations as a whole are gravitating toward the value automation can bring.
The Azure Files update in 2023 introduced Azure Active Directory support for REST API, enabling SMB file share access with OAuth authentication. This advancement improved the scalability of Azure Virtual Desktop by increasing the root directory handle limit from 2,000 to 10,000. Additionally, the public preview of geo-redundant storage for large file shares enhanced capacity and performance, while the Premium Tier now guarantees a 99.99% uptime SLA for all premium shares.
Levitate - Last9's managed TSDB is available on AWS Marketplace.
Monitoring and optimizing IT infrastructure, applications, and networks is crucial for businesses in today's digital landscape. It allows them to proactively identify issues, ensure optimal performance, and deliver a seamless user experience. However, traditional monitoring methods often fall short when it comes to handling the increasing complexity and scale of modern systems. That's where hosted graphite and machine learning come into play.
Imagine this: You’re a doctor. Your patient is a colossal network of computers, servers and cables, all intertwined and humming with activity. Your job? To keep an eye on this complex entity’s vital signs, ensure it runs smoothly and intervene when things start to look a little off. Welcome to the world of network monitoring and the role of network administrators.
Operating Kubernetes reliably and efficiently involves adhering to a set of best practices. These practices help ensure the stability, scalability and maintainability of your Kubernetes clusters and their applications. It's crucial for platform teams (responsible for the infrastructure) and software development teams (responsible for deploying applications) to work together in applying these practices.
AzCopy is a command-line utility designed for copying data to and from Microsoft Azure Blob and File storage. It is a very powerful tool provided by Microsoft that helps users to copy and transfer data efficiently and securely. One of the key features of AzCopy is the ability to schedule transfers. Scheduled transfers can be extremely useful in managing data and ensuring that data is moved or backed up at the most appropriate times.
Cloud deployments and containerization let you provision infrastructure as needed, meaning your applications can grow in scope and complexity. The results can be impressive, but the ability to expand quickly and easily makes it harder to keep track of your system as it develops. In this type of Kubernetes deployment, it’s essential to track your containers to understand what they’re doing.
At first glance, this may appear counterintuitive. After all, aren’t public clouds lauded for their scalability, flexibility, and cost-efficiency? However, a closer examination reveals a more nuanced reality. This article delves into the driving forces behind cloud repatriation, helping you determine whether it might be the right fit for your organization.
Navigating On-Call rotations can often feel like taming a storm of alerts and constant disruptions, leaving teams overwhelmed and stressed. Hence there is a need to streamline On-Call rotations and leverage concerned software to restore order and peace. In this guide, you'll explore practical tips, best practices, and smart strategies to transform your Incident Management process. Let's get to a more efficient On-Call experience.
As Kubernetes continues its ascent as a leading container orchestration platform, it's common for users to encounter a perplexing choice between two prominent workload controllers: StatefulSets and Deployments. Despite both controllers being instrumental in managing high-availability workloads, they diverge significantly in terms of features and use cases. Grasping these distinctions is pivotal for fine-tuning the performance and scalability of your Kubernetes infrastructure.
Welcome to the world of Kubernetes - a powerful container orchestration platform. Before we dive deep into the concepts of Kubernetes, let's grasp the concept of containers - a lightweight, and isolated units that package applications along with their dependencies, ensuring seamless deployment and portability. In this blog, you will witness Kubernetes incredible abilities. It can handle the ups and downs of your applications, ensuring they scale seamlessly, even when facing tough challenges.
Kubernetes serves as a robust tool for managing and orchestrating applications across multiple computers. These computers are referred to as 'nodes.' Picture nodes as fundamental units in the ecosystem of your applications. Every node possesses its own computing resources, encompassing memory, processing capabilities, and storage capacity. Your apps are hosted and run by nodes. They give your apps the room and resources they need to work.
Feature flags (also known as feature toggles or switches) are conditional statements in code that determine whether a feature or functionality is visible and accessible to users of an application or service. They offer programmers a powerful tool for managing feature releases. Their capabilities are indispensable in software development, where agility and continuous, automated delivery are paramount.
Every organization requires data analysis and monitoring solutions to gain insights into their data. Grafana and Kibana are two of the most popular open-source dashboards for data analysis, visualization, and alerting.
Define PromQL Macros to standardize complex PromQL queries in Levitate.
At Cribl, we take pride in doing things differently. Our Customers First mentality is at the heart of everything we do as an organization–from free education and sandboxes, community programs, and platforms, to streamlining legal reviews on contracts. We strive to solve problems from first principles – understanding root causes to build optimal experiences vs. piecemeal solutions together. We aim to be a partner—working with you to address your challenges holistically.
In the ever-evolving world of software development, incidents are bound to happen. Whether it's an unexpected server crash, a critical bug impacting user experience, or a security breach, handling incidents swiftly and effectively is crucial for maintaining a seamless user experience and preserving business reputation. That's where incident response tools come in — to help you automate, document, communicate, and mitigate.
Imagine the following situation: You are on call, and your monitoring dashboard has flickering red lights due to an increased number of 5xx HTTP responses from one or more of your Kubernetes services. Now it is time to start to troubleshoot 500 Errors. Instead of panicking, you can use this blog as a guide.
In today’s rapidly transforming digital landscape, virtualization and cloud computing have become pivotal technologies. Among the leaders in these fields, VMware and Microsoft Azure stand as two monumental names, each carving out unique niches and empowering businesses to reach new heights. The integration between VMware’s virtualization solutions and Azure’s vast cloud services is not merely a technical novelty but a strategic alignment that reshapes the way enterprises operate.
The practice of cybersecurity is undergoing radical transformation in the face of new threats introduced by new technologies. As a McKinsey & Company survey notes, “an expanding attack surface is driving innovation in cybersecurity.” Kubernetes and the cloud are infrastructure technologies with many moving parts that have introduced new attack surfaces and created a host of new security challenges.
Collaboration: the secret sauce of every software project. But let’s be honest, mastering the communication needed for seamless teamwork is like trying to herd cats wearing roller skates – sounds amusing, but feels impossible. From navigating multiple time zones and illegible pull requests to juggling so many tasks simultaneously that your brain feels like a browser with fifty tabs open – teamwork isn’t always a walk in the park.
The curtain rose and fell on another spectacular Black Hat USA, the conference set against the backdrop of fabulous Las Vegas in the Mandalay Bay Convention Center. We knew upon hitting the Strip that all the glamor and neon lights were just the preshow for the main event: innovation and the latest in cybersecurity. We couldn’t wait to show attendees and fellow vendors what we had to offer.
In my last blog post, I wrote about the explicit costs of incidents — the ones you can easily track based on dollars lost. But the cost of incidents goes beyond the time spent resolving them. While we’re spending our time managing incidents (that includes mitigating and retrospectives), we’re incurring a large opportunity cost in terms of releasing the next big thing.
User expectations — those of employees and customers alike — are turning up the heat for businesses and their IT departments. Could the demand for nonstop, fast, and basically flawless digital services be any higher?
Kubernetes has revolutionized how modern applications are deployed, managed, and scaled. As the container orchestration platform of choice, Kubernetes provides a dynamic and highly efficient environment for running containerized applications. At the heart of this ecosystem lies the intricate relationship between Kubernetes and the applications residing within its clusters. Applications within Kubernetes clusters are arranged through Pods, which are managed and scaled by various controllers.
In the ever-evolving landscape of modern software development and deployment, Kubernetes has emerged as a prominent solution to manage and orchestrate applications. This technology has redefined how applications are deployed and maintained, offering a flexible and efficient framework that abstracts the underlying infrastructure complexities. In Kubernetes, you define how network traffic should be routed to different services and pods.
Grafana is a monitoring system that helps you visualize your infrastructure and provides notifications when errors occur. It offers interesting features on some versions as it's the case on v7 and v8. We will go through some that are very interesting in particular Panel editor, Tracing UI, bar graph, and visualization. With MetricFire specializing in hosted monitoring, you can easily make a Grafana dashboard by booking a demo or signing on to the free trial immediately.
A detailed comparison of Levitate and Google Managed Prometheus - Cost, Scale and Ease of Use.
Azure Files is Microsoft’s robust file storage solution, offering the ability to access data seamlessly from various locations using standard protocols. But in the world of IT, where data is the heartbeat of operations, its safety is paramount. That’s where Azure Files Backup comes into play. In a digital era, where data loss can spell catastrophe, backing up your valuable files is more than a best practice; it’s a necessity.
Observability is being built by engineers for engineers. In reality, o11y is for all.
We knew Chaos Engineering was in high demand when we first launched the Gremlin certifications in 2021. But we had no idea our Chaos Engineering certification programs would be such a success. There’s a reason: the market is looking for professionals who know how to wield Chaos Engineering well, and Gremlin's certification has become the gold-standard to learn the principles of Chaos Engineering and demonstrate proficiency.
Choosing between a monorepo and a multi-repo architecture can significantly impact how development teams work together. In this article, we’ll delve into the advantages and disadvantages of both approaches, helping you make an informed decision to enhance collaboration within your dev teams.
In today’s data-driven world, managing information is more crucial than ever. With the constant flow of data, both individuals and organizations are increasingly concerned about privacy and security. The General Data Protection Regulation (GDPR) has emerged as a key legislative framework in the European Union to protect citizens’ personal data. But how does this relate to the tools we use to manage and transfer data, like Microsoft’s AzCopy?
Applications are the center of your organization’s business. Success (or failure) depends on how quickly you can respond to dynamic market demands driven by cultural shifts, technical innovation, and global events. This business agility is driven by fast, predictable application delivery. The past few years have seen IT leaders in the public sector and private industry alike rushing to get better and faster at delivering applications and services to their customers, employees, and constituents.
Let’s be honest. When you see an alert pop up on your phone, you aren’t thinking “according to section 12 of our most recent SRE handbook used at training 6 months ago I need to keep in mind who should be Incident Commander and who should be Ops Lead”. You’re an engineer at heart.
In today’s digital age, organizations across industries are increasingly reliant on technology for their operations, communication, and data management. While this technological advancement is no doubt beneficial, it also brings with it a heightened risk of cyber threats and attacks. From data breaches and ransomware attacks to intellectual property theft and financial fraud, the consequences of a cybersecurity breach can be devastating for any organization.
HAProxy offers a powerful logging system that allows users to capture information about HTTP transactions. As part of that, logging headers provides insight into what's happening behind the scenes, such as when a web application firewall (WAF) blocks a request because of a problematic header. It can also be helpful when an application has trouble parsing a header, allowing you to review the logged headers to ensure that they conform to a specific format.
Organizations lean on IT as the foundational force for helping the business succeed, even more so when stakes are high, and the future is unpredictable. Considering the countless tasks and processes carried out in IT, automation is no longer a nice to have. It’s a requirement for starting, and maintaining, a system of consistency that supports the business through instability and uncertainty.
In today's world of container-based applications, the role of storage has become more critical than ever. One of the most significant challenges of containerization is the management of stateful applications. Kubernetes, one of the popular container orchestration platforms, provides a solution to this problem - Persistent Volumes (PVs). PVs allow the storage provision to be decoupled from the lifecycle of the Pod, making it easier to manage stateful applications.
Microservices architecture is a software development approach where an application is built as a collection of small, loosely coupled, independently deployable services. Each service focuses on a specific business capability and operates as an autonomous unit, communicating with other services through well-defined APIs. This architectural style is often used in the context of DevOps to create more efficient, scalable, and manageable systems.
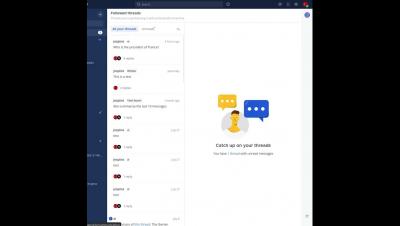
As we enter the new era of 4.0, we are thrilled to introduce a range of fresh and user-friendly features. Take a peek into your brand new User Inbox, a centralized hub for all your notifications. Explore the enhanced Connectivity add-on with Circuit Management, allowing you to conveniently bundle your connections. And for those managing multiple outlets, get ready to experience the upgraded Outlet Control functionality that will surely delight you.
In today’s digital world, where data is considered the new oil, organizations are consistently looking for efficient ways to store and manage their invaluable information assets. Microsoft’s Azure Files and Windows Server are two technologies at the forefront of this technological evolution.
Explore Cloudsmith’s powerful OKTA integration for user and user group management. Dive into the benefits, security considerations, and best practices to optimize user access, streamline workflows, and bolster security in your software operations. User management is the backbone of secure and efficient software operations. As businesses grow and evolve, the tools they use must keep pace. Enter OKTA and Cloudsmith.
The Accelerate State of Devops Report highlights four key metrics (known as the DORA metrics, for DevOps Research & Assessment) that distinguish high-performing software organizations: deployment frequency, lead time for changes, time-to-restore, and change fail rate. Observability can kickstart a virtuous cycle that improves all the DORA metrics.
SolarWinds is a trusted name in the world of IT management. This comprehensive suite of tools is designed to help organizations manage, monitor and troubleshoot their IT infrastructure. Solarwinds encompasses several capabilities, including network performance monitoring, systems management, IT security, database management, and IT helpdesk. Still, many SolarWinds replacements exist for IT teams looking for an alternative.
Scaling the deployment, in order to meet demand or extend capabilities, is a known challenge in many fields, but it’s particularly pertinent when scaling microservices. This article looks at the challenges of scaling microservices and examines best practices to overcome them while maintaining app quality, dev efficiency, and a good developer experience.
With Platform.sh, every Git branch maps to a preview environment which is an exact and isolated copy of your live application—including all data, services, and files. They are usually created to build new features, apply security patches, or upgrade dependencies in full isolation and before deploying to production. Although there is a catch—preview environments are often left idle waiting for someone to review and approve any changes made.
Google Identity-Aware Proxy (IAP) is a Google Cloud service that provides authentication for web applications. This service simplifies the process of building web applications authenticated with Google, eliminating the need to handle user-related concerns within your application code. This is especially valuable for internal applications within organizations that already utilize GSuite. It is straightforward to use, particularly when operating on Google Cloud.
What does the Rasmussen model teach us about Site Reliability Engineering?
Dashboards are great ways to visualize different KPIs in a single place. Metrics from all over your system can be framed together and viewed on a single screen, helping to correlate them and reducing the overall effort of analysis. But when it comes to Grafana vs. SolarWinds, which one is better? It is often difficult to choose between their dashboarding capabilities. Both tools provide their own visualizations and help bring out interactive dashboards for users to use.
Understanding what's happening within your systems is a necessity. Have you ever wondered how experts keep an eye on systems to make sure everything's running smoothly? That's where observability tools come in! Observability tools are like helpers that give you a peek inside your tech. In this blog, we will talk about observability tools and how they can be used in different situations so it's easier for you to choose the right one for your organization.
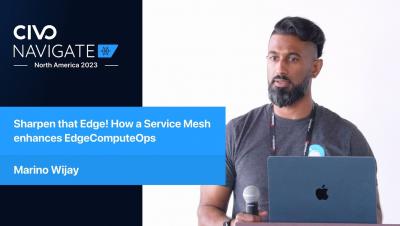
#kubernetes #eks #chaosengineering
In this video, we will be exploring an interesting scenario that might happen in real life. Let's imagine we have an application running in a Kubernetes cluster inside EKS. If for any reason, two of our three nodes are cordoned and can't be scheduled anymore, what would happen to our users should the last node be cordoned as well? And what if we need to reschedule something?
#reliably #chaosengineering #honeycomb #slack #resilience
In this video, we will use a chaos engineering experiment, that we expect to fail, to verify our open tracing and communication platforms are correctly set up. Using the Honeycomb and Slack integrations provided by Reliably, we will send traces and messages and observe if they are triggered as expected.
A leading mobile communications company, based in South Africa, had big plans for its growth in the upcoming months. To ensure customer loyalty as they continued to grow their subscribers, they had to make sure their networks evolved while maintaining performance. That meant the organization’s IT and network teams needed a way to support business goals for growth with their existing capacity.
In the dynamic landscape of IT operations, incidents are bound to occur. Incident management is a structured and proactive approach to address and resolve these unexpected events promptly and effectively. It forms a crucial component of IT service management (ITSM), ensuring smooth operations and minimizing the impact of incidents on an organization’s productivity and customer experience.
One of the first considerations for FinOps teams trying to lower their public cloud spend is investing in long-term savings vehicles available from their Cloud Service Provider. These programs can provide customers with upwards of 72% savings off on-demand prices, in return for a 1-to-3-year usage commitment, so it’s pretty common that we see them in use by our customers.
In part I of this blog series, we understood that monitoring a Kubernetes cluster is a challenge that we can overcome if we use the right tools. We also understood that the default Kubernetes dashboard allows us to monitor the different resources running inside our cluster, but it is very basic. We suggested some tools and platforms like cAdvisor, Kube-state-metrics, Prometheus, Grafana, Kubewatch, Jaeger, and MetricFire.
As organizations continue to embrace CI/CD and DevOps in their quest for shorter, more reliable delivery cycles, the choice of programming languages becomes even more critical. The language used to build your applications can affect everything from developer happiness and productivity to your organization’s performance on the four key software delivery metrics.
One of the hardest challenges in computer science is deciding what to name things. Adoption of consistent nomenclature is difficult because there is no one right answer. In fact, it’s not uncommon for different teams within organizations to choose different names for the same technologies. In the world of monitoring and observability, this can create quite a lot of confusion – not to mention wasted resources.
In this post, we'll dive into what CrashLoopBackOff actually is and explore the quickest way to fix it. Fasten your seat belts and get ready to ride. Everyone working with Kubernetes will sooner or later see the infamous CrashLoopBackOff in their clusters. No matter how basic or advanced your deployments are and whether you have a tiny dev cluster or an enterprise multi-cloud cluster, it will happen anyway. So, let’s dive into what CrashLoopBackOff actually is and the quickest way to fix it.
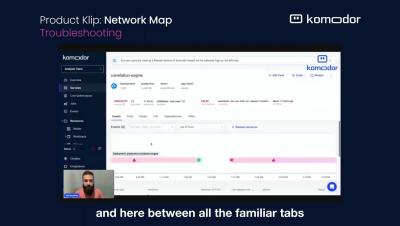
I am happy to share that thanks to the power of the open-source community, and our friends over at Otterize, we have now enhanced our Kubernetes offering for developers with another visual aid to streamline operations and troubleshooting – Dependencies Map. The Otterize network mapper is a zero-config tool that aims to be lightweight and doesn’t require you to adapt anything in your cluster.
In the fast-evolving landscape of technology and software applications, ensuring optimal performance and reliability has become paramount. This article delves into two powerful tools that facilitate effective monitoring and management of digital systems: Prometheus and AppDynamics. With a focus on different aspects of application performance, these tools offer distinct advantages to businesses aiming to elevate their user experiences and operational efficiency.
A cold fact of SaaS Life™ is that you can’t make money when your product or website doesn’t work — and those lost dollars add up fast. Downtime, SLA breach paybacks, compliance fines, and other explicit costs are the easiest to quantify and they’re what most people think of when they think about incidents.
Dive into the world of universal artifact management with our comprehensive guide. Discover the role of Cloudsmith in streamlining software artifact management, the advantages of a cloud-native approach, and the tangible benefits of a dedicated platform for software distribution. Navigating the software development world can sometimes feel like deciphering a new language.
In our extensive guide of best ci/cd practices we included a dedicated section for database migrations and why they should be completely automated and given the same attention as application deployments. We explained the theory behind automatic database migrations, but never had the opportunity to talk about the actual tools and give some examples on how database migrations should be handled by a well disciplined software team.
AzCopy, a command-line utility designed by Microsoft, is the bridge that links data transfer and data management within Azure. Targeting seasoned professionals, it offers a granular level of control, especially when it comes to permissions. Managing permissions is not just about controlling access; it’s about maintaining the integrity of data, ensuring compliance, and optimizing operational efficiency.
#reliably #chaosengineering #resilience
In this video, we'll show how you can use starters and the Reliably cloud to get started very quickly.
#reliably #chaosengineering #github #githubactions #resilience
Reliably lets you run experiments not only from the Reliably cloud but from your own environment. This video will focus on running a chaos engineering experiment in GitHub.
#reliably #chaosengineering #resilience #kubernetes #k8s
Reliably lets you run experiments not only from the Reliably cloud but from your own environment. This video will focus on running a chaos engineering experiment in a Kubernetes cluster.
eBPF, or Extended Berkeley Packet Filter, is a kernel technology available since Linux 4.4. It lets developers run programs without adding additional modules or modifying the kernel source code. Think of it as a lightweight, sandboxed virtual machine (VM) within the Linux kernel that lets you run Berkeley Packet Filter (BPF) bytecode that uses certain kernel resources. Utilizing eBPF removes the need to modify the kernel source code and improves the software’s capacity to use existing layers.
The dev world was on fire this weekend, as news of yet another major open-source project was revealed to be in the midst of an identity crisis. The unsettling trend is clear: hit a certain adoption threshold, and then swap the licensing in an attempt to turn dedicated fans into revenue streams. With more companies searching for a sustainable business model and attempting to appease shareholders, the only certainty we have is, what was free yesterday, might be paid tomorrow.
In the multifaceted world of cloud computing, managing and safeguarding data becomes paramount. Azure Blob Storage Versioning serves as a pivotal feature within the Microsoft Azure platform, providing the essential capacity to control and maintain various versions of data. Whether you’re a small business owner worried about accidental deletions or a large corporation dealing with regulatory compliance, understanding Azure Blob Storage Versioning is crucial.
Today the Internet IS the new enterprise network your organization relies upon. However, most of your key applications and systems are outsourced to the cloud. In fact, huge parts of your Internet Stack are either outsourced to the cloud or to 3rd-parties who themselves rely upon the cloud. And that's an issue because if any of those cloud-based services go down, your network is going to be impacted.
In today’s rapidly evolving business landscape, where IT infrastructure and cloud costs play a pivotal role, organizations demand advanced solutions that streamline operations, optimize performance, and drive cost efficiency. Virtana, a trailblazer in infrastructure monitoring and observability and true multicloud cost management, has taken another leap forward by introducing a host of groundbreaking features to our flagship products.
CloudOps, or Cloud Operations, is quickly becoming the standard for managing IT operations in the cloud computing ecosystem. By transforming traditional IT operations to harness the full potential of the cloud, businesses are experiencing greater automation, collaboration, agility, and resilience. This article is a deep dive into the concept of CloudOps, its core components, the advantages it offers, and the steps necessary to implement it effectively within an organization.
When you think of air-gapped security, you imagine a protective distancing that separates your sensitive data from those who would steal it. In practice, the separation is a disconnection from the Internet. If no one can get to your data, no one can steal it. However, air-gapped deployments that are completely disconnected from the Internet are not the case in all instances. It’s true that many clusters are fully air-gapped, particularly in classified government installations.
If you wanted to switch from one project management tool to another, what would happen to your data? As more and more business operations undergo digital transformations and move online, organizations have become more reliant than ever on their digital data. Many take for granted that their data is their own and that they can take it with them if they change tools. But for those who rely on third-party tools, control of data may not be so simple.
It’s one of the main use cases fit for network automation: the load balancer sanity reboot. Not to be left to manual executions, this long, tiresome task creates too much possibility for errors. Negative effects like unnecessary time and money spent are detriments that organizations can avoid, simply by automating the types of tasks—like load balancer sanity reboots—that include loads of repetitive steps.
Using real-time asset tracking, data centers can identify the exact location of any given asset at any given time. This can be extremely useful in ensuring that available resources are optimally utilized. For instance, understanding the current status and location of servers, racks, and other hardware can streamline maintenance operations and reduce downtime.
Configurations are regarded as the core of networks due to their importance. With businesses continually advancing and relying on networks for storing, processing, and transmitting critical data, the complexity of network management has increased, leading to difficulties and human errors that can cause significant network downtime.
henToo many alerts are frustrating and have an even worse trickle down effect on IT teams. When alert deluge turns to alert fatigue, critical issues may be ignored. But seasoned IT pros will tell you that receiving no alerts causes even greater distress. When monitoring tools go silent, user complaints are sure to follow. Even with Netreo’s high-value, intelligent alert management capabilities, issues can go undetected from time to time.
As technology professionals, we must consider the evolution of security and its connection to literature, such as George Orwell’s “1984” and Aldous Huxley’s “Brave New World.” The digital threats we face are often unseen, lying dormant until they can be weaponized for both good and evil purposes. Advancements in machine learning and algorithms have revolutionized data analysis, allowing us to observe and analyze behavioral patterns both online and offline.
Very few SaaS products exist completely independently. Between cloud service providers, payment processors, content delivery networks, and more, chances are you rely on external systems to keep your product working. When these systems fail, it can leave you feeling pretty helpless. In some cases you might have fallback options, but oftentimes all you can do is wait for recovery and clean up the fallout.
In a world where companies pivot for breakfast, lunch and dinner – it’s rare to see a tech house commit to a large, time intensive project. Big projects take a long time to implement. Sometimes too long. But we asked ourselves, “Can we give users an early look at some of the stuff we’re working on?” We wanted something that was in-between a public beta and our own GitKraken preview states.
With the widespread adoption of Kubernetes, the Cloud Native Computing Foundation (CNCF) ecosystem has evolved to include projects that address the challenges of using a container orchestrator system. One such challenge is managing and deploying clusters, which can become complex as organizations scale their Kubernetes requirements. Fortunately, Cluster API (CAPI) provides a solution.
API Gateways are vital components in today's digital landscape, facilitating seamless communication between systems and applications. To ensure optimal performance, monitoring API Gateways is crucial. MetricFire offers a comprehensive monitoring platform that tracks and analyzes key metrics, providing real-time insights into performance indicators such as latency, error rates, and throughput.
Using 'Sharding' to tame High Cardinality data for Levitate - Our Time Series Data Warehouse.
Are you curious about DevOps and how it’s transforming the world of technology? Look no further! In this blog, we will dive into the fascinating world of DevOps and explore its significance and need in today’s fast-paced digital landscape. From its definition and importance to real-world examples of epic fails and their solutions, we’ll cover it all. So, grab a cup of coffee, sit back, and let’s embark on this DevOps journey together!
New trends emerge in network management every year, and 2023 is no exception. This year the industry is set to witness a plethora of advancements and breakthroughs that will revolutionize network administration. From the adoption of sophisticated analytics and machine learning to the proliferation of cloud-based solutions and the surging significance of cybersecurity, here are the top network management trends to watch out for in 2023.
From communication and collaboration to data storage and sharing, networks are critical to almost every business operation today. Thus, monitoring the reliability and security of your network infrastructure is more critical than ever. Network monitoring entails observing and analyzing network traffic to identify issues, optimize performance, and ensure security.
AzCopy is a command-line utility designed for copying data to and from Microsoft Azure Blob and File storage. It allows for efficient data transfer, ensuring the integrity of the files and offering a seamless process. In a world where data is considered a valuable asset, AzCopy stands out as a vital tool for data administrators, developers, and Azure users.
VMware SQL with MySQL for Tanzu Application Service is a top choice for customers seeking a multi-cloud, easy-to-use, on demand MySQL service for enterprise applications. Customers who have adopted our solution affectionately refer to it as MySQL tile. Our solution provides tangible benefits over open source and third-party offerings for the VMware Tanzu Application Service platform. To call out a few.
Writing a public postmortem regarding an outage is essential to maintaining transparency and accountability when things go wrong in a service or system. The purpose of writing a postmortem is to analyze and document an incident or event that has occurred, usually with a focus on identifying its root causes, understanding what went wrong, and outlining steps to prevent similar issues from happening in the future.
Longhorn version 1.5 has been released, along with the latest patch. This release includes a number of new features and improvements that can benefit users. Here are some of the highlights.
We’re excited to announce that we just released the next-generation of our observability platform – the Circonus Telemetry Cloud™. Here’s a closer look at what it is and why we think it’s a standout in the monitoring and observability space.
Artificial intelligence (AI) isn’t the only thing at the heart of what organizations are doing to keep with digital transformation and drive business growth. People are, too. Development of AI actually began about 40 years ago, but for generative AI (genAI), that time is much less. The explosion of genAI has brought about an everlasting, first-of-its-kind innovation that’s accessible to just about everyone.
Many organizations rely on service level objectives (SLOs) to help them gauge the reliability of their products. By setting SLOs that define clear and measurable reliability targets, businesses can ensure they are delivering positive end-user experiences to their customers. Clearly defined SLOs also make it much easier for businesses to understand what tradeoffs they may have to make in order to deliver those specific experiences.
This blog will help you learn all about restarting Kubernetes pods and give you some tips on troubleshooting issues you may encounter. Kubernetes pods are one of the most commonly used Kubernetes resources. Since all of your applications running on your cluster live in a pod, the sooner you learn all about pods, the better.
We are excited to announce that we have raised a $12M round of financing led by Renegade Partners with participation from Google Gradient Ventures (Google’s AI-focused venture fund) and XYZ Ventures. This brings our total funding to date to $15.2M ($20M CAD) alongside our other existing investors Y Combinator and 8VC.
🎵 Gotta give the people, give the people what they want! 🎵 You've been asking. And we've been listening. Over the past few weeks, we've been shipping frequently requested features to help you bring your incident management to the next level. It may be the dog days of summer, but let's ignore that, yeah? Just take a look at this recent changelog. Note that this is the biggest one we've ever published.
In the ever-expanding landscape of Azure data management, two powerful tools emerge as essential assets for tech professionals: AzCopy and Azure File Sync. While each has its unique capabilities, together they create an intricate symphony that enhances data transfer and synchronization within Azure. In this comprehensive guide, we’ll unravel the functionalities of both, explore their common use cases, delve into their integration processes, and weigh their benefits and drawbacks.
Explore the intricacies of scaling software delivery, from the nuances of continuous delivery to overcoming common challenges. Dive deep into how Cloudsmith can be the game-changer in your DevOps journey, ensuring agility, security, and efficiency in every release. Every business, from startups to established enterprises, feels the urgency to scale their software delivery. Why?
D2iQ is excited to be participating in the Department of the Air Force Information Technology and Cyberpower (DAFITC) 2023, in Montgomery, Alabama, from August 28-30. The theme of this year’s DAFITC conference is “Digitally Transforming the Air & Space Force: Investing for Tomorrow’s Fight.” Digital transformation of the Air Force and Space Force is part of a wider modernization effort that is accelerating across all U.S.
In case you missed it, HAProxy Technologies recently put out a press release about our stunning leadership position in G2’s Summer 2023 Grid® Reports for load balancing. We’re incredibly proud of these results, which are a direct result of the hard work and dedication of HAProxy’s community developers and our enterprise product and support teams. Looking at the Momentum Grid® Report for Load Balancing, the gap between HAProxy and the rest is impossible to ignore.
When we launched the Checkly CLI and Test Sessions last May, I wrote about the three pillars of monitoring as code. Code — write your monitoring checks as code and store them in version control. Test — test your checks against our global infrastructure and record test sessions. Deploy — deploy your checks from your local machine or CI to run them as monitors.
In Part 1 of this series, we introduced you to the key metrics you should be monitoring to ensure that you get optimal performance from CoreDNS running in your Kubernetes clusters. In Part 2, we showed you some tools you can use to monitor CoreDNS. In this post, we’ll show you how you can use Datadog to monitor metrics, logs, and traces from CoreDNS alongside telemetry from the rest of your cluster, including the infrastructure it runs on.
In Part 1 of this series, we looked at key metrics you should monitor to understand the performance of your CoreDNS servers. In this post, we’ll show you how to collect and visualize these metrics. We’ll also explore how CoreDNS logging works and show you how to collect CoreDNS logs to get even deeper visibility into your Deployment.
CoreDNS is an open source DNS server that can resolve requests for internet domain names and provide service discovery within a Kubernetes cluster. CoreDNS is the default DNS provider in Kubernetes as of v1.13. Though it can be used independently of Kubernetes, this series will focus on its role in providing Kubernetes service discovery, which simplifies cluster networking by enabling clients to access services using DNS names rather than IP addresses.
Kubernetes liveness probes are a critical component for monitoring the health and availability of application containers running within a Kubernetes cluster. They allow Kubernetes to determine whether a container is running as expected and take appropriate actions if it is found to be unresponsive or in an unhealthy state. Liveness probes periodically check the health of containers by sending requests to a specified endpoint or executing a command within the container.
Kubernetes has become the go-to platform for container orchestration, allowing teams to more efficiently manage their containerized applications. Vanilla Kubernetes, as well as managed Kubernetes, are the two options available when building up a Kubernetes system. A group of programmers using vanilla Kubernetes must download the source code files, follow the code route, and set up the machine's environment.
Since 2018, our annual State of Kubernetes survey has consistently found that organizations achieve significant operational benefits from using Kubernetes, especially “improved resource utilization.” This year, we wanted to understand how Kubernetes impacts the business as a whole. The results are unequivocal.
This section outlines how to install and set up Hosted Graphite independently. MetricFire's product, Hosted Graphite, runs Graphite for you so you can have the reliability and ease-of-use that is hard to get while doing it in-house.
Corey Dinkens and Carol Pereira contributed to this blog post. As enterprises deploy modern containerized applications to their Kubernetes clusters, managing data protection centrally is necessary to run critical business applications, especially in multi-cloud distributed environments.
A deep dive comparison between Thanos and VictoriaMetrics: Performance and Differences.
Observability vs Telemetry vs Monitoring - What they are, differences and what lies in future.
Docker: it’s one of those technologies that seems to be everywhere. Whether you’re a junior developer just starting out or a seasoned.NET developer, at some point in your career, you’ll most likely come across Docker for.NET. So, what is Docker?
If you’re a software developer in the public sector, you’re familiar with the unique challenges public sector professionals face. From grappling with tight deadlines and limited resources to working with complex legacy systems, the journey of a public sector software dev seems to be filled with obstacles at nearly every turn.
AzCopy is a command-line tool provided by Microsoft to transfer data to and from Azure Storage services like Blob, File, and Table storage. It’s a vital tool for IT professionals who handle large-scale data operations, offering an efficient way to move data where it’s needed. However, as with any robust tool, users might encounter errors or issues while working with AzCopy. In this article, we’ll explore some common AzCopy errors and provide solutions on how to fix them.
In our previous blog, we shared our firsthand experience of implementing a tracing collector API using serverless components. Drawing parallels with Amazon Prime Video’s architectural redesign, we discussed the challenges we encountered, such as cold-start delays and increased costs, which prompted us to transition to a non-serverless architecture for more efficient solutions.
Recently in our Better Incidents Slack channel, there’s been some chatter around how people structure dedicated incident commanders at their company: distributed or centralized. The way I see it, there are two types of commanders: the temporary, distributed role — a hat that an on-call engineer or an engineering manager puts on during an incident. Then there’s the centralized, full-time role, where someone is the designated incident commander (or one of a few) for all incidents.
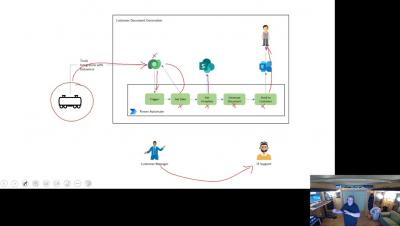
Have you ever needed to provide proof that a critical business process actually took place? It’s a painful process involving all kinds of paperwork, but it’s the reality for many organizations working in highly regulated industries. For these companies, records need to be kept for actions like the provisioning of user accounts and access to sensitive records. It’s necessary, but it’s manual and time-consuming work.
In this short blog, you will learn how to set up Kosli Notifications so your whole team can stay on top of environment changes and compliance events in real time. 🚀 In fast-paced technology landscapes, understanding how systems are changing is crucial. Developers, DevOps/Platform/SRE teams, security personnel, and management all need this information to manage operational risk, resolve incidents, and just for basic communication with each other.
Network topology mapping is the process of mapping topological relationships between network components and establishing those relationships in the form of network diagrams. Network mapping helps visualize physical and logical connections between all elements and nodes, thus simplifying network management. A network topology mapper is a tool that helps perform network mapping effectively.
Managing containerized applications efficiently in the dynamic realm of Kubernetes is essential for smooth deployments and optimal performance. Kubernetes empowers us with powerful orchestration capabilities, enabling seamless scaling and deployment of applications. However, in real-world scenarios, there are situations that necessitate the restarting of Pods, whether to apply configuration changes, recover from failures, or address misbehaving applications.
This article will outline what Redis database monitoring is and how to set up a Redis database monitoring system with MetricFire. Then we’ll show what the final graphs and dashboards look like when displayed on Grafana. We will be using Prometheus and Grafana to power the monitoring, and we'll use a simulated Redis DB to generate the data for the Grafana dashboards.
DZone has released the results of its latest annual container management survey, entitled “Containers: Modernization and Advancements in Cloud-Native Development.” The survey findings reflect the experiences of developers and engineers in their deployment of containerized applications.
Building, testing and deploying software is a time-consuming process that many organizations aim to minimize by automating repeatable work wherever possible. To do so, many organizations are utilizing a continuous integration, continuous delivery (CI/CD) philosophy in combination with cloud native tools like Kubernetes to develop and deploy software at scale.
Any organization that’s keeping up with today’s sharp rise in business demands (or better yet, getting ahead of the game) is doing so by getting innovative and jumping at the chance to do things differently. They’re not relying on the old ways or trying to use their existing toolbox. Instead, organizations are looking to the newest technologies and means of adding efficiency to as many day-to-day functions as possible.
Ensuring software availability is essential for any SaaS company—including Gremlin. To do that, our teams need to identify the reliability risks hiding in our systems. That’s why our development, platform, and SRE teams use Gremlin regularly to perform Chaos Engineering experiments, run reliability tests, and track the reliability of our systems against our standards. Along the way they’ve picked up a thing or two about how to find and fix reliability risks with Gremlin.
As data centers become increasingly decentralized, managing them remotely is now a must-have skill. Data center professionals need to maintain uptime, increase efficiency, and boost productivity across all their global sites without leaving their desk. While this might have once seemed near-impossible, with the right tools and processes, remotely managing your data center can be even better than physically being there.
Data has become a critical asset in today’s digital era, making its storage, management, and accessibility crucial to many organizations’ operations. Microsoft’s Azure provides a suite of cloud storage solutions designed to address these needs. Among the tools provided by Azure is AzCopy, a command-line utility designed to simplify data transfer to and from Azure Blob, File, and Table storage.
Cloud monitoring is like a health check-up for our online spaces. It tells us what's going well and what we need to improve. It is critical because it lets us fix problems before they get too big and helps our online services work at their best. This article talks about how we can use MetricFire to monitor DigitalOcean environments.
Mastering Git can sometimes feel like trying to untangle a bunch of super tangled – and wired (old school, I know) – headphones, not sure exactly where to pull or loop or flip next. Here are 10 Git tutorial videos that’ll help you level up your Git game. These videos are the perfect combination of fast and helpful.
Microsoft’s Azure Data Lake Storage (ADLS) has been a vital component for organizations aiming to build scalable and secure data lakes. As technology evolves, transitioning from Azure Data Lake Storage Gen1 to Gen2 has become increasingly important. This article aims to guide readers through the essential considerations, detailed processes, and best practices involved in making this shift.
The Internet of Things (IoT) - is a number of physical devices connected to one network that enables the system to interact with the external world. A great deal of the work surrounding IoT is monitoring, as it’s impossible to react without knowing the situation. For example, we might build a greenhouse system for agriculture that can maintain optimal conditions for growing crops. For this purpose, we need to have sensors picking up information about the temperature and humidity.
For enterprise businesses, a lot is riding on the efficiency of their incident response. These organizations have large customer bases, complex products, and many incidents. They also have loads of incident responders across various roles, making it difficult to coordinate internally.
Out of more than 100 services that Amazon Web Services (AWS) provides, Amazon CloudWatch was one of the earliest services provided by AWS. CloudWatch was announced on May 17th, 2009, and it was the 7th service released after S3, SQS, SimpleDB, EBS, EC2, and EMR. AWS CloudWatch is a suite of tools that encompasses a wide range of cloud resources, including collecting logs and metrics; monitoring; visualization and alerting; and automated action in response to operational health changes.
One month after the MOVEit vulnerability was first reported, it continues to wreak havoc on U.S. agencies and commercial enterprises. Unfortunately, the victim list keeps growing and includes organizations such as the U.S. Department of Health and Human Services, the U.S. Department of Energy, Merchant Bank, Shell, and others.
Business-critical infrastructure and services generate massive volumes of observability data from many disparate sources. It can be challenging to synthesize all this data to gain actionable insights for detecting and remediating issues—particularly in the heat of incident response.
Site Reliability Engineering (SRE) is a term that’s getting attention and gaining momentum – and for a good reason. SRE takes features of software engineering and applies them to various problems in infrastructures and operations. Organizations look to build SRE teams with a couple goals in mind, including to create and increase scalability and develop solid software systems.
A couple of weeks ago I had the absolute joy of attending KCD Munich for the first time, with my friend and colleague Guy Menahem (whom some of you know simply as The Good Guy on Twitter and YouTube). Besides rooting for Guy and his co-speaker, Arsh Sharma of Okteto, during their session on Backstage.io and IDPs, I enjoyed being untethered from ‘booth duty’ and free to engage with all the beautiful human beings that gathered together for this Kubetastic event!
For developers working in the public sector, leveraging secure version control systems like Git is essential to manage code and web content efficiently and safely. Git simplifies collaborative projects between developers working in fields like government, healthcare, banking, and education, but hey, let’s face it – mastering Git via the command line can be like solving a Rubik’s Cube blindfolded. That’s where a Git GUI comes in handy.
Tech debt is usually one of the most fraught topics on engineering teams. Engineers often feel they aren’t allowed enough time to address tech debt. Product partners wonder why engineers spend so much time working on it—or at least talking about it. “The business” always seems to insinuate that engineers should do less of it, instead focusing on shipping value to customers.
Creating just any infrastructure on Kubernetes is not enough. There are so many basic configurations you could apply and create the infrastructure for your application for the time being and it might work just fine. The incident responses won’t always remain 100% reliable. You will run into newer potholes, and that’s okay.
The post-pandemic world has transformed our work habits and the landscape of conducting business. Organizations now take the hybrid approach to work, wherein employees may work from an office, while travelling, or from a remote location. This fundamental shift has accelerated the pace of cloud adoption, as the cloud makes data access possible from anyplace, anytime. But the cloud brings with it a set of complexities that must be managed.
Since server outages can lead to a loss of customers, reputation, and other troubles and it is important to get information on the status of the server on time. MetricFire's Hosted Grafana and Graphite will help you monitor server load in a timely and efficient manner. Servers generate a large number of metrics and it is essential to not only track their values but also to observe their changes over time. There is also a possibility to correlate app statistics with server load metrics.
On-call shifts are part of every developer’s job – we’ve all been there. It’s 3am, suddenly you get an alert for an issue occurring in production. The microservices landscape is complicated and finding the root cause of an issue is like looking for a needle in a haystack. How can you get to the root of what’s happening in the system so you can analyze and resolve the issue quickly and effectively?
Progress often accompanies unforeseen challenges and mishaps in organizations. Traditionally, these setbacks resulted in pointing fingers, hindering progress, and creating a negative work atmosphere. However, a "Blameless Postmortems" approach transforms how organizations respond to failure. In this blog, we will delve into the importance of cultivating a blameless postrmortem culture when faced with setbacks.
Helm Dashboard is an open-source project which graphically shows installed Helm charts, revisions, and changes to their Kubernetes resources. The intents operator is an open-source Kubernetes operator which makes it possible to roll out network policies in a Kubernetes cluster, chart by chart, and gradually achieve zero trust or network segmentation.
Data management and transfer are essential components of the digital era. Whether you are an IT professional, a developer, or simply someone looking to move large amounts of data to the cloud, the efficiency and reliability of the process are paramount. That’s where AzCopy comes into the picture.
While there are an increasing number of off-the-shelf machine learning (ML) solutions that promise to adapt to your specific requirements, organizations that are serious about investing in ML for the long term are building their own workflows tailored exactly to their data and the outcomes they expect. To make full use of this investment, ML models must be kept up to date and working from the freshest available data.
Discover the importance of package management in software development and how Cloudsmith, a cloud-native artifact management platform, can streamline your DevOps processes. Learn about the key benefits of using Cloudsmith for package management, from control and visibility to security and speed.
Blockchain-generated smart contracts are transforming the way the world creates and settles agreements. Jonathan Huxtable and the team at LinkPool are using platformEDGE™ to connect these contracts with real-world data sources. In 2017, Google searches for the term Bitcoin peaked. It seemed like everyone was talking about cryptocurrencies. For Jonathan Huxtable, this surge in interest didn’t come as a surprise. In fact, he’d predicted it.
In an age where data is the new gold, safeguarding personal information has become more vital than ever before. The General Data Protection Regulation, or GDPR, is no longer a buzzword in the corporate corridors of Europe; it’s a binding legislation that has set the global standard for privacy and security. Enter the world of Microsoft Azure, one of the leading cloud computing platforms that’s shaping the way businesses store, manage, and analyze data.
When we launched incident.io Status Pages a few months ago, we stressed the importance of communicating clearly with your customers about ongoing issues. To help with this, we spent a lot of time carefully designing a status page that’s easy to understand for everyone - whether they come from a technical background, work in a different area, or just want to get on with their day.
Today, there is an explosion of data in IT. This data explosion of critical infrastructure living in the cloud, on premises in the data center, or even orchestrated in containers can be subjected to low disk space issues. How do you respond to the challenging inconvenience of low disk space?
Not to be confused with the popular children’s TV character, DORA is a new EU regulation for the financial sector, which stands for the Digital Operational Resilience Act. DORA became law on 16 January 2023 and will start to apply from 17 January 2025, so it’s crucial that senior executives in the financial sector, such as Chief Risk Officers and Chief Information Security Officers, understand its implications and prepare for compliance from day one.
Prometheus is an increasingly popular tool in the world of SREs and operational monitoring. Based on ideas from Google’s internal monitoring service (Borgmon), and with native support from services like Docker and Kubernetes, Prometheus is designed for a cloud-based, containerized world. As a result, it’s quite different from existing services like Graphite. Starting out, it can be tricky to know where to begin with the official Prometheus docs and the wave of recent Prom content.
Using Prometheus and Grafana together is a great combination of tools for monitoring an infrastructure. In this article, we will discuss how Prometheus can be connected with Grafana and what makes Prometheus different from the rest of the tools in the market. MetricFire's product, Hosted Graphite, runs Graphite (a Prometheus alternative) with Grafana dashboards for you so you can have the reliability and ease of use that is hard to get while doing it in-house.
Understanding the state of your systems and their underlying infrastructure at all times is paramount for ensuring the stability and reliability of your services. Up-to-date information about the performance and health of your deployments not only helps your team react to issues in real time, but it also gives them the security to make changes with confidence and to safely forecast system failures or performance hiccups even before they occur.
In today's digital landscape, optimal web application performance is crucial for business success. Slow loading times, unresponsive pages, and inefficient code can drive away users and harm your reputation. This makes monitoring web app performance extremely important to prevent them and to provide a smooth user experience. Sitespeed, a powerful web performance monitoring framework, analyzes metrics like page load time, resource usage, and user interactions to identify performance bottlenecks.
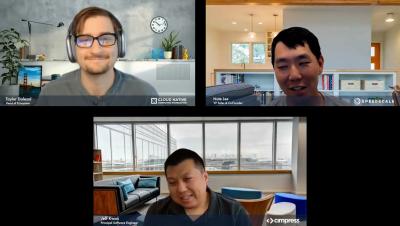
As cyber attacks have become ever more sophisticated, the means of protecting against cyber attacks have had to become more stringent. With zero trust security, the model has changed from “trust but verify” to “never trust, always verify.” Joining D2iQ VP of Product Dan Ciruli for an in-depth discussion of zero trust security was Dr. John Sahlin, VP of Cybersolutions at General Dynamics Information Technology (GDIT), and David Sperbeck, DevSecOps Capability Lead at GDIT.
In today’s digital landscape, organizations need the right cybersecurity applications to address evolving cyber threats effectively. To keep security teams aligned and streamline mission-critical workflows, one of the most important cybersecurity applications organizations need is a secure and efficient cybersecurity collaboration platform that enables seamless communication, information sharing, and coordinated incident response.
When I first met Uria Franko, the CTO of Novacy, I immediately knew we’d hit it off. He was looking for an observability solution for his team with a specific need around Celery, after they had been using logs but found they lacked the depth and granularity they needed. Luckily, our mission at Helios is to help organizations gain visibility and drill down into services through traces. So this was a perfect match.