Operations | Monitoring | ITSM | DevOps | Cloud
June 2021
Cut cloud cost spending with a tool that works
More and more, we see our clients moving their workloads from clunky on-premise data centers to nimble cloud platforms, orchestrated container environments, such as Kubernetes and Red Hat OpenShift, or a combination of both. The technical aspects of such a migration are typically well-known. Your IT staff does a great job managing these environments: Still, there is one more aspect of managing these environments that is often overlooked — cost.
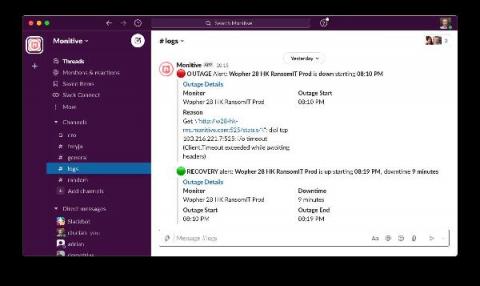
New: Outage alerts via Slack
Just launched outage and recovery alerts via Slack, right into your team's workspace and across all your Slack-enabled devices.
How to Monitor and Optimize Your Database Performance: A Practical Guide
It’s important to be able to look at the entirety of your application architecture, not just specific aspects of it, and understand how different parts connect. Observability comes first, followed by monitoring. In this post, we’ll dive into the database part of your architecture to show how you can monitor and optimize your database performance.
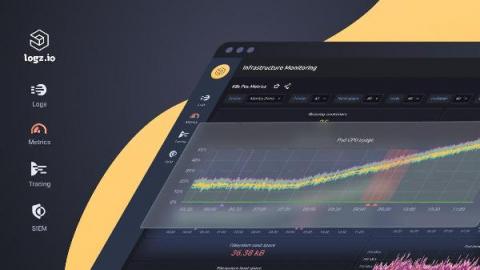
Introducing Logz.io's New Lookz!
When Logz.io was founded in 2015, we set out to simplify logging with the ELK Stack by delivering Elasticsearch and Kibana as a managed cloud service. But logs only tell part of the story – DevOps teams also need metric and trace data to better monitor the health and performance of their environment and quickly pinpoint the root cause of new problems. Importantly, using multiple tools to collect and analyze this data adds complexity and extra work.
Manage GKE services with Cloud Operations
Introducing Live Tail
At observIQ, we pride ourselves on delivering simple and powerful functionalities, quickly. We’re excited to announce the addition of Live Tail to the observIQ featureset. Live Tail emulates the terminal experience, giving you the ability to analyze, visualize and debug live – all in a single place. Never be worried about what the outcome of your deployment will be because Live Tail lets you troubleshoot, react and reassess issues in your deployment in real-time.
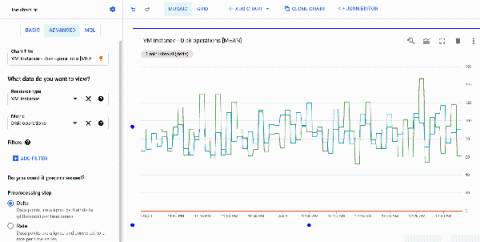
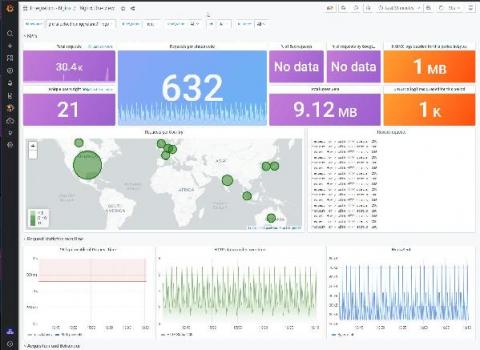
New in the Google Cloud Monitoring data source plugin for Grafana: sample dashboards, deep linking, more
More than two years ago, the Google team began collaborating with Grafana Labs to build a data source plugin for Google Cloud Monitoring (then known as Stackdriver). Today, Grafana ships with built-in support for Google Cloud Monitoring, allowing users to add it as a data source and quickly get started building dashboards for Google Cloud Monitoring metrics. We’ve continued to make improvements on the plugin, and we’ll share in this blog post a few new features we’ve built.
PHP Workers: Everything You Need To Know
When you are on the lookout for a hosting plan or web hosting solution for your websites, you must choose a hosting solution that matches your website’s needs and requirements. The hosting plan you choose must provide the required storage space, bandwidth, and other resources that easily accommodate your website’s traffic without any performance lag or other issues.
What Is the Future of Remote Infrastructure Management?
Once upon a time, the prospect of an organization letting another organization manage its IT infrastructure seemed either inconceivable or incredibly dangerous. It was like someone handing their house keys to a stranger. Times have changed. Remote Infrastructure Management (RIM) — when Company X lets Company Y, or a piece of software, monitor and manage its infrastructure from a remote location — has become the standard in some industries.
LogicMonitor Expands AIOps Investments with Acquisition of Dexda
SANTA BARBARA, Calif., June 30, 2021 – LogicMonitor, the leading cloud-based infrastructure monitoring and observability platform for enterprises and managed service providers, today announced it has acquired Dexda, a big data and machine learning predictive fault identification company.
What We Learned About Enterprise Cloud Services From the 2021 Azure Outage
Azure, AWS, and GCP cloud services are invaluable to their enterprise customers. When providers like Microsoft are hit with DNS issues or other errors that lead to downtime, it has huge ramifications for their users. The recent Azure cloud services outage was a good example of that. In this post, we’ll look at that outage and examine what it can teach us about enterprise cloud services and how we can reduce risk for our own applications.
Boosting Business Productivity By Taking Control of Microsoft Teams Performance
Learn the Basics of Distributed Deployment Architecture for LogStream
Monitor Windows without an Icinga Agent
Looking to monitor your Windows systems with Icinga, but aren’t allowed to install non-Microsoft certified software on them? Then you are in the right place. After all, you want to monitor your systems somehow. But you don’t want to lose the support from MS afterwards, just because you installed a monitoring system on it. Well, today I will show you how to monitor your Windows without having to install the Icinga agent.
Checkly raises $10M for Developer Owned Operations
Today, we are super happy to announce the next chapter for Checkly with a $10M Series A round led by CRV, joined by existing investors Accel, Mango Capital and Guillermo Rauch. This investment allows us to double down on our prime goal: building the best monitoring and E2E-testing platform for developers. What does that mean?
Expert advice on moving to serverless
We asked seven serverless experts, knowing what they know now, what piece of advice would they give to their past selves on moving to serverless. Here’s what they had to say: Ben Ellerby, AWS Serverless Hero and VP of Engineering at Theodo Serverless is a mindset change, bring your teams with you on the journey. Show them the power of Serverless hands-on – and invest in the developer experience of your pipelines from day 1. Ben Smith, Senior developer advocate for serverless at AWS.
The Technologies Every IT Professional Needs to Consider in 2021
SCOMathon 2021 - A big thank you
Thank you SCOM community for once again making SCOMathon a huge success! This year, our virtual conference on all things SCOM spanned not one, but two days, across multiple time zones – from Australia to the West Coast of the United States and everywhere in between.
The Art of Data | Episode 1
How to Connect With Other Community Members on THWACK
How Grafana Cloud drives manufacturing plant efficiency at American Metal Processing
What makes a manufacturing plant efficient? “Generally, it means that there’s no wasted materials, no wasted time, and no wasted energy,” said Grant Pinkos, President of American Metal Processing. “Unplanned downtime is minimal or nonexistent.
Why Debugging JavaScript Sucks - And What You Can Do About It
What makes JavaScript great is also what makes it frustrating to debug. Its asynchronous nature makes it easy to manipulate the DOM in response to user events, but it also makes it difficult to locate problems. And JavaScript’s ubiquity has resulted in a variety of runtimes (e.g. Chromium’s V8, Safari’s JavaScriptCore, and Firefox’s SpiderMonkey) but having so many platforms can cause dizzying idiosyncracies — all of which need to be supported equally.
User Identity Awareness with LoadMaster ESP and Flowmon
In one of the previous blog posts from the load balancing education series, we discussed the Edge Security Pack functionality to provide an additional layer of security in front of an application workload to ensure that only properly authenticated users can interact with the application. In this role, the LoadMaster acts as a gateway for the application and handles user authentication through a third-party identity provider such as Microsoft Active Directory.
How Psyonix wins with better logging
When you grow your peak concurrent users by 5x nearly overnight, ensuring that your operations can successfully support that growth can be a make or break for your success. Rocket League is a popular online multiplayer game created by Psyonix described as arcade-style soccer and vehicular mayhem. In the summer of 2020, the game maker decided to switch the business model of the game from an upfront purchase to a free to play model.
Search and Dashboards
How to Measure Network Performance: 9 Network Metrics
In this article we’re running you through what is Network Performance, how to measure network performance, what network metrics we should collect to measure network performance, what is the impact of poor network quality on the most commonly used applications, and what tools you should use to monitor network performance.
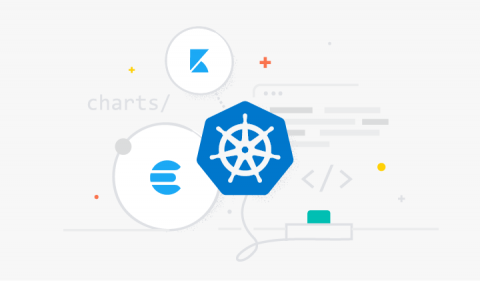
Monitoring Kubernetes with the Elastic Stack using Prometheus and Fluentd
Kubernetes is an open source container orchestration system for automating computer application deployment, scaling, and management, and seems to have established itself as the de facto standard in this area these days. The shift from monolithic applications to microservices brought by Kubernetes has enabled faster deployment, where dynamic environments become commonplace. But on the other hand, this has made monitoring applications and their underpinning infrastructure more complex.
Put a Stop to Data Swamps with Event-Driven Data Testing
Ensure data quality in your S3 data lake using Python, AWS Lambda, SNS, and Great Expectations. Data lakes used to have a bad reputation when it comes to data quality. In contrast to data warehouses, data doesn’t need to adhere to any predefined schema before we can load it in. Without proper testing and governance, your data lake can easily turn into a data swamp.
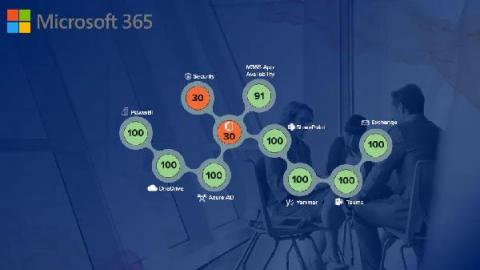
Microsoft 365: Are You Flying Blind...and at What Cost?
Many organizations today are migrating from on-prem solutions for email / calendar / communications to Microsoft 365. If this is you, this is your productivity cloud across work and life, designed to help you achieve more with innovative Office apps, intelligent cloud services, and world-class security.
Understanding Where You Fit in the Web Performance Maturity Curve
We all know that faster is better. Research and results clearly indicate that faster experiences with fewer errors result in increased usage, conversion, and revenue. With the desire to improve business metrics in mind, organizations often seek immediate improvements in customer experience across digital properties. However, without proper planning and coordination, these attempts consistently fail.
Observability vs. Monitoring: What's the Difference?
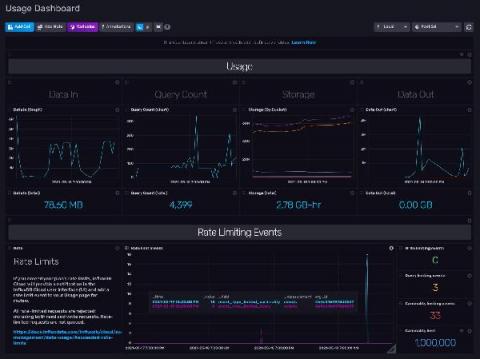
TL;DR InfluxDB Tech Tips - Using and Understanding the InfluxDB Cloud Usage Template
So you’re using InfluxDB Cloud, and you’re writing millions of metrics to your account. Whether you’re building an IoT application on top of InfluxDB or monitoring your production environment with InfluxDB, your time series operations are finally running smoothly. You want to keep it that way. You might be a Free Plan Cloud user or a Usage-Based Plan user, but either way, you need visibility into your instance size to manage resources and costs.
Superfast Troubleshooting of Network User Performance Issues
Why companies need URL filtering for enhanced cloud protection
The cloud landscape is rife with unsafe URLs and inappropriate content. This—coupled with the accelerated adoption of cloud applications in the workplace—has created an urgent need to scrutinize and control the use of these online resources to prevent data theft, exposure, and loss. This blog elaborates on how a robust URL filtering solution can help manage what cloud services your employees use and how they interact with these services.
EventSentry on GitHub: PowerShell module, templates and more!
Since we’ve accumulated a lot of resources around EventSentry that are updated frequently, we’ve decided to launch a GitHub page where anyone can access and download scripts, configuration templates, screen backgrounds and our brand-new PowerShell module that is still under development.
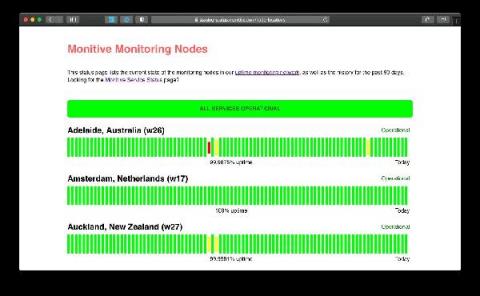
Status Pages Now Available
Unlimited Status Pages now available for all Monitive Pro users. Build trust, showcase reliability and inform your users of downtime in a professional way.
14 Different Ways To Fix "Your Connection Is Not Private" Error In Chrome
When you browse different websites on the internet, it is crucial to ensure that those websites are secure. Sometimes, when you open certain websites, you could face issues and error messages like “Your Connection is not private”. It is one of the common issue faced by users on Google as well as other web browsers. There could be many reasons for this prompted error message. It could either be an issue with the website’s security or an issue from your end or your internet connection.
An Intro Guide to Game Engine Logging & Locating Your Logs
Game development is an entirely different beast to other industries. Marketing, development, and release are more tightly interwoven than in other sectors, with a lot of pressure to meet community-anticipated milestones and launch. As such, it’s important to have game engine logging and monitoring pipelines set up for your projects. In other platforms, version upgrades and roll-outs tend to be sudden, with no definitive date set.
Catchpoint Overview
This Month in Datadog: June 2021 (Episode 2)
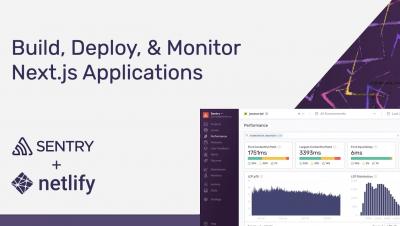
How to Build, Deploy, & Monitor Next.js Applications with Sentry and Netlify
New in Grafana 8.0: Streaming real-time events and data to dashboards
Grafana was made for large IT infrastructure projects, but a growing group of users rely on it for industrial/IoT projects, like monitoring physical equipment. And with good reason. According to Grafana Labs VP of Applications Ryan McKinley, “Software built by software engineers trying to know how their software is running is often nicer than industrial alternatives.” Some of the Grafana 8.0 updates were designed with industrial/IoT users in mind.
AWS Transit Gateways-Visualizing Cloud Routing with Kentik | Kentik Tech Talks, Episode 10
Full Stack Django Monitoring, Part 2
DX NetOps 21.2 Innovates with Scale, Speed, and Simplicity
DX NetOps 21.2 network monitoring software continues to innovate and improve the scale, speed, and simplicity of network operations with a focused set of high-value features and capabilities. Exciting new enhancements include increased monitoring scale, telemetry support, expanded SDN and cloud technology coverage, and usability and security updates. SCALE. Networks today handle a lot of data. That's why we are proud to support the largest deployments of networking technologies around the world.
What Top Brands Are Saying About Splunk Observability Cloud
Customers have had a lot to say about the new Splunk Observability Cloud since we announced general availability on May 5, 2021. For the first time ever, IT and DevOps teams can get all their data in one place with unified metrics, traces and logs — collected in real time, without sampling and at any scale. What makes Splunk Observability Cloud unique from other solutions? We’ll let our customers do the talking.
Why Do Employee-First IT Pros Make More Money?
Competition for good employees is fierce. Nearly all business leaders (95% according to a 2021 Robert Half study) say it’s challenging to find skilled professionals. So companies must invest in workplace experiences that can attract and retain talent. Competition for sales and market share is also tough, and that means companies must rely on top-tier talent to thrive in the digital era.
Nutritional Labels for Hardware? Believe it.
The turbulence of 2020 and increased remote working has meant that many businesses across the globe have been forced to make sudden and significant investments in hardware devices to support the working needs of their staff. Hardware companies like Apple, HP and Dell have been seeing a surge in personal computing/device sales to the point of shortages in the market.
3 Steps For A More Strategic Approach to Incident Reduction
When an IT incident negatively impacts employee experience, IT teams rush to remedy the issue – understandably, as a widespread incident can have major effects on employees’ productivity, security, and overall experience. Yet, so many IT teams find themselves drowning in support tickets even as they continue to resolve top call drivers (the incidents that affect the most employees and drive the most support requests).
Don't Let Network Issues Hurt the Employee Experience
We’ve all been there: the Zoom call that drops out in the middle of a crucial discussion; the browser application that won’t load when you badly need to access it. Network problems have been around since the dawn of the Internet, and they always will be. But during this recent period of remote working, connectivity issues have become a much bigger threat to workspace productivity and employee experience.
Here's What the Future Holds for IT Professionals
If someone predicted how IT roles will change in the coming years, they’d likely envision tech roles maturing around emerging and high-value new technologies, such as AI, data science, and the cloud, as well as an ongoing focus on cybersecurity across industries and business divisions. These topics frequently come up in discussions with tech leaders about the near future of IT roles. But many would be surprised by two major trends.
Go From Reactive to Proactive With Index Scoring
This one goes out to my fellow IT support leaders who might find themselves drowning in ticket data and stuck in reactive mode. I work as the Enhanced Support Services Lead at a global consulting firm where I manage my organization’s L2 support team and in-house Customer Experience Analytics team (CEA)—a group of individuals that I wish had by my side years ago—more on that later.
1 Year Later: Key IT Lessons from Remote Working
Even though lockdown in the UK is easing and shops are reopening, there remains a question mark around the timing for the return to the office. As the pandemic continues to impact society, many professionals find themselves continuing to conduct business from their home offices, dining rooms, or bedrooms.
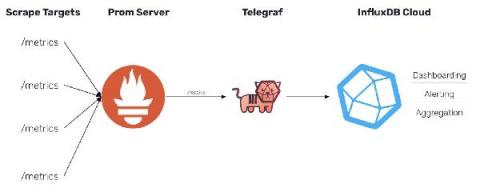
Prometheus Remote Write Support with InfluxDB 2.0
In InfluxDB 1.x, we provided support for the Prometheus remote write API. The release of InfluxDB 2.0 does not provide support for the same API. However, with the release of Telegraf 1.19, Telegraf now includes a Prometheus remote write parser that can be used to ingest these metrics and output them to either InfluxDB 1.x or InfluxDB 2.0.
SEMrush - Your End-to-end SEO Solution
In today’s digital age, keeping up with market trends is exactly what a business has to do to stay ahead. Creating a solid online brand image plays a key role in this task, and to do it, dedicated SEO efforts go a long way. Crafting targeted keywords that can direct traffic to your webpages can work wonders in capturing a widespread customer base. Now what if we were to tell you that instead of doing everything manually, you could rely on an automated tool to take care of things?
Product Demo
DX NetOps 21.2 Continues to Improve Network Visibility with New Business Hours Filters
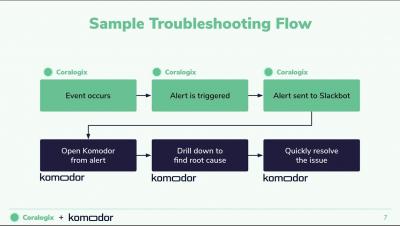
[Webinar] Troubleshooting in Fast Paced Environments with Komodor & Coralogix
Fine-tune network uptime monitoring with OpManager
Uptime monitoring has a direct impact on your organization’s ability to support end-users and deliver services. Not maintaining adequate uptime can interfere with business productivity and impact end-user satisfaction, eventually resulting in financial losses. Establishing uptime can be a challenging task since there are numerous factors that can act against it.
How Siemens uses IoT sensor data and Grafana to optimize train maintenance, capacity, and more
There’s something special about the interactions a train journey generates — the interesting views and perspectives that inspire insights and drive new thinking. Martin Klimmek, Head of Digital Development and Operations at Siemens Mobility and Haluk Tutuk, Data Platform Engineer with Periscube, are among 20 data scientists, data engineers, and DevOps engineers building the next generation of data-powered customer service for the rolling stock industry in the U.K. and beyond.
9 Possible Solutions To Fix a 502 Bad Gateway Error on Your WordPress Site
WordPress errors such as 502 bad getaway error frustrate and annoy the website owners and the users and visitors on your website. This is one of the most usual WordPress errors, and others such as the error establishing the database connection or white screen of death also create a lot of performance and other website issues. 502 bad gateway error is especially popular as it affects smaller websites and huge services such as Twitter, Gmail, CloudFlare experience this issue.
LogDNA | Spike Protection Bundle
Driving Service Improvements and Value in IT Operations | Netreo On-Demand Webinars
Driving Real world Value with Netreo's Microsoft 365 Insight | Netreo On-Demand Webinars
Skip to the End Accelerating Root cause Analysis | Netreo On-Demand Webinars
Managing IT at Scale | Netreo On-Demand Webinars
Cloud Visibility: Tips to Cover Your 'aaS' | Netreo On-Demand Webinars
Monitoring + ITSM + CMDB: Together in Perfect Harmony | Netreo On-Demand Webinars
Bridging the Gap Between Dev and Ops | Netreo On-Demand Webinars
Winning the Battle Against Data Deluge and Alarm Fatigue | Netreo On-Demand Webinars
Better Monitoring Netreo Case Studies | Netreo On-Demand Webinars
The 3 Keys to Automating IT Infrastructure Management | Netreo On-Demand Webinars
Establishing & Monitoring Your Microsoft Teams
To maintain effective Microsoft Teams performance, you must first understand two things: the metrics that define an optimal Microsoft Teams performance and where your Teams performance currently ranks against those metrics. By establishing a Microsoft Teams service quality baseline for your business, you can determine what is normal in terms of performance, and what isn’t. More importantly, you can identify where and when your focus should be to improve the overall user experience.
Alerts Configuration with Devices
That's A Data Problem - Thriving in an Uncertain World | Daniel Newman & Splunk's Doug Merritt
That's A Data Problem - How Do Security Programs Drive Business Results?
Observability Changes Everything
Trim Unneeded Fields from Events
Service Desk Automation Demands Deep Integration with Monitoring Tools
ITIL’s definition of a service desk is: “The single point of contact between the service provider and the users. A typical service desk manages incidents and service requests, and also handles communication with the users.” Service desks such as JIRA, Autotask and ServiceNow, often also support multiple IT Service Management (ITSM) activities.
"Should SRE Be Broken Up?": SRE from Anywhere Recap
This year’s SRE from Anywhere (SREFA) brought together hundreds of registrants from around the world to gather virtually, share experiences, and network around all things SRE. We were thrilled to see so many friendly faces!
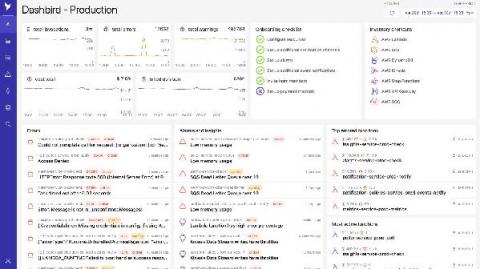
Debugging with Dashbird: Lambda Task Timed Out After X Seconds
When building serverless applications, Lambda functions often form the backbone of the system. They might provide just a few lines of code, but these lines are usually what hold the whole architecture composed of many managed services together. Event-driven architecture is what this style is called, and it’s most prevalent in serverless applications. API gateways collect requests from your users, convert them to events, and send these along the way.
Why You Need Real-Time for Faster MTTR
“If you ain't first, you're last.” While that famous one-liner from Ricky Bobby (Will Ferrell) in the cult hit Talladega Nights is more joke than catchphrase, it hits home for those of us in the world of DevOps and Observability. Faster is better. And in our technology-driven world of online transactions and complex environments, faster isn’t just better — it’s crucial.
UptimeRobot June 2021 Update: SSL info in Dashboard, test notification setup and meta robots tag
Last month was filled with news and we’re happy to report that we were able to finish the other three little features! Let’s take a look at them quickly so you can get back to enjoying the summer 🙂
Log Management Challenges in Modern IT Environments
Modern IT environments have presented many difficult-to-overcome challenges to organizations in recent times. One such challenge is gaining visibility into the systems. One may argue that due to cloud computing and limitless storage, it is now very easy to overcome some of the conventional challenges regarding visibility. However, the architecture has changed into infrastructure scheduling and microservices. Hardware and software programs are now more complex, with their own set of challenges.
Tips for Building a Homelab
Have you ever wanted to set up your own sysadmin homelab? Before you begin, you need to look at major decisions regarding your software and hardware requirements. In today’s age and date, almost every person has a personal computer, assuming smartphones as equivalent to computers. To set up a vmware vsphere homelab to your liking, let’s discuss important tips for each component of home sysadmin labs.
7 Must-Have Tools for Best PHP Performance
Delivering high-quality PHP applications is growing more difficult as applications become more complicated. Perfecting your PHP performance monitoring procedure is more crucial than ever. To all PHP developers out there, it is highly recommended that you use the appropriate PHP performance tools for each application you design to guarantee that it performs correctly. There are a number of tools available to track the performance of your application.
Boost Business Productivity
It’s one thing to be using Microsoft Teams. It’s entirely different to have your users running Teams efficiently. From dropped calls to lags in response time to jittery video connections – Teams isn’t without its daily problems. And yet, you’re being held responsible to not just make sure Teams is up and running but to also improve the quality of the user experience and overall business productivity.
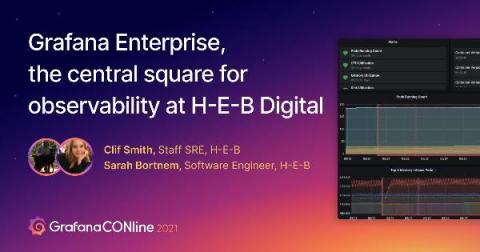
How grocery chain H-E-B uses the Grafana Enterprise Stack to improve business
H-E-B is one of the largest grocery chains in the U.S. that works with roughly 137,000 partners to achieve more than $32 billion in sales each year. In the past decade, the 116-year-old, Texas-based grocer has undergone a digital transformation to reinvent and expand its business, offering services such as online bakery orders, curbside pick-up, and grocery delivery from its 420 stores.
DataDog Competitors: 9 Alternatives to Consider
DataDog is a service that monitors cloud-scale applications. It is a platform used by developers of various information technology (IT) and DevOps teams. Through this service, they can define and regulate performance metrics. It was first developed in 2010 in New York by Oliver Pomel and Alexis Lê-Quôc, the current CEO and CTO, respectively.
Monitoring Availability Metrics with Blackbox exporter and Sysdig
The Prometheus Blackbox exporter allows endpoints exploration over several protocols, such as HTTP(S), DNS, TCP, and ICMP. This exporter generates multiple metrics on your configured targets, like general endpoint status, response time, redirect information, or certificate expiration dates. The Blackbox Exporter works out-of-the-box, as it just focuses on external visibility details. To get more detailed metrics, you can instrument your applications.
The Importance of Log Management for Your Home Network
The team at observIQ is just like every one of you reading this, we are avid programmers, gamers, traders, thinkers, and innovators who build an elaborate home network for fun, work, and for the simple reason that we enjoy technology. We are constantly growing the size and footprint of our home networks and labs as well – adding custom apps, devices, and servers, making it challenging to gauge our technical footprint.
LogDNA | Spike Protection Bundle
The Future of IT Ops Monitoring and How to Prepare
Josh Chessman, Senior Analyst at Gartner, spoke at SquaredUp Live 2021 on the future of IT operations (IT Ops) monitoring and how monitoring teams need to change to get there. Here are some of the highlights from his talk.
Connection Center for ServiceNow Deep Dive
A Riddle, a Sale, and the Importance of Proactive End-User Monitoring
Designing Honeycomb for Our Users
You might have noticed some visual changes happening in Honeycomb lately. Colors, typography, icons, and some features have started to look a bit different. While these changes are just beginning to make their way into the product, we’ve been working on them for some time. Let’s look at what has been going on behind the scenes to make them happen.
Practical CPU time performance tuning for security software: Part 1
Software performance issues come in all shapes and sizes. Therefore, performance tuning includes many aspects and subareas, and has to adopt a broad range of methodologies and techniques. Despite all this, time is one of the most critical measurements of software performance. In this multi-part series, I’ll focus on a few of the time-related aspects of software performance — particularly for security software.
The State of IT Operations Management in 2021
It's all changing! So, business as usual! Working flexibly from home quarantine these past two years has brought a few things into sharper focus. For a start, there's really no such thing as an IT system---there are only Human-IT systems. IT isn't an accessory, it's an integral part of us. Multiple tech cultures are playing a larger role in decision making. Technology decisions are becoming more distributed and more market-driven, from the bottom up rather than exclusively from the top down.
How to Use Observability to Reduce MTTR
When you’re operating a web application, the last thing you want to hear is “the site is down." Regardless of the reason, the fact that it is down is enough to cause anyone responsible for an app to break out into a sweat. As soon as you become aware of an issue, a clock starts ticking — literally, in some cases — to get the issue fixed. Minimizing this time between an issue occurring and its resolution is arguably the number one goal for any operations team.
How Log Analytics Powers Cloud Operations: Three Best Practices for CloudOps Engineers
DNS Lookup Explained
The Domain Name System, DNS for short, is one of the most important protocols on the internet, and yet relatively few people understand its purpose. DNS is a protocol which governs how computers exchange data online. Its purpose, simply stated, is to match names with numbers, helping to convert memorable domain names (such as statuscake.com), into an IP address (such as 8.8.8.8 for Google.com) that your browser can use. DNS is essentially a map or a phone book of the internet.
Tracing the Path to Clear Visibility in DevOps
Today, we’re excited to announce enhancements to the VMware Tanzu Observability by Wavefront platform, which helps teams scale their observability practices and shorten the feedback loops between development and operations. The new features give more flexibility and functionality to any open source investments; help operations, development, and SRE teams resolve problems faster; and extend observability more efficiently into DevOps workflows. Here’s a quick rundown of what’s new.
Mute Datadog alerts for planned downtime
We’re happy to announce the release of new muting features for Datadog monitors. Scoped monitor muting allows teams to eliminate unnecessary alerting during scheduled maintenance, testing, auto scaling events, and instance reboots. Your teams will therefore be able to filter out expected events and quickly pinpoint critical issues in your infrastructure. Previously, monitor muting was binary: all-or-nothing.
Best practices for shift-left testing
There are several different testing methods you can use as part of your development process to ensure you build high-quality applications. Shift-left testing is one approach that has become popular with agile teams because it enables them to move the testing phase to earlier stages of the development life cycle, which is a primary goal for agile development. Shift-left testing has a few advantages over traditional methods.
What is Git Checkout Remote Branch? Benefits, Best Practices & More
Git is a terrific tool that many developers use to keep track of their projects’ versions. Despite the fact that there are many different version control systems, git is by far the most used. The focus on distributed development and the ease with which branches can be used for good reasons. A branch is a simple approach of departing from the main development flow. It's typically used in a branch to add a new feature or correct an issue.
Adding Kubernetes Metadata to Your AppSignal Errors
When we were moving an app to Kubernetes, we encountered a peculiar situation where other services running on Kubernetes started throwing a ThreadError from time to time, saying that a resource is unavailable. We started investigating, and it turned out that you want to know where your AppSignal error has occurred. A short reminder - Kubernetes works on two levels: So, you want to know which pod and which node ran a particular AppSignal transaction.
How Database Monitoring Can Boost Your Performance
Anyone who is responsible for database performance knows how demanding and challenging database performance tuning is when managing a database. One of the critical functions of this process – database monitoring – is often overlooked. Database monitoring includes identifying the right SQL for tuning, determining right way to tune and whether SQL is right thing to tune.
Announcing new features for Cloud Monitoring's Grafana plugin
The observability of metrics is a key factor for a successful operations team, allowing for increasingly effective visualizations, analysis, and troubleshooting. Google Cloud works with third-party partners, such as Grafana Labs, to make it easy for customers to create their desired observability stack leveraging a combination of different tools. More than two years ago, we collaborated with Grafana Labs to introduce the Cloud Monitoring plugin for Grafana.
New in Grafana Enterprise 8.0: Fine-grained access control for reporting and user management
From early on, Grafana has managed access control with three organizational permission levels (Viewer, Editor, and Admin) and one special global permission level of Grafana Admin. There are also configuration file options that can be globally applied to all users in an organization within an instance, as well as data source permissions and dashboard permissions.
Integrate Jira and Datadog for Open DevOps - Demo Den - June 2021
DX NetOps 21.2 Innovates with Scale, Speed and Simplicity
Spike Protection Feature Release at PagerDuty Global Summit
Auto-Configure PagerDuty with Terraform at PagerDuty Global Summit
Troubleshooting AWS Serverless Applications With Lumigo
Maximize Business Continuity by monitoring Citrix NetScaler with SCOM by Marc & Merijn
Work From Anywhere - How Much Bandwidth Do You Need?
Over the last year, when talking to large enterprises about employee experience management, one question has come up consistently, “How do I decide the right internet connection to ensure employees can get work done seamlessly?” Although we are well into the “work from anywhere” world, employee experience management is still something that companies are struggling with. Most employees continue to work remotely and are often moving to new places.
Contributing to Open Source
If you’re here you probably know the essence of open source already. To us, open source means more than just open source code – it’s also the ethics and the community feeling that goes along with that. For us it means that the people working on Icinga are more than just who we see in our office – Icinga lives from your ideas and contributions. And we want to invite you to join in on the fun!
Leverage Observability With OpenTelemetry to Understand Root Cause Quickly
An observability solution should help any incident responder understand what changed and why. A lot has been written on the difference between monitoring and observability, but an easy way to understand how both are integral to incident response is to consider how customers use PagerDuty—with both monitoring and observability tools—to get to the right answer.
Do you know what VMWare is and how to include it in monitoring?
Before we dive into how to monitor virtualized environments with VMWare, let’s clarify a couple of concepts for those who are less into the subject, starting withWhat is VMWare?. VMWare is a software product development company, mostly related to virtualization, and more recently to containerization, although this is beyond the scope of this article. Today, we are going to focus on monitoring virtualized environments with VMWare.
Is Operational Resilience in Financial Services actually just a data problem?
Operational resilience is currently a hot topic in Financial Services, largely because of the impact that COVID has had on how customers interact with financial institutions. Almost overnight, the financial services industry had to cope with a large volume of transactions moving to digital channels at the same time as its employees were forced to set up home offices so that they could continue to work remotely.
5 website metrics to monitor since Google's algorithm update
Google has finally started unveiling its algorithm update, much to many website owners’ dismay. Unfortunately, we don’t have a choice in the matter. Instead, we have to just jump on board and make sure that our websites are in tip-top condition so that the search engine giant can’t find a reason to penalise us or drop us in rankings. This refers to the average time the page takes to load when a customer clicks onto your website.
Pulno - The Ideal Website Evaluator
If you’ve been working with SEO for some time, you’d know that although it’s a reliable way of improving your website’s searchability, it’s often marred by the downside of being very time-consuming. Moreover, manual SEO strategies could easily fail to achieve the desired results because of the ever-increasing level of competition. In such a scenario, an automated tool that helps you enhance your SEO efforts can prove to be a boon.
Post pandemic website monitoring: what to look for
Today’s global commerce landscape requires companies to have essential real-time, critical data about how efficiently their networks are functioning. This is especially true for enterprises engaged in e-commerce where having a clear window into the end user experience enables them to compete in an increasingly crowded marketplace. This holds true for the largest international organizations all the way down to locally based start-ups.
A Guide to AWS Lambda Logging
In this post, we will discuss some key considerations and strategies to collect and analyze your AWS Lambda logs. This will include 1) what to know about logging Lambda functions, 2) how to ship log data to a centralized logging solution, and 3) how to search and visualize log data on monitoring dashboards.
Global Site Load Balancing Explained
Global Site Load Balancing (GSLB) is an important part of your application infrastructure, but many people don’t understand its benefits. In this post we’ll explain how GSLB works and how LoadMaster GEO can bring big benefits in availability and performance at a fraction of the cost of alternatives.
9 Best Real User Monitoring Tools and How to Choose One for Your Business
Bugs are more likely to enter the equation as applications grow larger and more complicated, resulting in poor user experience. We tend to abandon applications when they don't load as quickly as we expect. Developers need code-level performance insights to deliver the optimal user experience. They also need to know which users are affected by issues so that they can reproduce the issue and work on a solution more quickly.
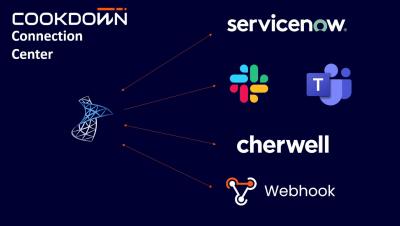
SCOM Connection Center your single source of truth for all your enterprise tools
Most companies have SCOM. But you can never realize the true value of SCOM unless you integrate it with your other tools! Here at Cookdown, we’re passionate about making SCOM integrations, which is why we are so excited to announce the launch of our SCOM Connection Center. Now you can connect SCOM to anything with an API, allowing you to send notifications in real-time to any location or device.
Connection Center for Teams and Slack
Connection Center Overview
How to Configure Dashboards in SolarWinds Service Desk
10 Popular Alternatives to AppDynamics
Application performance is one of the most important factors in determining your brand reputation, revenue, and authenticity in the virtual marketplace. There are several ways to monitor your application’s health and performance. Some choose to do it the traditional way - manually. Others prefer to adopt an automated solution capable of monitoring an application 24/7 and producing useful visualizations all by itself.
Multitenancy: What You See vs. What They See
Multitenancy is one of the core concepts of cloud computing. As an organization considers bringing in cloud capabilities, it’s crucial for them to understand the full range of tenancy options available to them, and what each will mean for their company. This article will break down the intricacies of multitenancy, how it stacks up against other tenancy models, and its benefits.
The Future of Observability
o11ycon Keynote
Grafana dashboard showcase: Visualizations for Prometheus, home energy usage, GitHub, and more!
The Grafana community is one of the most vibrant in all of web development. And to celebrate the conclusion of GrafanCONline, the launch of Grafana 8 and Tempo 1.0, and so much more, we’re pleased to share this dashboard showcase. (And in case you missed any of the great sessions at GrafanaCONline, the videos are available on demand now!) Each of these 12 dashboards was built by our community, for our community.
Netdata is launching its Discord server
It’s been a long time since our last community update, rest assured that we have been hard at work here at Netdata. Community building is hard, especially when you have such a venerable community like the one here at Netdata, where hundreds of contributors have contributed to creating one of the best monitoring solutions that exist. Last year we started to concentrate working on consolidating the community by integrating the various platforms where people come together to talk about Netdata.
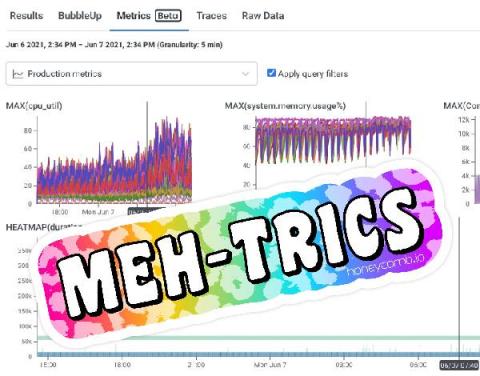
Introducing Honeycomb Metrics
GDIT and NIH: Why ScienceLogic?
Southwest: Why the emphasis on business service monitoring vs. device monitoring?
What are the business outcomes you're creating at Southwest with the Tools Modernization Project?
What is the VA's Strategic rationale of accelerating to hybrid-cloud with AIOps?
VA: Architecting Effective AIOps Tools Integration to Provide End-to-End Business Services
How did the VA get started on the AIOps journey with ScienceLogic?
How ScienceLogic Helps Opus Modernize and Uplevel its Operational Maturity with Automation
Telstra: 3 IT Workflow Automation Use Cases to Turbocharge Your Business
Bon Secours Mercy Health Employs SL1 to Extract Surgical Insights for its Unified Communications
Southwest: What are the primary use cases for automations and how did you get started?
Capgemini Requirements for NOC Transformation
How ScienceLogic Fits into Capgemini's AIOps architecture
Capgemini AIOps Journey - Going from Reactive, to Proactive to Predictive
Why ScienceLogic for Capgemini's NOC Transformation?
Capgemini: Why ScienceLogic for AIOps?
7 Steps to Strengthen Your Security Posture
Learn more about your security posture and why it matters. Assess and strengthen your IT security posture with these critical steps.
Why Dashboards Are Not Enough to Proactively Monitor Your Business
How much is your company losing by reacting to problems after they’ve had a negative impact on your bottom line? How many customers churn in the time it takes you to notice complaints to your call center? Proactive business monitoring allows you to detect incidents before they have a negative impact on your company’s revenue and reputation.
Unify Visibility Across Your Monitoring Tools with DX Operational Intelligence
For today’s businesses, there’s a premium on delivering innovative user experiences. As a result, stakes continue to grow for the teams in charge of supporting new digital experiences. To successfully implement modern delivery chains, IT operations need to establish comprehensive coverage that delivers unified visibility of the entire enterprise ecosystem. They need observability that spans from mobile applications to networks and mainframes.
Splunk Workload Pricing For the Win!
We at Splunk know that data drives better decisions. We see this with customers, and we live it every day in our own operations within Splunk. Running large cloud services across multiple cloud providers, we have to manage data policies and data processing needs against an increasing set of use cases, as well as the backdrop of regulatory, privacy and security frameworks.
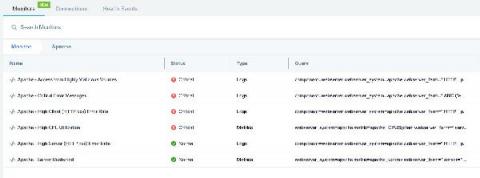
Using pre-built Monitors to proactively monitor your application infrastructure
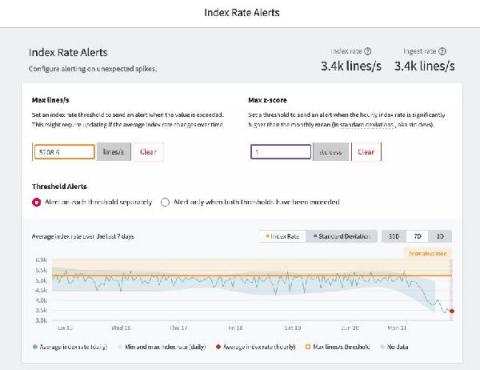
The Spike Protection Bundle with Index Rate Alerting
For DevOps teams that want to accelerate release velocity and improve reliability, logs can unlock the insights you need to move faster. But for managers and budget owners, logging can be an unpredictable pain. Trying to estimate logging spend, especially with the adoption of microservices and container-based architecture, seems like an impossible task.
Announcing LogDNA Agent 3.2 GA: Take Control of Your Logs
The LogDNA Agent is a powerful way for developers and SREs to aggregate logs from their many applications and services into an easy-to-use web interface. With only 3 kubectl commands, the installation process is quick and simple to complete for any number of connected systems. To help control the logs that are stored and surfaced in the LogDNA web interface, users can set Exclusion Rules, which enables the exclusion of certain queries, hosts, and tags directly from the UI.
Tracealyzer Demo and Features
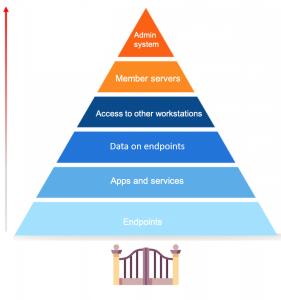
The role of endpoints in the security of your network
Endpoint security is a hot topic of discussion, especially now with so many businesses shifting to remote work. First, let’s define what endpoints are. Endpoints are end-user devices like desktops, laptops, and mobile devices. They serve as points of access to an enterprise network and create points of entry that function as gateways for malicious actors. Since end-user workstations make up a huge portion of endpoints, we’ll be focusing on their security.
Rails Security Threats: Authentication
Authentication is at the heart of most web development, yet it is difficult to get right. In this article, Diogo Souza discusses common security problems with authentication systems and how you can resolve them. Even if you never build an authentication system from scratch (you shouldn't), understanding these security concerns will help you make sure whatever authentication system you use is doing its job.
GrafanaCONline Day 6 recap: The latest on Loki for logs, Grafana for monitoring high performance computing, the business of Grafana Labs, and more!
GrafanaCONline 2021 has ended! Thank you to everyone who tuned in and to all of our presenters. If you’d like to relive any moment, it’s not too late to sign up to get notified about on-demand access to all the session recordings, which will be available soon. If you didn’t get a chance to watch Thursday’s presentations, here’s what you missed from Day 6 of the conference.
Dotcom-Monitor: Monitoring Overview
Auvik Presents: Rollup & Retrospective Q2 2021
Releasing and Debugging Software in Production with Honeycomb
OpenTelemetry, Not Just for Production Troubleshooting
Conditional Distributed Tracing
Observability is More Fun With Friends: Stories From OpenTelemetry Collaboration
LogDNA | Log Management for DevOps
GripMatix Proud Sponsor of SCOMathon 2021
SCOMathon 2021 - Virtual SCOM conference GripMatix was a proud sponsor of SCOMathon 2021. A two day Virtual SCOM conference for Microsoft MVPs, SCOM experts, and SCOM customers. A big thank you to all attendees, speakers, sponsors and hosts. It was absolutely awesome.
WHAT'S NEW Pandora FMS 755
Let’s review together the features and improvements related to the new Pandora FMS release: Pandora FMS 755.
Node.js Server Monitoring Best Practices
Node.js is a known and popular JavaScript framework for 2021. With the increasing utilization of Node.js in development, there is an equally increasing need for Node.js server monitoring. Since server monitoring is essential to all applications, it is important that you apply best practices when monitoring Node.js servers. Servers are devices for storing or processing information provided to other devices, applications, and users on-demand.
Instrumenting Java Applications for Tracing with OpenTelemetry and Jaeger
The aim of this article is to demonstrate how you can instrument a Java application using Opentelementry and Jaeger. In this example, we will be instrumenting our Java application using OpenTelemetry and the OpenTelemetry Java client, and the tracing data will be exported and visualized using Jaeger. We will use the Logz.io Jaeger backend as it is compatible with common tracing standards like Zipkin, OpenTelemetry, and OpenTracing.
14 Website Speed Optimization Tips: Techniques to Improve Performance and User Experience
In today’s digital world, everything comes down to speed. It doesn’t matter if you have the most complex and good-looking site if it takes forever to load. There are various reasons why your web pages may load slowly, but no matter the cause, today I’m going to show you some useful tips and techniques on how to improve your website performance and speedand ensure a smooth user experience. But first things first.
9 Best Application Performance Monitoring Tools on the Market and Why Should You Use One
The Application Performance Monitoring (APM) tools make managing your applications simple and easy, ensuring that your business software performs at its best. It's one thing to keep track of IT infrastructure and networks, but it's frequently the applications that demand the greatest care. It's not just the fact that there could be a lot of them; it's also the fact that they tend to update regularly, which can lead to software conflicts and unexpected hardware issues.
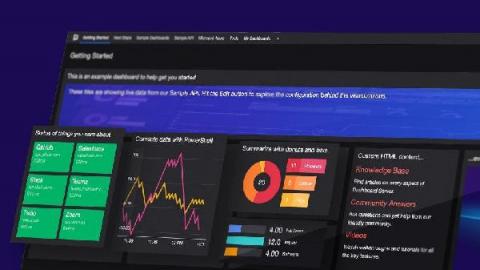
Dashboard Server: Image and Web Content tiles
We’ve come to the end of the Dashboard Server Learning Path. In this final instalment, let’s take a look at the remaining two tiles – the Image tile and the Web Content tile. We’ll start with the image tile first.
How Monitoring Microsoft Teams Service Quality
The effects of remote work go beyond an employee trying to remain productive and stay connected to their team. The organization’s IT team must deal with a host of challenges that stem from trying to keep everyone effectively connected to a network when there are things such as different internet service providers and routing paths to contend with. Another challenge faced by IT is the influx of ‘poor call quality issues because of the varying internet connections, equipment setups, etc.
Turning Cross-Stack Correlation Into Better Collaboration | THWACK Livecast Series Session #3
DPA Virtualized Database Video
Rollbar + Clubhouse (Benefits&Demo)
Rollbar + Logrocket (Benefits & Demo)
Observe & Troubleshoot Your Kubernetes Environments with Dynamic Service Graph
Kubernetes workloads are highly dynamic, ephemeral, and are deployed on a distributed and agile infrastructure. Application developers, DevOps teams, and site reliability engineers (SREs) often require better visibility of their different microservices, what their dependencies are, how they are interconnected, and which other clients and applications access them. This makes Kubernetes observability challenges unique.
Embedded Analytics for IT
When we hear the term ‘embedded analytics’, most people think of business intelligence. The concept of embedded analytics refers to the integration of analytic content and capabilities within a business process application. The business benefits of embedding analytics into a business process include increased visibility, more effective strategic planning and accelerated time to value.
What happened to Fastly and why did so many websites experience downtime?
A phrase we never thought was possible – “the internet is down”, was being shouted across the world on Tuesday 8th June 2021. Alarm bells were ringing when hundreds of websites had an “error 503” show up when visitors tried to access them. So what happened to the internet? A relatively unknown company soon dominated global news headlines for causing the websites’ “blackout”.
SCOM Connection Center for Cherwell - Introduction in 3 mins
SCOM Connection Center for Cherwell Introduction
GrafanaCONline 2021 Day 5 recap: Grafana alerting, dashboards as code, synthetic monitoring in Grafana Cloud, and more!
GrafanaCONline 2021 is still going strong and you can tune in live (for free!) or sign up to get notified about on-demand access to all the session recordings, which will be available after GrafanaCONline ends. Here’s what you missed on Day 5 of the conference.
Jamstack, Next.js, Netlify, and Sentry: How The Pieces Fit
Jamstack (Javascript + APIs + Markup) is a web architecture that combines the convenience of pre-built websites with the capacity to handle custom APIs and serverless functions. By separating the frontend UI from backend databases, Jamstack allows developers to structure their application in ways that deliver dynamic content faster.
SCOMathon 2021 - A big thank you
Thank you SCOM community for once again making SCOMathon a huge success! This year, our virtual conference on all things SCOM spanned not one, but two days, across multiple time zones – from Australia to the West Coast of the United States and everywhere in between.
Zones and Hosts a Catchpoint Differentiator
Prove User Behavior Is Root Cause of Citrix Performance Issues
Tip of the Month: BiQ Release Validation
How to Monitor Full-Stack Django Applications
Transforming Network Monitoring For The "Everything-As-A-Service" Era
Modern applications enable enterprises to scale faster with better efficiency and resilience. The main advantage of a multi-cloud/hybrid cloud infrastructure is in its highly distributed architecture that offers proximity – bringing end users closer to the service provider.
Data Availability Isn't Observability
But it’s better than nothing… Most of the industry is racing to adopt better observability practices, and they’re discovering lots of power in being able to see and measure what their systems are doing. High data availability is better than none, so for the time being, what we get is often impressive. There’s a qualitative difference between observability and data availability, and this post aims to highlight it and orient how we structure our telemetry.
Introducing New Cloud Security Monitoring & Analytics Apps
OpManager makes network monitoring easy for Heritage Credit Union
About Heritage Credit Union Heritage Credit Union Limited is a US-based, non-profit financial institution founded in 1934. Today, it serves more than 28,000 members in Illinois and Wisconsin, with $450 million in assets and more than 120 employees. It takes care of its customers’ credit cards, banking, auto loans, mortgages, and savings accounts.
Real-time distributed tracing for Go and Java Lambda Functions
Serverless applications streamline development by allowing you to focus on writing and deploying code rather than managing and provisioning infrastructure. To help you monitor the performance of your serverless applications, last year we released distributed tracing for AWS Lambda to provide comprehensive visibility across your serverless applications.
VMware Monitoring Made Easy
Get insight beyond the virtualization layer for boosting your VMware efficiency and flexibility.
Automate remediation of threats detected by Datadog Security Monitoring
When it comes to security threats, a few minutes additional response time can make the difference between a minor nuisance and a major problem. Datadog Security Monitoring enables you to easily triage and alert on threats as they occur. In this post, we’ll look at how you can use Datadog’s webhooks integration to automate responses to common threats Datadog might detect across your environments.
Monitor ActiveMQ Artemis and Classic with Datadog
ActiveMQ is a message broker that uses standard protocols to route messages between disparate services. ActiveMQ currently offers two versions—Classic and Artemis—that it plans to merge into a single version in the future. Both versions provide high throughput, support synchronous and asynchronous messaging, and allow you connect loosely coupled services written in different languages.
New website launched
Between static websites and Wordpress, you’ll find Ghost, a publishing platform simple enough to enjoy using and powerful enough to get the word across.
What role does ITIL Project Management play in ITSM?
Organizations with established ITSM strategy already know how ITSM can transform the IT department from a cost-center to a value-generating driver to offer real business value. As teams modify their service operations to meet increasing needs, IT departments are under more pressure than ever to swiftly execute changes without putting their service levels at risk. This is where organizations can leverage project management best practices along with ITSM best practices to introduce new services.
GrafanaCONline IoT Day recap: Real-time streaming in Grafana 8, fun DIY projects, Grafana for trains, plants, and more
Week two of GrafanaCONline 2021 is going strong! To catch the live sessions — or to watch all the videos on demand after GrafanaCONline ends on June 17 — register here. If you didn’t get a chance to watch yesterday’s presentations, here’s what you missed from Day 4 of the conference.
The Wolf Pack Tactic for Monitoring Slow APIs
Even if you write the fastest code in the world, you can still be slowed down by external factors. In this post, we will deal with performance monitoring external APIs and how you can prevent these slow APIs from slowing you down.
AIOps for IT Ops - Part Two: Gartner Market Guide Insights
Create Google Chat alerts with Pandora FMS
How to Troubleshoot Network Issues | Obkio
NiCE Management Packs | What Makes Them So Unique
SolarWinds SQL Sentry Overview
How to Install SolarWinds SQL Sentry
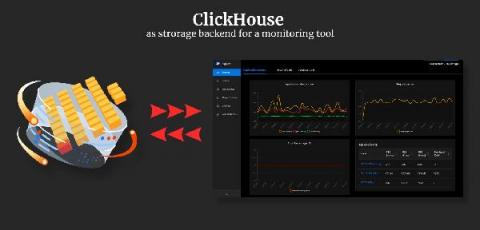
Launching support for ClickHouse as storage backend for SigNoz
In this article, we dig deeper into why we decided to extend support for ClickHouse as a storage backend for SigNoz and the efficiency gains we achieved using it.
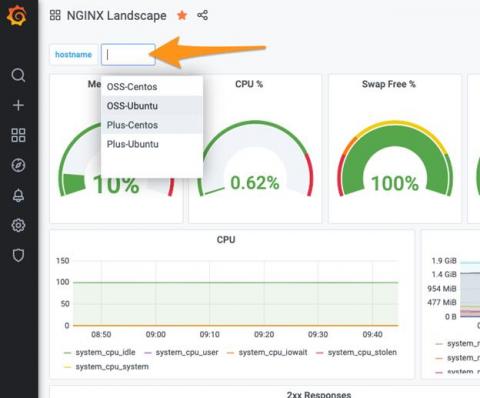
Using Grafana to measure the health of your NGINX instances with NGINX Instance Manager
Grafana is an extremely powerful application and infrastructure observability and health platform. The ability to quickly generate operational insights from an amalgamation of sources is compelling. Grafana also benefits from the ability to natively query a Prometheus endpoint to display time-based metrics for display in a dashboard. We’ve built the NGINX Instance Manager tool to measure the health of your NGINX instances with the help of Grafana.
Branding the GroundWork Monitor login page
How Martello Helps Managed Service Providers
It’s no secret that the modern era in which we live and work must fulfill an ever-increasing demand for digital transformation, especially when it comes to business. Microsoft Teams’ growth over the past year has been exponential, and while many companies rely on Microsoft 365 for their business continuity, very few of them have the tools to manage and support these services internally.
Instrumenting Microservices with Istio for Distributed Tracing
Previously, I wrote a Beginner’s Guide to Jaeger + OpenTracing Instrumentation for Go providing guidance on manually instrumenting Go services. This is useful for cases where we want fine-grained tracing of specific functions. However, what if all we want is to trace a service’s inbound and outbound calls with little to no additional code?
Nexthink - Overview
Introducing dark and light theme modes
We are constantly working to make Icinga even better by adding new useful features. We will be releasing Icinga Web 2 version 2.9.0 very soon. This version will have many new interesting features. One of these functions gives you the option to change the theme mode to Dark, Light or Auto. The default Icinga theme will come with all three modes and will use Dark as the default theme mode. You can change it at any time in the account preferences.
Pandora FMS and Nagios back in the ring. The final comparison
NagiosXI is the proprietary heir of one of the best-known tools in IT to monitor systems without a license, that is, as a free product. As a free product, Nagios (without XI) is a product that is almost 20 years old and suffers from many shortcomings, but for many years it has been the standard among “free” products and it fulfilled its role in those cases where the budget was quite short or the features needed were just a few.
The State of Observability in 2021
Today, we released our second annual Observability Maturity Community Research Findings report. This year-over-year report identifies trends occurring in the observability community that we use to further develop our Observability Maturity Model. Our goal in running this annual report is to understand community perceptions and awareness of observability, how engineering teams are approaching observability, and mapping an observability maturity model that reflects current research findings.
How to set up Elastic Cloud: Advice from Elastic Support
I hate reinventing the wheel once I find a good setup. On top of that, I dislike searching for all the links I used to come up with the “ultimate setup” for different services. So, I decided to outline for myself (and for you of course) my default setup when I deploy on Elastic Cloud to set myself up for success and automate insight for the future. Most of my setup steps make monitoring accessible or automate various warnings to myself.
There's No Such Thing as an Average Workload
When you’re planning to move a workload to the cloud, whether public or private, you need to select the best instance size and volume types to meet your needs. Sounds obvious, but the process is anything but.
Introducing the Nexthink Service Graph Connector
Configuration Management Databases (CMDBs) are key elements of any IT infrastructure. In large or growing organizations, however, successfully managing a CMDB is no easy feat. After all, IT Operations teams are responsible for managing tens of thousands of data points in dynamic environments. Lack of visibility, shallow troubleshooting, and the overall maintenance of a “healthy” CMDB can quickly lead to frustrations and result in expensive professional services support.
Aliaksandr Valialkin and Roma Novikov - Percona- PMM: Migration From Prometheus to VictoriaMetrics
Monitor Databricks with Datadog
Databricks is an orchestration platform for Apache Spark. Users can manage clusters and deploy Spark applications for highly performant data storage and processing. By hosting Databricks on AWS, Azure or Google Cloud Platform, you can easily provision Spark clusters in order to run heavy workloads. And, with Databricks’s web-based workspace, teams can use interactive notebooks to share datasets and collaborate on analytics, machine learning, and streaming in the cloud.
Manage incidents on the go with the Datadog mobile app
The Datadog mobile app enables you to check your alerts and dashboards from anywhere, so you can triage issues—and stay up to date—regardless of whether you have access to a laptop. You can now be even more productive when responding to issues while away from your keyboard by declaring incidents and notifying responders directly from your mobile device.
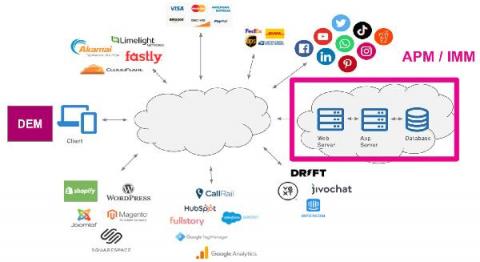
The Network Performance Take on Digital Experience Monitoring
Digital experience monitoring (DEM) is software dedicated to monitoring end-user experience. To do this, DEM software tracks user data, resources, and applications to highlight areas of performance for improvement; from site navigation to product usability.
Tutorial: Set Up Event Streams in CloudWatch
When building a microservices system, configuring events to trigger additional logic using an event stream is highly valuable. One common use case is receiving notifications when errors are seen in one of your APIs. Ideally, when errors occur at a specific rate or frequency, you want your system to detect that and send your DevOps team a notification. Since AWS APIs often use stateless functions like Lambdas, you need to include a tracking mechanism to send these notifications manually.
GrafanaCONline 2021 Day 3 recap: Grafana Tempo deep dive, plus how Grafana helps grow e-commerce, scale NFT platforms, and more!
Welcome to week 2 of GrafanaCONline 2021! There are three more days of programming that you can tune into live by registering here. You will also be able to watch all the videos on demand after GrafanaCONline ends on June 17. Here’s what you missed on Day 3 of GrafanaCONline.
Find the Root Cause Faster with Trace View and Trace Navigator
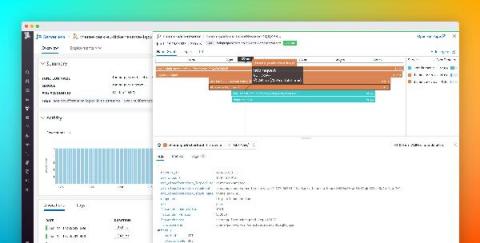
Like a bratty teenager, traditional monitoring answers your questions, but does so in a terse, unhelpful manner: Why is my page slow? Guess it’s the API call. It’s a 504 thing — you wouldn’t understand. Ok, so why is the API call slow? Ask your DB query. Gosh! You need a better conversation with your code — one which gives you contextual clues about your application’s performance.
Scout APM Announces Release of Error Monitoring
[Denver, CO] - Scout APM, a leading provider of Application Performance Monitoring (APM), announced the release of Scout Error Monitoring for Ruby applications on June 1, 2021. Scout APM provides developers and application administrators software performance insights by delivering key web application performance metrics.
ISS GEO Tracking with Graylog
How to Deal With Burnout in IT
If you’re feeling burnt out or drained at work, you’re not alone. Burnout is an all too common feeling in the information technology industry, especially now that work-life balance has become a bigger challenge due to remote work. Burnout leads to people feeling overwhelmed and chronically exhausted, which in turn can increase stress levels, reduce well-being, and affect you physically and mentally.
How to debug a Kubernetes application
RapidSpike Website Redesign
If it’s not broke, don’t fix it… or so the saying goes. But at RapidSpike that just doesn’t cut the innovative mustard, so we’ve redesigned our website, overhauled our branding and done it all with the intention of highlighting the core functionality behind the RapidSpike site for the customer’s benefit. Here’s what we did and why.
How to Monitor Full-Stack Django Applications
Observability and the Monitoring Maturity Model
In incident management, observability is the ability of an organization or team to infer a system's internal state from its external outputs.
Managing Remote Employee Experience: Lessons From a Fortune 1000 Healthcare Organization
Ensuring a productive remote workspace was one of the main priorities of many enterprises and organization in 2020. A majority of the global workforce across different industry verticals, including the healthcare industry, were forced to work remotely. Healthcare organizations had to quickly update infrastructure and software to support the shift without compromising productivity.
10 reasons to change your monitoring software
Cuando se habla de cambiar de software, no sé por qué, me viene a la mente la compra de música. Bueno, yo soy de los de antes: vinilos, cassettes, a principios de siglo los CD y DVD… Claro, ahora es diferente, actualmente existe el pago por suscripción, que reproduce en línea, y donde generalmente se ofrece el álbum de turno o paquetes completos con muchas estrellas musicales…
AWS updates for serverless builders in 2021
In this article, we’re covering all the latest updates from AWS in 2021 that serverless builders should be aware of. Before we start, let’s recall a few significant updates in serverless, announced at re:Invent 2020. One of the things that we see is that agility is really one of the primary drivers to one’s workload in the cloud and serverless is a good example of this. But the discussion often starts with cost.
OpsRamp enhances partner program to drive more opportunity through the channel
Under new channel leadership, OpsRamp has rolled out a series of updates to its partner program, including a more partner-friendly profit-sharing model, enhanced lead-sharing, and more comprehensive sales assistance, complete with sales and technical training, co-marketing and demand generation, and selling resources. OpsRamp also has committed to expanding its channel team with dedicated regional channel account executives and solution engineers for technical sales support.
What is Network Visualization?
Developer Native Observability Platform
Top 5 causes of network packet loss and how to resolve them with OpManager
Network packets contain pieces of information that are sent and received enabling communication. When these network packets fail to reach their destination, it results in network packet loss. Network packet loss causes heavy latency and disruption, so, when a network suffers packet loss, it can lead to undesirable circumstances, and organizations might even end up losing business.
Monitor Salesforce logs with Datadog
Visibility into your Salesforce environment is crucial for keeping your data secure and ensuring a seamless user eperience. That’s why we are excited to announce that Datadog can now collect Salesforce event logs directly from your Real-Time Event Monitoring stream, giving you deep insights into the security and operational performance of your Salesforce environment.
A Guide to Quarterly Business Reviews for MSP
Small businesses face many operational challenges, one of which is effectively managing client relationships. When burdened with tasks like closing deals and maximizing profits, customer’s strategic requirements are often overlooked. MSP Managed Service Providers should consider themselves as business consultants and understand that long-term relationships are not built for selling products, but rather delivering solutions.
The new unified alerting system for Grafana: Everything you need to know
Alerting is the part of the Grafana open source project that has received the most requests for features and improvements. For some time now, the changes have been minimal, but we’ve been listening to the community. With Grafana 8, our investment in alerting is here.
Application Monitoring 101: How to monitor your organization's usage across projects with Org Stats
Application Monitoring 101: How create Custom Dashboards (deep-dive)
Application Monitoring 101: How to gain a better understanding of your endpoints using Trace View
SolarWinds Orion Modern Dashboards Overview
Rollbar Integrations: Okta
LDAP authentication with Sensu Go: troubleshooting & tips (Part 2)
Sensu creator and Developer Advocate Todd Campbell recently wrote about using LDAP authentication for single-sign on (SSO) with Sensu Go. That post provided a great overview of Sensu authentication and included some useful LDAP troubleshooting tips. In this post, we'll focus on the Sensu LDAP implementation and explore how SSO/LDAP users are linked to RBAC "profiles" (i.e. Roles and ClusterRoles). We'll also demonstrate how Sensu supports multiple LDAP providers thanks to its groups_prefix feature.
How to Debug Race Conditions Between Threads in Java
How many days off have been marred by debugging race conditions and deadlocks in complex multithreaded, Java code? You’ve probably vowed, Never again and embarked on a quest to always catch race condition errors early by writing tests and debugging. Multithreaded applications are a great way to improve performance, but they also make routine tasks like debugging a little more complicated.
3 Work-From-Anywhere IT Security Pressures
BCD Travel Selects Exoprise for Microsoft 365 Digital Experience Monitoring
Waltham, MA - June 10, 2021 - Exoprise, a leading provider of Digital Experience Monitoring (DEM) solution for Microsoft 365, today announced that BCD Travel, a provider of global corporate travel management services, has selected Exoprise to help the company achieve end-to-end visibility of critical Microsoft 365 SaaS application performance to enhance the digital experience, collaboration, and productivity of a large remote workforce.
Monitor your cloud architecture and app dependencies with Datadog NPM
Migrating your on-prem infrastructure to the cloud offers a host of benefits, including scalability, mobility, security, and cost reduction. When it comes to cloud network monitoring, tracking the availability and performance of the cloud services your applications rely on becomes even more important. However, moving from self-managed infrastructure to third party–managed services introduces a number of challenges.
OpenSearch FAQ: What is OpenSearch?
OpenSearch has been a buzz in DevOps over the first half of 2021. The project is moving forward, but understandably there are a lot of questions. This article will address some of those frequently asked questions, and will be updated to address more over time.
Get to Know the Uptime.com Github
Uptime.com maintains a Github, which we update with important and useful resources for those seeking a command-line approach to Uptime.com. We also house important files there for users of our private location probe servers. When you want to use our REST API, and you need help getting started, our Github is a good place to begin. Access our Github here. Today, we want to introduce you to our project, discuss why we chose Github, and share what we hope to accomplish in the future.
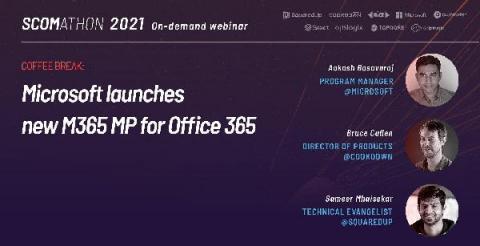
New Microsoft M365 Management Pack for SCOM
Microsoft have announced a new management pack for Office 365 – M365! It completely replaces the Office 365 management pack and is packed with new capabilities. Aakash Basavaraj, Program Manager at Microsoft, and Sameer Mhaisekar, Technical Evangelist at SquaredUp, joined Bruce Cullen, Director of Products at Cookdown, to reveal the new capabilities of the M365 management pack and the accompanying dashboard pack created for SquaredUp.
Dashboard Server: Working with the Azure Tile
SquaredUp, Technical Evangelist In this part of the Dashboard Server Learning Path, let’s take a look at the Azure tile. This tile will allow you to connect to and query App Insights and Log Analytics workspaces using Kusto Query Language( KQL), which offers features such as sorting, projection and calculated values, which we can use to control the display of data in our dashboard. If you are new to KQL, We have a series of blogs that can help you get started.
Website speed optimization techniques with Sematext
Graylog and Sysmon
Making CI/CD Work with Serverless
AIOps Strategy and Management
In an earlier blog, I provided an introduction to AIOps. AIOps is the application of Artificial Intelligence to IT Operations. Many people misunderstand AIOps as replacing or mimicking human intelligence. This is not what AIOps is about. Rather, AIOps seeks to apply algorithms to solve specific problems, often much faster, much more accurately, and at much higher scale than a human ever could solve the problem.
Get Ready For Industry 5.0: How Enterprises Are Relieving Digital Pressure in the Age of Seamless Connectivity
From connected factories to smart fleet management, technology is driving a new industrial revolution. To stay competitive, industrial enterprises are building on the efficiency gains delivered by automation and other pillars of Industry 4.0 to adopt more advanced digital solutions for smarter, faster working.
How to Avoid Domain Hijacking
After you register the domain for your website, you might take pride in owning your company’s online address. However, from a legal standpoint, you don’t own it. While you can register it, thieves can hijack it from you. Domain hijacking does not receive a lot of attention, but it is a real threat. Domain hijacking is also very frustrating, as it is relatively easy for thieves to hijack a domain, and once they get control, it can be very difficult and expensive to regain it.
How to monitor and optimize Core Web Vitals
5 key challenges in CPU temperature monitoring and how to overcome them
Fluctuations in CPU temperature contribute to a considerable amount of network downtime and lead to network performance deterioration. When the CPU gets overheated, network devices slow down or even shut off; it also affects the performance of other network devices and causes an unpleasant user experience. CPU over utilization is not only a problem in itself but is also an indication of several other issues.
Monitor AWS control plane API usage metrics in Datadog
AWS Service Quotas helps you manage limits on the number of resources or API operations that are possible for a given AWS service. Hitting such limits could cause operational disruptions related to getting rate limited on the critical APIs that your applications rely on or being unable to provision additional AWS resources.
Connect SCOM to just about anywhere with an API, using Cookdown's new Connection Center
GrafanaCONline Day 2 recap: Grafana 8 deep dive, Prometheus innovation, a billion time series at Robinhood, and more
GrafanaCONline 2021 is off to a great start! Tune in live (for free!) or sign up to get notified about on-demand access to all the session recordings, which will be available after GrafanaCONline ends. If you didn’t get a chance to watch yesterday’s presentations, here’s what you missed on Day 2 of the conference.
Google PageSpeed Insights: Everything You Need To Score 100/100
Tools like Google PageSpeed Insights lets developers, site owners, and webmasters gauge and understand their website’s performance. The speed of your website is an essential and most crucial factor responsible for its overall growth and success. Once you build your website to optimize and build its conversion rate, speed plays an important role.
Going Beyond RMM for the Next Level of IT Service Management
The IT services industry has continued to grow in the backdrop of high demand for innovative solutions across all industries. Global spending will surpass $1.1 trillion in 2021, which reflects a 9% increase from 2020. Managed services account for much of this spending with managed service providers (MSP) at the heart of the impressive growth.
Sentry Application Monitoring for Next.js
As you could probably tell from the title, we shipped an SDK for Next.js. This means you can capture errors, measure performance, manage releases, configure suspect commits, and automatically upload sourcemaps to view unminified JavaScript and TypeScript with zero(-ish) configuration. Why was Next.js next on our list? Well, it’s one of the fastest-growing React frameworks and developers love it.
HTML vs HTML5: Learn the Difference Between Them
Hypertext Markup Language (HTML) is the basic language for creating websites. Since its introduction in the late 1980s, HTML, like anything else in the tech world, has grown tremendously. Many that are new to coding should become acquainted with HTML5, the most recent version. However, having a detailed understanding of the language's evolution will provide insight into the past, current, and future of web creation for both new and experienced coders.
Autoscaling AppOptics With Apache Deployed in K8s Pods
Smartsheet's SRE Team Takes Center Stage As It Hits The 8M User Mark
Smartsheet was founded in 2005 with the mission of helping companies simplify and streamline how work is managed. Over three quarters of the Fortune 500 rely on Smartsheet. Through its enterprise platform for dynamic work, the platform aligns people and technology to help businesses move faster, drive innovation, and achieve more.
Icinga for Windows: Hyper-V and Cluster Plugin Release v1.0
After months of developing and testing, we are finally ready to announce the release of our Icinga for Windows Hyper-V and Cluster plugins version v1.0 today! We collected lots of feedback, tested different approaches and re-designed some plugins to ensure we can provide good monitoring basics for these environments, allowing us to improve and extend them in the future.
How we added custom languages, code completion and highlighting to the Monaco editor
We've recently launched a brand new in-browser editor for our browser check creation experience! Browser checks are Javascript-powered Playwright/Puppeteer scripts that run on deploy or on a schedule for testing and monitoring websites and web apps. While this new experience centers around an upgraded text editor, it is much more than just that.The new browser check creation experience builds on the popular Monaco editor from Microsoft, which also powers VS Code under the hood.
A New Approach to Metrics
Today at o11ycon+hnycon—right now, actually, if you’re reading this blog when it was posted—we’re announcing several new Honeycomb features during the keynote. Our industry and community have come a long way since we burst onto the scene, and I’m delighted to give you another version of Honeycomb that continues to demonstrate what’s possible with observability. And it includes metrics.
Is Real-Time Processing Worth It For Your Analytical Use Cases?
Real-time processing provides a notable advantage over batch processing — data becomes available to consumers faster. In the traditional ETL, you would not be able to analyze events from today until tomorrow’s nightly jobs would finish. These days, many businesses rely on data being available within minutes, seconds, or even milliseconds. With streaming technologies, we no longer need to wait for scheduled batch jobs to see new data events.
What the Fastly Outage Can Teach Us About Observability
On Tuesday June 8th, the Content Delivery Network Fastly experienced an outage that made large swaths of the web unavailable for nearly an hour. To focus on the positive, this outage can serve as a wakeup call for Observability teams, because it shows how much modern sites depend on resources beyond their immediate control, and how hard it is to "observe" these kinds of issues with an incomplete Observability mindset.
CMMC Compliance Made Easy with Sumo Logic
2021 Benchmark Report | Log Management and Analytics
Website Issues Slowing Down Your Page Speed
While many statistics are floating around the web, let's consider slow page speeds from a more personal viewpoint. How many times have you waited for a web page to load, then felt frustration, anger, or even desperation as it crawled? In addition, the experience may have even given you a negative impression of the website, possibly to the extent you never want to load it again. With over 1.8 billion websites in existence, slow websites are very likely to lose precious visitor traffic.
Key JVM Metrics to Monitor for Peak Java Application Performance
Monitoring is crucial if you want to see what happens in your system and JVM-based applications are not different. Well, some metrics, like memory and garbage collection, require special attention because they play a major role in your application performance. In this blog post, we will look into the key Java Virtual Machine (JVM) metrics that you should monitor if you care about performance and stability. Those are the memory, the garbage collection, and the JVM threads.
Dashboard Server: Working with the ServiceNow tile
SquaredUp, Technical Evangelist This should be a quick one. As some of the existing SquaredUp customers might recognize, this tile is basically an enhanced version of the more generic WebAPI tile – with the enhancement being easy authentication. In comparison to the <
Datadog vs Atatus
Today every problem has a solution that evolved into powerful software troubleshooting and performance analytics capable of analysing and deconstructing the entire application for issues and bugs. Since most web offerings monitored these days are multi-tiered applications, Datadog and Atatus are leading APM software in this category.
Elastic beats Beats Users with a Breaking Change
Last week Elastic.co started locking down its Beats OSS shippers such that they will not be able to send data to Elasticsearch 7.10 or earlier open source distros, or Non-Elastic distros of Elasticsearch. If you weren’t watching closely this might have slipped under your radar. Embedded within the Beats 7.13 minor release that was published over the weekend, a release note advised of a breaking change in which “Beats may not be sending data to some distributions of Elasticsearch”.
What the Fastly outage can teach us about writing error messages
In case you missed it, for about 15 minutes on June 8, 2021, Fastly's CDN had an outage, taking some of the internet's largest websites down (including the BBC, UK government, Reddit, and the New York Times - Amazon.com also had its CSS fail to load).
HTTP(S) Check Upgrade | HTTP(S) Monitoring Improvements from Uptime.com
Our bread and butter is checking for uptime, and we always recommend users begin their monitoring with the HTTP(S) check. We call it a basic check type, but its functionality is boosted when you start exploring optional parameters. The Uptime.com HTTP(S) check can do a lot more than check for server status 200 OK.
Grafana Tempo is now GA with the release of v1.0
It’s exciting to see a project that you’ve poured so much time into progress at the rate Tempo has. Tempo is not the first piece of software I have shepherded from the very first line of code to a production release, but it is the first large-scale open source project I have led. Working with a community that is able to use and improve your software as a community is a powerful thing.
GrafanaCONline Day 1 recap: Grafana 8, Tempo GA, machine learning, ISS, and more!
GrafanaCONline 2021 is live! Join us over the next two weeks for more than 30 virtual sessions, ranging from demos of the new Grafana 8.0 release and technical deep dives around Grafana, Prometheus, Loki, and Tempo to insider looks at how companies are leveraging Grafana in observability, IoT, science, and business intelligence. GrafanaCONline 2021 runs through June 17.
Multi-Project Cloud Monitoring made easier
Customers need scale and flexibility from their cloud and this extends into supporting services such as monitoring and logging. Google Cloud’s Monitoring and Logging observability services are built on the same platforms used by all of Google that handle over 16 million metrics queries per second, 2.5 exabytes of logs per month, and over 14 quadrillion metric points on disk, as of 2020.
Performance, Stress, and Load Tests in Rails
Tests are an integral part of most well-working Rails applications where maintenance isn’t a nightmare and new features are consistently added, or existing ones are improved. Unfortunately, for many applications, a production environment is where they are put under heavy workload or significant traffic for the first time. This is understandable as such tests are costly.
How to Correctly Frame and Calculate Latency SLOs
As more companies transform into service-centric, “always on” environments, they are implementing Site Reliability Engineering (SRE) principles like Service Level Objectives (SLOs). SLOs are an agreement on an acceptable level of availability and performance and are key to helping engineers properly balance risk and innovation.
There's More Than One Way to Monitor Database Performance - SolarWinds Lab Episode #96
InfluxDB IOx Tech Talks: Performance Profiling in Rust
How to monitor Digital Ocean
Scale your business faster while ensuring reliability with Sumo Logic and NGINX
Getting Maximum Performance From Always On Availability Groups
Understanding Serverless Observability
Ideally, observability should help you understand the state of your application and how it performs under different circumstances. However, while serverless observability may seem similar to serverless monitoring and testing, the three achieve different goals. Testing helps you check your application for known issues, and monitoring helps you evaluate system health according to known metrics. Observability helps you search and discover unknown issues, providing end-to-end visibility.
How South Dakota Bureau of Information and Telecommunications deploys Elastic to secure endpoints
The South Dakota Bureau of Information and Telecommunications (BIT) provides quality customer services and partnerships to ensure South Dakota’s IT organization is responsive, reliable, and well-aligned to support the state government’s business needs. The BIT believes that “People should be online, not waiting in line.” The bureau’s goals for the state's 885,000 residents include.
How to Monitor Application Logs
Monitor Azure using Applications Manager
Microsoft Azure is the fastest growing cloud platform at the moment. Many organizations use Microsoft Azure to quickly build and deliver cloud services that can scale or to migrate existing workloads to the cloud. However, larger and faster cloud services can quickly increase the complexity of a network. To solve this and ensure business-critical workloads run correctly, IT teams need deep visibility into their Azure environments.
BCD Travel Selects Exoprise For Microsoft Office 365 Monitoring
Headquartered in the Netherlands, BCD Travel manages global business travel. It operates in 109 countries with annual revenues totaling $25 billion and employs nearly 11,000 people worldwide. To meet the current and future needs of a growing virtual workforce, the Network Operations Center (NOC) group at BCD Travel had to adapt and scale its IT infrastructure operations. Additional capabilities were needed to monitor Microsoft 365, Azure, Active Directory, AWS, Teams, and other critical SaaS services.
8 Best Practices for Windows Patch Management
Given the numerous cyber-threats that organizations face these days, security has become one of the most serious issues on everyone’s mind. When it comes to protecting business-critical environments from malware, various security measures can make a significant difference. Patching is one such important component of ensuring the security of your infrastructure and data.
Grafana 8.0: Unified Grafana and Prometheus alerts, live streaming, new visualizations, and more!
Another GrafanaCON(line), another major release! And as I shared in the opening keynote today, Grafana 8.0 is the biggest, baddest release yet!
GrafanaCONline 2021: Your guide to the newest announcements from Grafana Labs
In addition to all the great talks from community members about their use cases, GrafanaCONline 2021 will include a number of sessions with the Grafana team about the latest features and use cases for Grafana. Throughout the week, we’ll continue to unveil new features, go deeper with live demos, and share our plans about the future of Grafana.
Unified Observability: A Business-Centric View
Here at LogicMonitor, we’re on a mission to build the most comprehensive, extensible, and intelligent monitoring and observability platform in the world to help businesses run seamlessly. We’ve spent more than a decade building a best-in-class monitoring platform. Over the past two years, however, we have further evolved our platform to deliver invaluable end-to-end observability across applications, networks, and infrastructure for companies of all sizes and in a variety of industries.
Better Alerts [as in, far more specific and just generally way better]
A couple of weeks back, we broke sign-ups. And in the most meta fashion, we learned about this because someone here had the foresight to set up an alert in Sentry to notify us if sign-ups dropped to zero. Getting alerted kicked off our incident response process. A team was formed to tackle “What broke?”, “How do we fix this?”, “How long has this been happening?”, “Are any other services impacted?”, and much more.
Rollbar Academy: Rollbar Analytics
Add an action to log messages to Papertrail
Incident Review - Fastly Outage Impacts Major Websites Worldwide
On June 8, 2021, many of us were left staring at blank screens or “Service Unavailable” errors when trying to access the internet. The panic was shared by millions of people around the world. Everything from Spotify, Amazon, and Reddit to Vimeo, Twitch, and Pinterest was inaccessible to users. This major outage that impacted any service using Fastly. Here is a quick rundown of what happened and why.
Dashbird app launches new version
The new Dashbird app is bringing your data together for a faster, more secure, and smoother observability experience with team collaboration in mind. The enhanced version of the Dashbird app is making your account more secure and your app navigation and data exploration faster, more intuitive, and all-around enjoyable. Additionally, you can now enable multi-factor authentication (MFA) for your Dashbird account. Check it out now!
Monitoring Kafka Performance with Splunk
Today’s business is powered by data. Success in the digital world depends on how quickly data can be collected, analyzed and acted upon. The faster the speed of data-driven insights, the more agile and responsive a business can become. Apache Kafka has emerged as a popular open-source stream-processing solution for collecting, storing, processing and analyzing data at scale.
Collecting Kafka Performance Metrics with OpenTelemetry
In a previous blog post, "Monitoring Kafka Performance with Splunk," we discussed key performance metrics to monitor different components in Kafka. This blog is focused on how to collect and monitor Kafka performance metrics with Splunk Infrastructure Monitoring using OpenTelemetry, a vendor-neutral and open framework to export telemetry data. In this step-by-step getting-started blog, we will.
3 Ways to Use Auvik APIs for External Reporting
Ensure Cloud Security With These Key Metrics
The More You Monitor: Using AIOps for Monitoring
Monitor key metrics and visitor demographics in NGINX with the new Grafana Cloud integration
We are happy to announce that the NGINX integration is available for Grafana Cloud, our composable observability platform bringing together metrics, logs, and traces with Grafana.
You Can Now Use observIQ Completely Free
Today, we’re excited to announce a new completely free pricing tier for observIQ: the 3-day free plan. With the observIQ free plan, you can ingest and index up to 3 gigabytes of logs per day with a 3 day rolling retention period.
The Chase
Alert Stalking
Classic Event Viewer Retires
AIOps 101
In all internal and external conversations that I’ve had in the recent weeks, almost always the discussion veers towards AIOps. This blog summarizes research that I’ve done into understanding AIOps – what it is, why analysts and customers are so interested in this technology and what are some of the benefits that it offers.
Introduction to NoSQL
NoSQL is a database management system that exists as an antithesis to SQL, in that it doesn’t store data in a relational model. As such, data can essentially be stored as anything, in any way a developer chooses, within reason of course. This flexibility comes from the fact that NoSQL doesn’t require a schema in the same way that SQL does.
Two Quick Ways to Create Spans with Kamon Telemetry
If you already had some experience with Kamon, you probably saw Kamon create Spans automatically for a lot of stuff, including HTTP server requests, database calls, actor messages, and more. But what happens when you want to create Spans for methods or code blocks that Kamon doesn’t instrument automatically? Let’s look at the two simplest ways to create Spans programmatically with Kamon.
Panel Discussion: Troubleshooting in Fast-Paced Environments
SCOM Connector for Microsoft Teams
How IT Investment Will Be Revolutionized in 2021
Publishing & Securing Legacy Applications
In the previous blog post, we discussed load balancing essentials and methods of traffic distribution among the real servers. When you publish an application with Kemp LoadMaster you can add lots of extra capabilities on top of the basic load balancing. In this post we’re going to look at ways of securely publishing legacy applications using the LoadMaster Edge Security Pack (ESP) and SSL Acceleration features.
Key differences: Dashboard Server vs. SquaredUp for SCOM/Azure
If you’ve checked out SquaredUp for SCOM/Azure and decided for one reason or another that it wasn’t the right tool for you, you are in for a treat! Our latest free tool, Dashboard Server, addresses many of the same pain points, but this time, for a variety of platforms not tied to SCOM or Azure. On the flip side, if you’re currently using SquaredUp for SCOM/Azure, don’t click away!
Top 7 AppDynamics Competitors and Alternatives to Try in 2021
AppDynamics was founded by Jyoti Bansal in 2008. It is an application performance management (APM) and IT operations analytics (ITOA) company that focuses on managing application performance and availability in a cloud computing environment and inside the data centre.
What is IaaS? How IaaS Different from SaaS and PaaS?
The cloud is a hot topic for everyone from small companies to multinational corporations, but it's also a vast term that covers a lot of online ground. It's more important than ever to appreciate the differences and benefits of the different cloud providers when you consider moving your company to the cloud, whether for application or infrastructure deployment. Infrastructure-as-a-service (IaaS) is a cloud-based service that provides virtualized computing resources to businesses over the internet.
Datadog on Chaos Engineering
Lookup Tables and Integration with MISP
Anomaly Detection on Observability Data using Machine Learning
Build a CircleCI Dashboard to visualize all your CI/CD data
If you’ve checked out SquaredUp for SCOM/Azure and decided for one reason or another that it wasn’t the right tool for you, you are in for a treat! Our latest free tool, Dashboard Server, addresses many of the same pain points, but this time, for a variety of platforms not tied to SCOM or Azure. On the flip side, if you’re currently using SquaredUp for SCOM/Azure, don’t click away!
Using Elastic for Root Cause Analysis
How to Measure Network Performance: 5 Network Metrics
As more companies continue to rely on SaaS and cloud applications to run their businesses, it becomes important for them to ensure their network infrastructures can withstand the demand, and that they’re able to offer their services quickly and reliably. Continuous network monitoring can help you ensure that your network is always performing at its highest level. So, we’re running you through exactly how to measure network performance, and what network metrics you should be looking at.
Error logging, tracing, and improving developer workflow with Jeffrey T. Fritz
Azure Monitor for Windows Virtual Desktop (WVD)
At the end of March 2021, Microsoft released Azure Monitor for Windows Virtual Desktop (WVD) for General Availability. Built upon Azure Monitor Workbooks to give insights into the Windows Virtual Desktop environment, including: Connection Diagnostics, Connection Performance, Host Diagnostics, Host Performance, Utilizations, Users, Clients and Alerts.
Good Catch: Partner Monitoring
Operating in today’s digital economy often involves dealing with an extensive network of third-party providers and partners. Common types of partner networks include affiliates, vendors, suppliers, marketing platforms, and payment gateway providers. Partner networks involve tracking and analyzing data from multiple providers, each of which creates thousands of metrics and billions of events each day.
Build resilience into your HFC network with zero touch monitoring
Hybrid Fiber Coaxial (HFC) networks are inherently agile and able to adapt to demand spikes. This significant characteristic was most recently demonstrated by their success in handling pandemic-induced traffic surges.
Application Monitor: Checking Everything that Matters
Application monitor solutions are not novel but rather an evolutionary technology. These types of solutions answer the problems that most developers and DevOps teams encounter when building an application. Application monitor solutions help determine potential defects so developers can take corrective actions quickly. Hence, building an application is no longer complete without application performance monitoring (APM) solutions.
Does Thinking Still Count As Working?
Best 7 Monitoring Tools for Node.js Application
Sometimes, applications do not perform as well as they should. Application developers are responsible for performing preventive and curative maintenance. Customers that use your application as a developer may waste a lot of money attempting to restore the applications without your help. To maintain track of your application's activities, it's best to use an effective monitoring system. Monitoring a Node.js application entails keeping a careful eye on its performance and availability.
SMTP Ports (25, 587, 465, or 2525) - What is SMTP Port? How to Choose the Best and Right SMTP Port?
It can be difficult to choose an SMTP port. When we set up the Simple Mail Transfer Protocol SMTP Server, the first question that comes to mind is this. Which port is the best for SMTP connections? There are a variety of ports to choose from, but which one should you use? Allow me to take you on a journey through the history of each port. It will give you a good understanding of all of the ports, and then we'll talk about which one is optimal for SMTP connections.
New Relic vs Atatus
Application Performance Monitoring (APM) is used to ensure consistent availability, performance, and response times of an application. Websites, mobile applications, and business applications have use cases for monitoring purposes. Although, in the digital world, monitoring use cases expand to the processes, hosts, logs, networks, and end-users including your customers and employees.
How to receive alerts in Slack with Pandora FMS
Prometheus vs. Datadog: Which is Right for your Business?
Deployment of an application is a significant step for any business. The quicker and better updates you can give to your users, the faster it will be for you to fix issues and introduce new features. With more immediate updates for your application, it is also important to handle the application’s bugs and issues and monitor them. As an entrepreneur, it will require a lot of effort and time, and sometimes it does not even appear to pay off.
How to Send A Graylog Alert to Discord
Visualize Humio logs alongside your other data sources in Grafana Cloud with the new plugin for Grafana
Being able to get the big picture and immediately pivot between siloed data is one of the key values Grafana Cloud provides. Our composable observability platform integrates Prometheus and Graphite metrics, Loki logs, and Tempo traces with Grafana — and also allows you to draw data in from other sources of your choice concurrently.
Writing My First OpenSearch Plugin
Personally, I’ve always wanted to contribute to an open-source project, but never found a way to incorporate it with my day-to-day work. Occasionally, I’d muster up the courage to clone a project I liked, seeking a good entry point to add some new feature or handle some issue. I thought that all I needed was to make a small contribution and everything else would just flow into place.
SolarWinds DBA xPress Free Tool Overview
OpenSearch: The Open Source Successor of Elasticsearch
What an exciting episode of OpenObservability Talks it was! On May 27, I hosted Kyle Davis, Senior Developer Advocate for OpenSearch at AWS, for a chat about the OpenSearch project, where it stands and where it’s heading. I wanted to share with you some interesting insights from our chat. You’re more than welcome to check out the full episode.
Announcing Our Expanded Database Solutions Portfolio - Designed to Improve the Lives of Database Professionals
Bring your own CI/CD.
As a developer I couldn’t imagine working without one of these three things. For projects on GitHub the built-in actions should do the latter job fine in most cases. But as everything else they have limits. The more PRs, the more different tests per pull request and the longer those tests run, the longer different PRs have to wait for each other for the continuous integration to run.
Debugging with Dashbird: Resolving the Most Common API Gateway Request Errors
Adding an API Gateway to your application is a good way to centralize some work you usually have to do for all of your API routes, like authentication or validation. But like every software system, it comes with its own problems. Solving errors in the cloud isn’t always straightforward, and API Gateway isn’t an exception. AWS API Gateway is an HTTP gateway, and as such, it uses the well-known HTTP status codes to convey its errors to you.
SolarWinds Aims to Be Data Pros' First Choice for Database Performance Management, Expands Comprehensive Portfolio With Addition of New Database Insights for SQL Server Solution
Best Site Builders for Linux
Introducing native support for Core Web Vitals
In December last year, we released tracking for Core Web Vitals using custom tagging so that you can have consolidated performance metrics that accurately reflect your customer's digital experience. Today, we are excited to continue this journey and announce our native first-class support for Core Web Vitals (CWV) tracking within Real User Monitoring. Now, you can see a detailed overview of how your website performs against Google's modern user-centric metrics, alongside all the diagnostics you need to take action.
Our first community update - Signal #01
Excited to launch our first newsletter. We are delighted to have crossed 1.6k stars on GitHub, growing more than 30% last month. Catch up on what we're upto at SigNoz!
Uptime Monitoring: A One-week Project, a Decade In the Making
We recently released uptime monitoring, a pretty big addition to our set of features. Our customers have often requested it, and it was a logical next step for us to add uptime monitoring to our app. In today’s post, we’ll explain how we went from considering uptime monitoring impossible to build, to building it in a week. We’ll break down how seemingly over-engineering can really pay off in the end.
Investigating Network Anomalies - A sample workflow
Network anomalies vary in nature. While some of them are easy to understand at first sight, there are anomalies that require investigation before a resolution can be made. The MITRE ATT&CK framework introduced in Kemp Flowmon ADS 11.3 streamlines the analysis process and gives security analyst additional insight by leveraging knowledge of adversaries' techniques explaining network anomalies via the ATT&CK framework point of view.
How to build a team that demands metrics
When we talk about metrics in software delivery, a lot of developers think of execution metrics — things like throughput, delivery and number of deploys. But in reality, those metrics don’t motivate anyone — at least not without connecting them to a bigger picture. I’ve worked in software for 23 years. I’m a three-time founder and four-time CTO, responsible for leading a 200+ member distributed engineering organization.
SolarWinds Database Mapper Overview
Getting to know Kibana
This Month in Datadog: May 2021 (Episode 1)
Increase Efficiency with an IT Command Center: N-able Passportal and Auvik
How to Troubleshoot Network Issues-Guide and Recommended Tools
Do You Need an Alert for Your Alerts? Building Smarter Monitoring Systems
That One Time Using APM Bit Us
At Catchpoint, our mission is to provide customers with actionable data that will help them reduce MTTR and maintain a positive digital experience. We measure "from where the users are" to ensure the data reflects real end-user experience. As someone that's part of the Catchpoint on-call chain, this is extremely important to me. I do not want to be woken up at 2 AM because a server is misbehaving, only to find out that the application failed over gracefully and no users were impacted.
Releasing Icinga for Windows v1.5.0
After weeks of rewriting the core aspect of Icinga for Windows – executing checks – we are happy to announce version 1.5.0 today. Why we changed the check handling? We are glad you asked and happy to share the new features!
Cerner depends on Elastic machine learning for a healthy infrastructure
Cerner Corp. is a supplier of healthcare information technology systems, services, and devices. The company, with $5.7 billion in annual revenue, empowers people and communities to engage in their own care. A key aspect of the business is surfacing data to enable their clients to make informed decisions about their healthcare. The 29,000 Cerner employees in 30 countries are on a mission to shape the healthcare of tomorrow.
Introducing Sensu
Sensu to be acquired by Sumo Logic
I am excited to announce that Sensu has entered into an agreement to be acquired by Sumo Logic (Nasdaq: SUMO), the pioneer in continuous intelligence. The acquisition will complement Sensu’s observability strategy by providing customers with a mature and comprehensive Observability Suite including log management, observability data platform, analytics, visualizations, and more.
Kudos, You've Earned a Digital Experience Monitoring Reward!
Digital experience has existed for a while now. We have now begun to scratch the surface to measure it. So that calls for Digital Experience Monitoring (DEM). DEM extends Application Performance Monitoring (APM) and Network Performance Management (NPM) to view and optimize application performance issues from the end-user perspective.
How to Monitor ALL of Microsoft 365
Only Exoprise provides full coverage for synthetic monitoring of the entire Microsoft 365 suite. The use of 8-10 different synthetic sensors per site provides customers and prospects with an ideal start. These site locations may include corporate headquarters, branch offices, or work from home settings with knowledge workers. Exoprise effectively monitors the health, availability, and performance of applications such as Azure AD, Exchange Online, Teams, Yammer, OneDrive, Outlook, Portal, etc. via synthetic sensors and captures real-time metric data in CloudReady.
How to Use Event Triggers For Windows Server Monitoring
Windows event logs and event triggers are an important part of Windows server monitoring. With the addition Event Viewer feature, Windows made it possible for server administrators to create custom tasks for certain events. This would be the so-called event trigger, and it could be a script or an email notification. This feature is highly important in terms of security and proactively dealing with issues with the server.
Track Digital Transformation Progress with Real-Time Data
According to a McKinsey study, 70 percent of digital transformation projects fail. It’s quite a paradox because the transformation is happening for growth and success. If this stat alone is anything to go by, it indicates that enterprises need to rethink their strategy and management of such transformations. So how are those other 30 percent of enterprises succeeding with their digital overhauls? Well, data and analytics play a vital role in helping track the progress of the process.
Monitoring Memory Usage for Erlang and Elixir Applications
In this post, we’ll do a quick overview of monitoring memory issues in Erlang and Elixir setups. We’ll do so by monitoring memory usage at three levels: Host, OS, and within the Erlang VM.
Why Are SaaS Observability Tools So Far Behind?
Salesforce was the first of many SaaS-based companies to succeed and see massive growth. Since they first started out in 1999, Software-as-a-Service (SaaS) tools have taken the IT sector and, well the world, by storm. For one, they mitigate bloatware by moving applications from the client’s computer to the cloud. Plus, the sheer ease of use brought by cloud-based, plug-and-play software solutions has transformed all sorts of sectors.
Dotcom-Monitor Device Manager
Tour of Graylog v4.0
Planning Center: Simplifying observability and reducing MTTR in a serverless world, with Datadog
Monitor and alert on essential RabbitMQ cluster metrics with the new Grafana Cloud integration
We are happy to announce that the RabbitMQ integration is available for Grafana Cloud, our composable observability platform bringing together metrics, logs, and traces with Grafana. RabbitMQ is one of the most popular open source message brokers, used worldwide at both small startups and large enterprises. It is easy to deploy on premises and in the cloud, and supports multiple messaging protocols.
SolarWinds Database Management Solutions
Google Cloud, Vodafone and Datadog SRE Panel Webinar
Observability From the Application to the Edge
Observability is a buzzword right now. Rightly so, as many companies are greatly concerned about what’s happening with their systems. Every company has become a software company and if they aren’t, they are being disrupted by one. IT leaders have more weight on their shoulders than ever before and it’s because digitization is rapidly changing the way people consume nearly everything.
What is Prometheus rate?
Prometheus was originally developed in 2012 and has grown in popularity since then. It's an open-source systems toolkit that monitors and alerts. While it was developed for SoundCloud, the project is now independent and standalone. Why would you need this model? It comes with several features, but perhaps the most important ones are the fact that it offers multiple graphing modes, dashboard support, and does not rely on distributed storage. Instead, it uses autonomous single server nodes.
What Is PromQL?
PromQL is a functional query language that’s meant for use with the Prometheus monitoring tool. In fact, PromQL is short for “Prometheus Query Language.” The point of this language is to make it easy for users to choose and collect time-series data in Prometheus, which can then be displayed in a graph or as tabular data in the browser for this tool. Get a free trial with MetricFire and start visualizing your data.
Google Authenticator and Pandora FMS, defend yourself from cyberattacks
For a long time, the Internet has been an easily accessible place for most people around the world, full of information, fun, and in general, it is an almost indispensable tool for most companies, if not all, and very useful in many other areas, such as education, administration, etc. But, since evil is a latent quality in the human being, this useful tool has also become a double-edged sword.
AWS Kinesis vs SNS vs SQS (with Python examples)
How to choose a decoupling service that suits your use case? In this article we’ll take you though some comparisons between AWS services – Kinesis vs SNS vs SQS – that allow you to decouple sending and receiving data. We’ll show you examples using Python to help you choose a decoupling service that suits your use case. Decoupling offers a myriad of advantages, but choosing the right tool for the job may be challenging.


