Operations | Monitoring | ITSM | DevOps | Cloud
December 2022
From silos to synergy: Success stories from 2022
Time waits for no one, and the years just seem to fly by. For us at ManageEngine, this year was especially memorable as we turned 20. And, as the best birthday gift ever, you helped us hit the most coveted milestone that many can only dream of achieving. Zoho Corporation, the parent company of ManageEngine, hit $1 billion in revenue earlier this year—and we have only YOU to be thankful for. But, that’s not all.
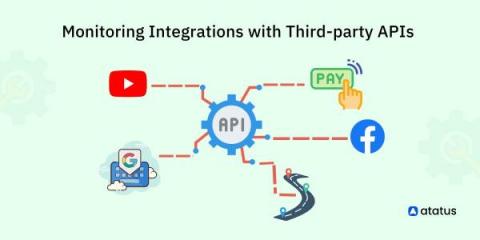
Monitoring Integrations with Third-party APIs
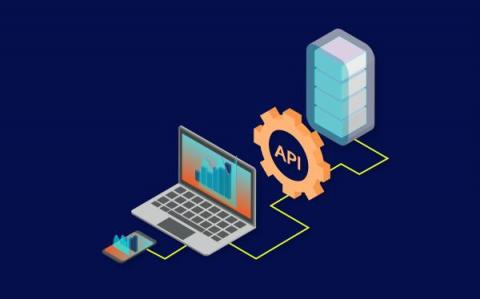
Accessorizing can completely turn around your look. Same way, the apps we make may also feel patchy sometimes, but then, if we bring in third-party resources - such as third-party API integrations, it can drastically enhance our application’s performance. These additional API integrations expand the functionality of your application tremendously, for example, you might add a real-time alerting feature to an analytics tool you built!
Grafana dashboards in 2022: Memorable use cases of the year
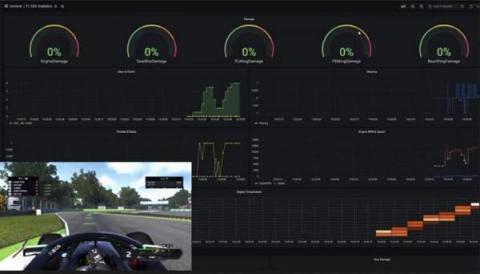
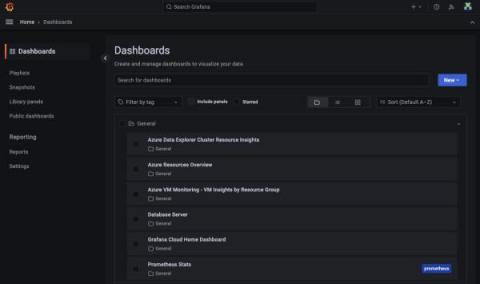
One of our favorite things at Grafana Labs is seeing Grafana dashboards in action. Over the past year, members of the Grafana community — from inside and outside of the company — shared the unique ways they have used dashboards to monitor a wide range of projects including an elderly parent’s home, a Tesla, and a python named Pretzel. Let’s take a look back at some of the eye-catching and informative results.
Grafana Cloud 2022: Year in review
With every new update and feature we introduced to our open source LGTM stack this year, we have also enhanced Grafana Cloud, our hosted offering that is powered by Grafana Loki for logs, Grafana for visualization, Grafana Tempo for traces, and Grafana Mimir for metrics. With Grafana Cloud, “we have curated the open source experience into an easy-to-use, opinionated, and integrated platform,” Grafana Labs VP of Technology Tom Wilkie said in the ObservabilityCON 2022 keynote.
End-of-Year Cleaning for Uptime.com Accounts
A clean home is a clean mind. That means it’s time to audit your Uptime.com accounts and start the new year fresh. We know what you’re thinking, cleaning is tedious and boring, and you’d rather eat pie and take a nap. Yes. We understand. But we also know that cleaning up your accounts can save you from security leaks, increase your productivity, and save you the inevitable hassle of decluttering your accounts in the future. But like we said, we understand the reluctance to do it.
Efficient Help Desk Processes with Centralized Log Management
Another day starting up your laptop or workstation, logging into programs, and waiting for that first call to come in. As an IT help desk analyst, you love when you can solve people’s problems, but sometimes the number of calls feels overwhelming. Although each analyst tier responds to different customer or employee concerns, you all share the same basic job functions like answering calls, asking questions, and research answers.
What Is a Status Page and How Can it Benefit Your Business?
A status page is a great way to provide a real-time overview of your services and their uptime. It can also include any planned maintenance or other important updates to your customers. Better yet, a status page can have a massive impact on your internal processes, save you significant time and money, highlight your credibility, and much more.
Top 9 Website Performance Monitoring Tools in 2023 (Free & Freemium)
It's common for "make sure the website's up" to be one of the first tasks we receive that we can classify as "website monitoring." We can do it for a friend's or relative's business, our website or blog, or employment. Additionally, checking the availability of a website is frequently the first monitoring task that calls for the use of a tool rather than a command. According to IT professionals, most "is it running?" questions can simply be checked. PING and its several variations are used for this.
7 Best Docker Container Monitoring Tools in 2023
Monitoring tools aid DevOps teams in finding and resolving performance issues more quickly. With the popularity of Kubernetes and Docker continuing to grow, it's critical to establish proper container monitoring and log management practices early on. This is no simple task. Docker container monitoring is quite difficult. Creating a strategy and a suitable monitoring system is not at all easy.
How to Configure the OTel Community Demo App to Send Telemetry Data to Coralogix
If you’re just getting familiar with full-stack observability and Coralogix and you want to send us your metrics and traces using the new OpenTelemetry Community Demo Application, this blog is here to help you get started. In this simple, step-by-step guide, you will learn how to get telemetry data produced by the OpenTelemetry Demo Webstore into your Coralogix dashboard using Docker on your local machine.
4 foolproof factors you need to consider for effective IT operations management
According to Gartner, the ITOM market is divided into “three mini-suite categories — delivery automation, experience management, and performance analysis.” With business growth becoming reliant on the success of IT operations, managing IT operations to ensure optimal performance, uninterrupted service delivery, and an exceptional user experience is critical for organizations.
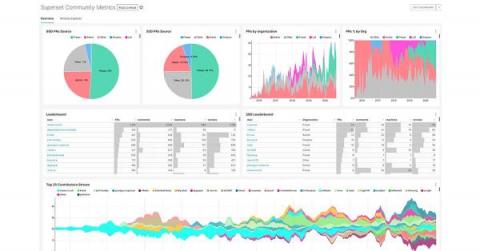
An Introduction to Apache Superset: An Open Source BI solution
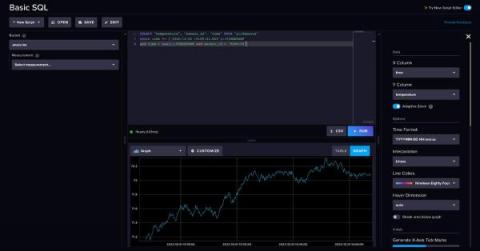
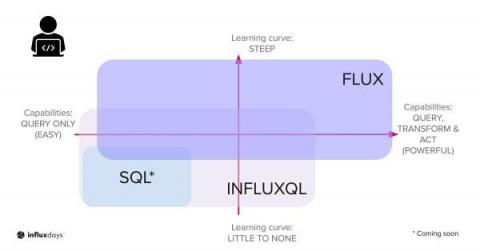
With native SQL support coming to InfluxDB, we can broaden the scope of developer tools used to analyze and visualize our time series data. One of these tools is Apache Superset. So let’s break down the basics of what Superset is, look at its features and benefits, and run a quick demo of Superset in action.
APM Tool Consolidation and Making the Right Choice for Your Business
A business without an application performance monitoring tool runs the risk of losing customers fast. At the core of ensuring the best possible application for their customers is the use of performance tools. The metrics that monitoring tools provide will give an insight into how the web application will behave. With the use of APM tools, DevOps teams know when an issue arises and how to fix it. They also find out what risks are there so they can tackle them before it wreaks havoc in their systems.
What skydiving taught me about automation
Back in the day, before I was a father, before I was a husband, back when I was more of an adrenaline ‘junkie’, one of my ongoing adventures was skydiving. I wouldn’t necessarily call it a hobby as I never followed through with a certification, but I took my fair share of jumps. When I first started I would go with either a ‘static line’, where a cord hanging from the plane would pull my chute, or go on what is called ‘tandem’.
Open source at Grafana Labs in 2022: Year in review
At Grafana Labs, we’re all about open source, and this year we took it to a whole new level. Many of you are familiar with the acronym “LGTM,” which is shorthand for “Looks good to me” and commonly used in code reviews. At Grafana Labs, LGTM has also been a guiding rubric in developing our observability stack.
Applied Observability for Networks Drives Better Business Performance
Even though 2022 hasn’t even ended, Gartner has already charted its top technology trends for 2023. In this blog, we’ll look at how Applied Observability for networks — which Gartner lists as one of the top three trending technology topics in the “optimization” category — helps the organization translate network performance into business performance.
NGINX Logging | Configuring Error and Access Logs, Sending Nginx Logs to Syslog & more
Ingesting and analyzing 2022: an LM Logs success story
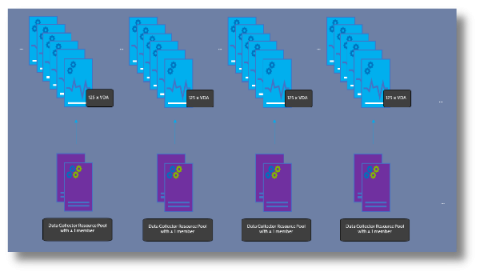
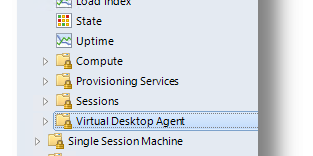
Monitor VDA machines and sessions agentless with SCOM
Every Citrix engineer knows it is quite a burden to install, configure and update monitoring agent software on Citrix VDA machines as this requires you to create and deploy new master images every time you need to deploy a new agent version. While it requires some manual actions, the SCOM platform does natively support monitoring through agentless managed devices which you can onboard with the SCOM discovery wizard.
Helping Go teams implement OpenTelemetry: A new approach
OpenTelemetry (OTel), the emerging industry standard for application observability and distributed tracing across cloud-native and distributed architectures, is becoming an essential tool for Go developers. However, implementing OTel with Go to send data to observability platforms is hardly a straightforward process. At Helios, we’re on a mission to help as many teams as possible adopt distributed tracing.
Six Mistakes Made When Assessing Data Quality
Real User Monitoring (RUM) Is Important for Your Whole Business, Not Just Developers
Real User Monitoring (RUM) is passive website monitoring that has already been used widely for two decades. Large enterprises adopted it first because they had the capital to deploy their own system. But with RUM solutions, like Uptime.com provides, it is affordable for even small businesses. While this is not a new technology, it is new to those businesses that haven’t used it before.
What are SysLog formats? How to use them?
Logs UI | An intuitive UI for Log Management
Logging as a service | Log Management with Open Source
Client logging | Best practices and examples
Metrics For Investigating Network Performance Issues
When the world went remote in March 2020, cloud technologies made work possible. Rapid digital transformation changed everyone’s jobs, whether in-office, remote, or hybrid. Today, your business relies on network speed for everything from productivity to customer service. Keeping your company’s services running means you need to make sure you have low-latency connectivity across data centers, users, and cloud.
A 7-Step Guide to IT Cost Reduction in 2023
Grafana Labs in 2022: Top 10 moments of the year
There are more than a million reasons (and Grafana instances!) that have made 2022 a standout year at Grafana Labs. But here are the top 10 releases, products, company milestones, and major announcements that were off the charts.
5 Networking Trends IT Admins Need to Know for 2023
Perf8: Performance metrics for Python
One tool for all your Python performance tracking needs We're building this neat service in Python to ingest data in Elasticsearch from various sources (MySQL, Network Drive, AWS, etc.) for Enterprise Search. Sucking data from a third-party service to Elasticsearch is usually an I/O-bound activity. Your code sits on opened sockets and passes data from one end to the other. That's a great use case for an asynchronous application in Python, but it needs to be carefully crafted.
A Guide to On-Premises and Cloud-Based Cisco Networks
Creating Charts in Sematext Cloud
Coralogix Makes Observability Collaborative
In the world of observability, there are several distinct problems to solve. Fast queries, intuitive visualizations, scalable storage, and more. The technical problems receive the most attention; however, there is another, more subtle problem. How do observability platforms facilitate collaboration on the scale needed by organizations?
The importance of structured communication in the world of SRE
How you communicate helps build your 9s. In the world of Site Reliability Engineering, this is crucial. How do you do it?
How JMX Monitoring Works for Java Applications
The Java Management Extensions (JMX) framework is a Java technology that includes tools for managing and monitoring applications, system objects, and service-oriented networks. The JMX framework is designed to simplify the management of local and remote Java applications. The JMX framework introduces the concept of MBeans for real-time management of applications, whereby resources are represented by objects called MBeans (Managed Beans).
Six Key Observability Principles for Understanding Modern Applications
The rise of modern applications has kicked basic monitoring tools to the curb. With observability, teams can proactively know, in real-time, what’s happening across the entire stack. Observability allows us to take a holistic view of our IT systems and learn about the current state based on the environment and the data it generates. But how do you properly implement observability? Here are 6 guiding principles to make sure your IT and DevOps teams are set up for success.
Morgan Logger | Tutorial on how to use in an Express application
Launching the CloudFabrix Space Craft into the Orbit!
Tips & Tricks for using Kubernetes
Businesses around the world are increasingly turning to container technology to streamline the process of deploying and managing complex, cloud native applications. Containers bundle all necessary dependencies into a single package, offering portability, speed, security, scalability, and ease of management, making them the preferred choice over traditional virtual machines (VMs).
2022 Year in Review
JSON Logs | Best Practices, benefits, and examples
Applications Manager in 2022: A look back
As we reach the end of the year, many of us are looking back to see how our resolutions for the year 2022 went. Well we don’t know about you, but at Applications Manager, we kept to our resolution to work to deliver the best possible version of our tool. Here’s a look back at 2022 and every milestone we crossed this year.
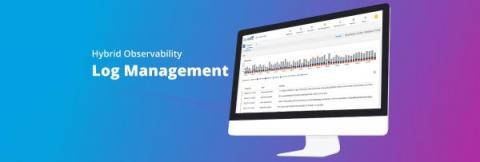
How OpsRamp Log Management Helps You to Find and Fix Issues Faster
OpsRamp has enhanced its hybrid observability capabilities by adding an integrated log management solution to unify log, event and alert data within customers’ monitoring and event management command center. Presenting this log data as part of a unified view of IT performance data and integrating it with remediation capabilities will allow enterprises and service providers to expedite the process of identifying and resolving potential issues before they impact their business operations.
Observability vs. Monitoring
How to install the Site24x7 APM Insight .NET Core agent in Linux
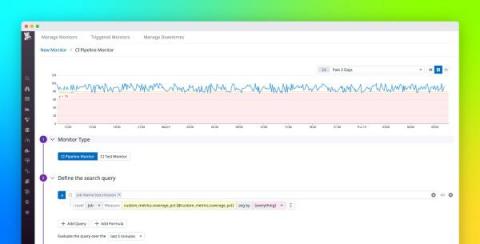
Best practices for continuous testing with Datadog
In Parts 1 and 2, we looked at how you can build and maintain effective test suites. These steps are a key part of ensuring that application workflows function as expected. But how you run your tests is another important point to consider, so in this post, we’ll walk through best practices for executing your tests across every stage of development. Along the way, we’ll also look at how Datadog supports these practices for the applications that you are already monitoring.
Datadog on Building an Event Storage System
Development Trends in 2023: Following KubeCon NA
In November 2022, our team here at Helios attended and sponsored KubeCon North America. Our motivations for being there were related to getting out the word about what Helios is doing to accelerate development velocity through microservices troubleshooting. Here we are at our booth: While there we also caught up with a number of the other folks attending the event. Here are a few of the key takeaways and trends we noticed.
How Monitoring Helps Avoid the Greatest Dangers to Your Website this Holiday Season
The holidays are here. It’s the happiest time of year but also the most dangerous time for your website. This season usually means sales and events, which bring in a surge of website traffic and strains to your systems. If you are not prepared for these changes, your website could pay the price and ultimately damage your business’s reputation and revenue. We want to avoid these catastrophes.
SigNoz - Logs Performance Benchmark
Dashboard Fridays: Sample Google Kubernetes Engine Dashboard
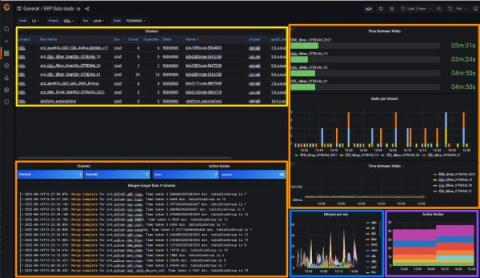
Dashboard Fridays: Sample Grafana Dashboard
Dashboard Fridays: Sample Google Compute Engine Dashboard
Dashboard Fridays: Sample Azure Application Insights Dashboard
Red Hat Uses InfluxDB to Collect gNMI Data for Internal Network Monitoring
Red Hat is a global leader for open source enterprise IT solutions with a portfolio of products that includes hybrid cloud infrastructure, middleware, cloud-native applications, and automation solutions.
How to set up Heartbeat Alerts within Sematext
Optimizing the AWS CloudWatch Log Process
Introducing Outlier Detection in Grafana Machine Learning for Grafana Cloud
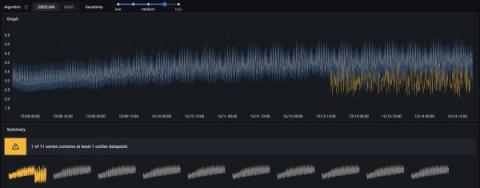
Outlier Detection is now available as part of the Grafana Machine Learning toolkit in Grafana Cloud for Pro and Advanced users. With this feature, you can monitor a group of similar things, such as load-balanced pods in Kubernetes, and get alerted when some of them start behaving differently than their peers. There’s supposed to be a video here, but for some reason there isn’t. Either we entered the id wrong (oops!), or Vimeo is down.
How to monitor and troubleshoot NGINXPlus
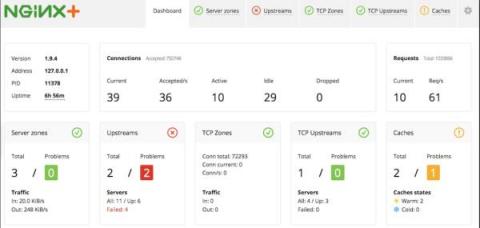
As a continuation of our series for monitoring web servers with NGINX and APACHE, let us find out how to effectively and easily monitor and troubleshoot NGINXPlus using Netdata!
5 Ways to Ensure Success With Your Kubernetes Platform
Moving towards a Kubernetes platform might seem a simple move. You’ll ask your smartest engineers to get started. They will love a move towards cloud and container technology. However, if you want to realize maximum benefit as you start using a platform like Kubernetes, there is more to it.
Zero-Friction AWS Lambda Instrumentation with external extensions
If you’ve been in the software business for some time, you’ve probably noticed that creating software isn’t only about adding features. There are usually many different tasks involved. You have to test your system, fix bugs, and ensure it keeps working over its lifetime.
Dos and Don'ts of Observability: Lessons Learned from RedMonk
On November 16, 2022, I sat down with analyst KellyAnn Fitzpatrick from RedMonk to discuss my favorite topic: observability. This time, we looked at observability in a context of what to do and what to avoid doing as you’re starting and going on an observability journey. Click the image below (or here) for a replay of the session. A machine-generated transcript is available at the end of the post.
How to Add SD-WAN Devices to Hybrid Cloud Observability
Assessing Observability Maturity at Danske Bank
Sun Chemical is future-proofing their monitoring with Icinga
We´re proud of our many customers and users around the globe that trust Icinga for critical IT infrastructure monitoring. That´s why we´re now showcasing some of these enterprises with their Success stories. It´s stories from companies or organizations just like yours, of any size and different kinds of industries. Some of them are our long-standing customers, others have just recently profited from migrating from another solution to Icinga.
ICYMI - Network Monitoring and InfluxDB
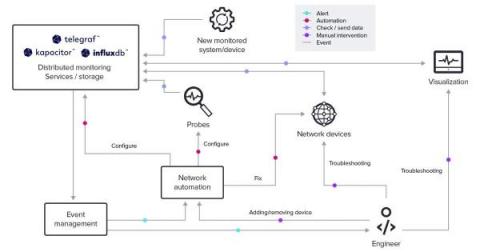
At this year’s InfluxDays event, the capabilities of InfluxDB took center stage. It’s not enough to simply deploy a technology platform and hope people will use it. This isn’t a Kevin Costner movie. That’s why it’s helpful to talk about specific use cases, their typical challenges, and how InfluxDB can address those challenges. Fortunately, that’s just what Influxer Charles Mahler did for network monitoring.
Scout APM: Your All-in-One APM Tool
Technology is everywhere in today's world; every company has its application or website to run its business. Everyone company wants to make sure that their application runs well in all the cases and handles edge cases, but manually it is not that easy. Application performance monitoring tool helps in automating the monitoring process. These APM tools help monitor the application 24x7 and can send alerts regularly if anything fails or crashes in the application.
Top 10 Logging Frameworks Across Various Programming Platforms
A logging framework is a software tool that helps developers output diagnostic information during the execution of a program. This information is used to debug the program or monitor its performance. There are many different logging frameworks available, starting with simple logging libraries to full-fledged logging and observability platforms.
New Year's Resolutions For The Best Microsoft Teams Service
We always say we’ll stick by them, and then once early February rolls around we’ve probably long forgotten the promises we had made in the cold light of the new year. But, if you want to make your business’ Microsoft Teams service quality the best it can be – you need to make some changes (and stick to them).
Logstash Alternatives in 2023: 10 Best Options
Data processing involves collecting, organizing, and manipulating data in a systematic manner in order to extract useful information from it. It involves a series of steps that are performed on a set of data to transform it into a more meaningful and functional form for a specific purpose. Starting from collecting the data to the end part of processing it, data undergoes several layers of checks and balances before it is let out as we see it.
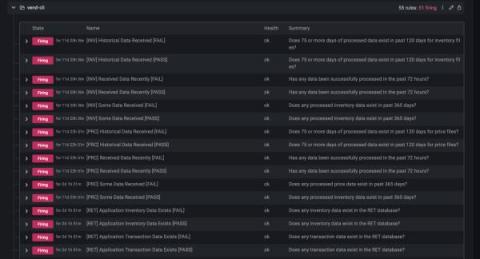
How Grafana Alerting powers Torqata's data health scorecard system
The tire sales industry is a fractured collection of hundreds of point of sales systems and thousands of auto shops and retailers. As a result, manufacturers and distributors lack critical visibility into how these products are sold. SaaS startup Torqata aims to fix that.
Application Performance Monitoring in the Gaming Industry
The gaming industry delivers specialized software at scale to users who expect a flawless interface. Application performance monitoring (APM) will measure critical software performance parameters using telemetry data. By monitoring this data, teams can ensure their game delivers the best user experience and quickly detect when the software needs updates to fix errors or meet key performance indicators (KPIs).
Sysdig Monitor introduces native support for Microsoft Azure Monitor
Microsoft Azure Monitor allows customers to get critical details about their Azure cloud environments and services. The API for Azure Monitor can be a great way for teams to pull this information into their own storage systems for further analysis. However, it can be an overwhelming amount of data to process. Sysdig can help with this problem and eliminate time and effort. Here is how we do it …
How To Install Graylog On CentOS
Netreo 2022 - That's a Wrap!
Netreo enjoyed another great year, and we’re extremely grateful to our customers and partners for their ongoing loyalty and support. We wish all of our customers, business partners, your employees and ours the happiest of holiday seasons. 2022 began with a monumental shift in sales strategy and the addition of experienced leaders in key disciplines.
How Catchpoint's IPM Platform Detected Amazon's Two-Day Search Issue
Not all Internet outages take a website down. Some may impact a smaller subsection of users or only affect one part of a site’s functionality. Moreover, because of their relative “hidden” nature, organizations may not always know about them immediately since fewer users will be making complaints. However, such incidents can still have serious consequences, thus you want to detect them as soon as possible so you can quickly mitigate and resolve issues.
Dashboard Fridays: Sample AppDynamics Dashboard
What is hyperconvergence?
Pandora FMS blog has a very clear purpose: for you to find out everything there is to know about the largest number of rare words related to computing, technology or monitoring, so you can show off among your peers (with whom the hell may you brag about this). Today it’s “Hyperconvergence“! It may sound like something about spacecrafts going into a state close to the speed of light or psychic-type Pokémon attack, but no, it’s something else!
Nastel Receives 18 Top Awards in G2 Winter 2023 Report
Nastel is honored to receive a total of 18 prominent badges across multiple categories as High Performers in the Winter 2023 report by G2. G2 is the world’s largest and most trusted software review platform marketplace. More than 80 million people use G2 to make smarter software decisions based on authentic peer reviews. Quarterly, G2 highlights the top-rated solutions in the industry, as chosen by the source that matters most: our customers.
How to choose the best network monitor for your business
Network monitoring is a vital IT operation that helps organizations keep the business functioning without technical disruptions. To help shoulder the burden of network management for IT operations team and ensure the organization is free from network downtime, organizations turn to network monitoring tools. This is why selecting the best network monitoring tool for your organization is a crucial decision to make.
Monitoring with Prometheus on AWS EC2
Applications and servers need to be constantly monitored to prevent failure and also be able to detect issues on time. This blog post outlines how developers can use Prometheus to monitor applications on AWS EC2 instances.
Citrix HDX Teams Redirection Service is not running
The Citrix HDX Teams Redirection Service is part of the Citrix Virtual Desktop Agent software since version 1906. The service runs on a VDA machine (single- or multi-session) and provides redirection services which offload audio, video and screensharing in Microsoft Teams for optimizing the user experience for Microsoft Teams when used within the VDA.
Configuring OpenTelemetry Agents to Enrich Data and Reduce Observability Costs
Tis the Season: 3D Observability for Prometheus + Grafana + Octoprint
You may get lucky this holiday season with a new 3D printer, either as a gift or something you give yourself as a reward for all your hard work this year. Household 3D printers have made tremendous strides in ease of use and affordability over the last decade.
Getting Started with InfluxDB and Grafana
At some point if you’re working with data, you’ll probably want to be able to visualize it with different types of charts and organize those charts with dashboards. You’ll also need somewhere to store that data so it can be queried efficiently. One of the most popular combinations for storing and visualizing time series data is Grafana and InfluxDB.
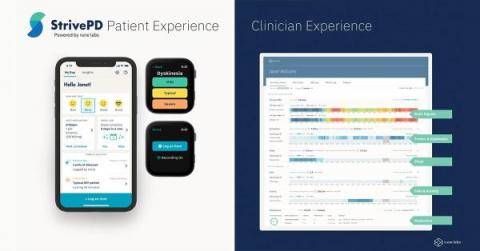
Customer Highlight: How Rune Labs is Improving Parkinson's Patients' Quality of Life Using Sensor Data Collected with InfluxDB
I recently chatted with one of our InfluxDB Cloud customers, Rune Labs, to discuss how they’re using this purpose-built time series platform. Every customer has a unique story — I love sharing their stories as well as their Telegraf, InfluxDB, and Flux tips and tricks. Keep reading to learn about Rune Labs’ approach to precision neurology, and learn from Engineering Manager Carolyn Ranti how they are using InfluxDB to collect sensor data.
Log monitoring and unstructured log data, moving beyond tail -f
Log files and system logs have been a treasure trove of information for administrators and developers for decades. But with more moving parts and ever more options on where to run modern cloud applications, keeping an eye on logs and troubleshooting problems have become increasingly difficult.
Incident management vs. event management
All I Want for Christmas is a Resilient Internet!
Dear Santa, I’ve been an extremely good IT Operations Manager this year (which is saying something considering the state of the world at the moment) and I have a few items on my wish list.
Grafana Agent v0.30: Flow adds support for logging pipelines and graduates to beta
Grafana Agent v0.30 is here! The past couple of Grafana Agent releases have been pretty exciting for us. We introduced Agent Flow as a new way to configure, run, and debug telemetry pipelines. We also announced OpenTelemetry Collector components to expand on our Big Tent philosophy and allow users to switch seamlessly between the Prometheus and OTel ecosystems. This latest release continues that momentum by introducing Loki components for building logging pipelines and marking Flow mode as beta!
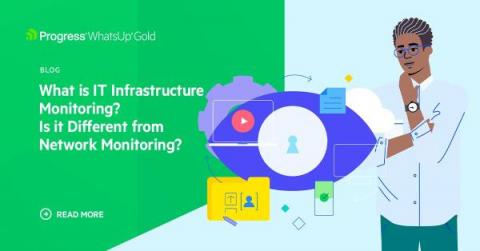
What is IT Infrastructure Monitoring? Is It Different from Network Monitoring?
Computer marketers and analysts never saw a term they didn’t want to change. Not leaving well enough alone with the tried and true "network monitoring," more folks have taken to using the term "infrastructure monitoring." That term is so general as to have little meaning. Afterall, what infrastructure are we talking about? Bridges, roads, servers and NICs? Very confusing.
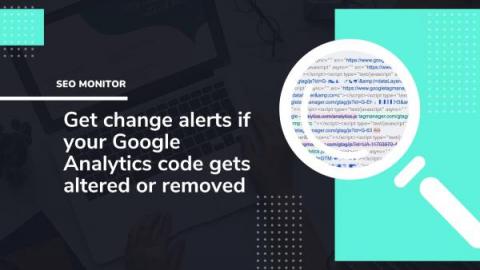
SEO Monitor: Get change alert(s) if your Google Analytics code gets altered or removed
Sending change alert(s) is a core feature of ChangeTower. Whether new content is published on a page, a keyphrase is added or removed, or even if the site’s meta description was changed, ChangeTower can detect and more importantly, alert you of those changes before anyone else. Before diving into how to set this up with ChangeTower, let’s talk about Google Analytics first.
Use HiveMQ and OpenTelemetry to monitor IoT applications in Datadog
Large IoT environments are highly complex and comprise multiple layers of disparate devices that must move data between each other, across potentially unreliable connections. Having visibility into each layer of your IoT environment is critical for quickly identifying problems with your deployment that could negatively impact user experience.
How to monitor and troubleshoot Dovecot
Find out how to effectively and easily monitor and troubleshoot Dovecot using Netdata.
Exploiting IAM security misconfigurations and how to detect them
These three IAM security misconfiguration scenarios are rather common. Discover how they can be exploited, but also, how easy it is to detect and correct them. Identity and access management (IAM) misconfigurations are one of the most common concerns in cloud security. Over the last few years, we have seen how these security holes put organizations at increased risk of experiencing serious attacks on their Cloud accounts.
Monitoring your Serverless Application on AWS Lambda with Elastic
How to use machine learning to identify log spikes & patterns for PostgreSQL logs with Elastic AIOps
11 unique insights into SLOs and reliability management
Why Developer Work-Life Balance Depends on Quality Website Monitoring
Work-life balance is so important to us that 72% of U.S. employees consider it a high priority when choosing a job. It lets you spend time with your family and friends and gives you a much-needed break from work. For those of us in the website monitoring world, it can be hard to find that balance. Bad website monitoring only worsens the issue, leading to more stressed-out, overworked developers who ultimately burn out and even quit.
What Is OpenTelemetry?
What is a log shipper - Top 7 Log Shippers that you can use
End User Experience Monitoring for Healthcare
The global "mHealth market" is anticipated to reach USD 293.29 billion by 2026, growing at a CAGR of 29.1% over the forecast period, according to Fortune Business Insights. This growth is being driven by the rising adoption of mobile health technologies and the increasing use of cloud-based services. This growing customer dependence and ever-changing landscape of healthcare make it more important than ever to have a comprehensive understanding of how your applications are performing and to ensure that mission-critical applications, which can cause serious consequences from downtime, perform as they should.
Our Journey Into Cutting Kubernetes Costs by 40%
As companies start their Kubernetes and cloud-native journey, cloud infrastructures and services grow at a rapid pace. This happens all too often as organizations shift left without thorough controls, which can lead to overallocating and overspending on their Kubernetes environments. Organizations running workloads in the cloud can put budgets at risk when they lack information about key facts.
Putting Customers First and Amplifying Our Core Values
Cribl places high importance on its core values of Customer First, Always; Together; Curious; Irreverent but Serious, and Transparent. We strive to embody these values every day, and a particular customer issue recently enabled us to exemplify them to that customer. Recently, the Cribl Support, Software Engineering, and Product Management teams worked together with our largest Cribl Cloud customer to resolve throughput issues that arose when integrating Cribl.Cloud with Azure Event Hubs (EH).
How OpenTelemetry Powers Observability @ Canva
Website Downtime: Cost, Impact, and Best Solutions
Given the advanced digital age we are in now, a website's uptime and availability determine the success of businesses of all shapes and sizes. There are numerous challenges that each organization must face and overcome to ensure business continuity. One of the top in this list of challenges is website downtime. Your website must always be up so visitors can access it anytime and anywhere. However, if your website is frequently down, it will be tagged as unreliable, which reflects poorly on you.
Jira Automation Demystified
Repetitive tasks can be time consuming. In an ideal world, automation would remove all of the grunt work when it comes to solving business problems, freeing us up to execute on more strategic decisions. Luckily, Jira has the capabilities to take a load of tasks off your hands – including tracking your issues, posts, features, and more. This blog will walk you through the options available and offer top tips on how to set this up.
Querying Data in InfluxDB Using Flux and SQL
With the release of InfluxDB’s new storage engine for InfluxDB Cloud, InfluxDB Cloud now supports SQL. This is because the updated InfluxDB uses the Apache Arrow DataFusion project as a key building block for its query execution engine. DataFusion’s sophisticated query optimizations support near unlimited cardinality data in InfluxDB Cloud.
Modern observability and security on Kubernetes with Elastic and OpenTelemetry
The structured nature of Kubernetes enables a repeatable and scalable means of deploying and managing services and applications. This has led to widespread adoption across market verticals for both on-premises and cloud deployment models. The autonomous nature of Kubernetes operation, however, demands comprehensive, fully-converged observability and security. This is uniquely possible today using the Elastic platform.
What is OpenTelemetry?
ChaosSearch re:Invent 2022 | theCube
ChaosSearch Overview & Demo
Dashboard Fridays: Zendesk
Dashboard Fridays: CircleCI
Dashboard Fridays: Azure DevOps
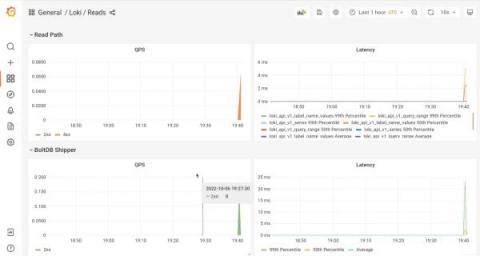
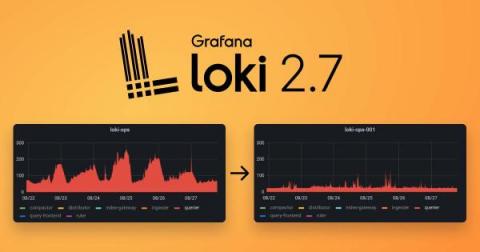
The only Helm chart you need for Grafana Loki is here
The community has spoken, six Helm charts is not enough! We agree! In all seriousness though, six charts is simply too many to maintain. And while it might sound counterintuitive, that’s why we are announcing a new Helm chart. By focusing on the “Grafana Labs way" to run Grafana Loki using Helm, we believe this will help us and the community concentrate our Helm efforts into a single chart. This new chart is released under grafana/loki at Helm version 3 or higher.
How we scaled a stateful microservice using Redis
Update: Expanding our new API functionality
Monitoring your router with MetricFire
Having a healthy network is essential for any online business. Downtime can be costly; if you're not monitoring your devices, you could have more downtime than you realize. Routers, in particular, are essential for keeping a network running. Routers are critical equipment for any business that relies on the Internet to communicate with customers or clients. A slow or faulty router can grind business to a halt, which is why keeping an eye on your router's performance is essential.
Network Visualizations
5 key factors to consider before choosing network mapping software
Docker Container Lifecycle Tutorial | Create, Run, Pause, Stop, Kill
Modernizing IIoT Operations with InfluxDB
Continuing in our series of InfluxDays recaps, we turn our attention to Brian Gilmore’s presentation on Industrial IoT. This is an area that uses time series data extensively and has a lot of room to expand the way it uses this data. Here’s a quick breakdown of where things stand today.
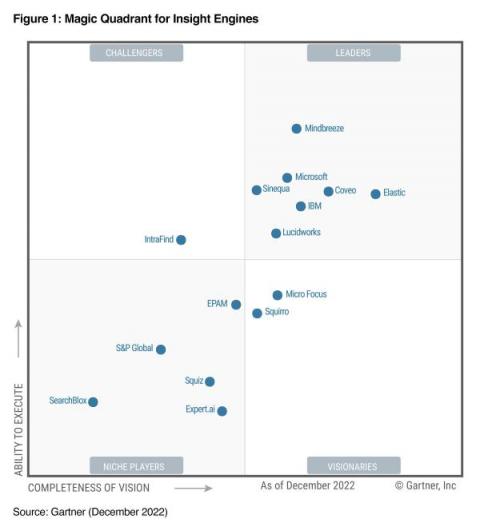
Elastic recognized as a Leader in the 2022 Gartner Magic Quadrant for Insight Engines
We’re pleased to announce that Elastic has been named a Leader in the 2022 Gartner® Magic Quadrant™ for Insight Engines. This is our second year of inclusion in the Gartner Magic Quadrant for this category, and this year’s evaluation places Elastic as the furthest entry on the "Completeness of Vision" axis.
Top 12 Observability Benefits for Your Company
Observability is a growing practice that provides many benefits to IT and DevOps teams. With greater visibility into their environments, teams can determine the state of the system, predict issues, and mitigate them before end users are impacted. Observability makes data more usable and in turn, businesses reap the benefits of having great insights. Are you on the fence on whether to get started with your own observability practice? Check out these 12 observability benefits and get started today!
PHP Symfony APM Benefits
If you are a Symfony PHP developer, you will need Symfony monitoring. With the ever-increasing need for web applications to perform at their best, developers require full visibility and observability. This way, they have full control of the performance and its maintenance. Imagine you have created an application. You have deployed it but do not know how it works. This is where an Application Performance Monitoring tool is of great use. It should be on every developer’s toolkit.
A Peek into the Next Generation Observability Solutions
As organizations strive to meet the challenges of digital transformation, they are adopting newer technologies to build more robust software systems. Next generation observability solutions are paving the way to help them meander this maze to deliver better customer experiences and drive business results.
Configuration and Change Tracking: A Key Part of Observability Strategy
Configuration Management and Change Tracking are well known key tenets of project management. Change tracking and controlled change ensure that there is a record of the state of a system and if issues arise the cause can be linked to effects. In this blog, I will use a real-world example to demonstrate the importance of configuration and change tracking when it comes to IT observability.
Watchdog: AI Across the Datadog Platform
VictoriaMetrics Meetup December 2022
Top 10 Network and IT Infrastructure Monitoring Tools
Network and IT infrastructure monitoring is something necessary for all connected organizations today. However, choosing the right network monitoring tool and software is not easy as there is a huge diversity of these tools on the market now. Comprehensive network and IT monitoring tools help you manage your devices and ensure that they are available when you need them. These tools and software offer a wide variety of benefits for companies of all sizes.
How to Monitor MPLS to SD-WAN Migrations
What You Need To Know About Hybrid Cloud Kubernetes
Enterprises are increasingly adopting Kubernetes. In fact, Gartner estimates that by 2026 more than 90% of global organizations will be running containerized applications in production, an increase from fewer than 40% in 2020. And IDC reports that 80% of new workloads are being developed in containers.
Bleemeo Introduction
Kentik Synthetics in 20 Seconds
Kentik DDoS Protection in 20 Seconds
Kentik Cloud in 20 Seconds
Application Experience: Product Overview
Nexthink Infinity: Platform Overview
LM Envision Application Topology: A New Way To Visualize Application Connections
Cloud & observability: hot topics from AWS re:Invent
7 expert recommended data observability tools
Observability tools have traditionally focused on capturing and analyzing log data to improve application performance monitoring and security. Data observability turns the focus back on the data to improve data quality, tune data infrastructure and identify problems in data engineering pipelines and processes. “Data analysts and business users are the primary consumers of this data,” said Steven Zhang, director of engineering at Hippo Insurance.
Hey! Let's talk AIOps-Part 3
Welcome back! In the previous blog, we discussed with our panelists Carlos Casanova, Forrester principal analyst, and Gowrisankar Chinnayan, who heads product management at ManageEngine, why organizations should adopt AIOps, and the challenges they face. Let’s start by acknowledging the increasing interest in AI. More enterprises are adopting AI-based solutions as they discover how AI can help manage IT operations.
Automate Observability Tasks with Logz.io Machine Learning
As an observability provider, we are always confronted with our clients’ goal for faster resolution of problems and better overall performance of their systems. By working on large-scale projects at Logz.io, I see the same main challenge coming up for all: extracting valuable insights from huge volumes of data generated by modern systems and applications.
Product Spotlight: Announcing Power Search for Log Restore
We’re excited to announce significant improvements to our Archive+Restore capabilities – which enables low-cost long term log storage in AWS S3 or Azure Blob, while providing access to ingest those logs into Logz.io at any time. The first enhancement is Power Search, which will make it faster to restore logs from archived log data in AWS S3 (and soon for Azure Blob) in our Open 360™ platform.
How Integrations Can Make or Break Your Monitoring Experience
A good website monitoring tool provides plenty of features and is easy to use. But what happens when you find out the tool you were so excited about doesn’t allow you to send information to your existing status dashboard? Now you have to manage two separate tools and even duplicate work. This is not ideal. Integration capabilities of a website monitoring tool make your life easier by seamlessly merging with external tools and dashboards of your business.
How to: Using a CDN - Complete Guide to Content Delivery Networks
Content Delivery Networks (CDNs) are becoming the norm for many web-based applications, but too often the benefits of CDNs go unnoticed. If you're looking to increase speed and reduce bandwidth, a CDN can be your solution. This comprehensive guide will provide you with all the information you need to get started using a CDN, including when it makes sense to use one and how they compare to other options.
Monitor your configuration with Terraform state #Shorts
Icinga DB Web deep custom variable filter
In this blog post I will introduce you to filtering, based on deep custom variables in Icinga DB Web. In Icinga Web 2 monitoring module, it is not possible to filter deep custom variables. Example of deep custom variables involving dictionaries and arrays: This is because in the database (IDO) the suitable structure for the custom variables is not available. The dictionaries and arrays in the custom variables are saved in json format as shown below.
How to monitor the status of external services
Monitoring the status of external services connected to your business is essential for providing reliable and efficient customer service. An effective way to stay ahead of any issues is by monitoring all of the services connected to your business so that you can address any potential problems before they have a chance to have a negative impact on operations. In this article, we will be discussing how to monitor external services’ status and the importance of having access to accurate data.
Sunrex Technology Removes Network Security Bottlenecks in Information Security with Progress Flowmon
What is Internet Performance Monitoring and How is it Different from APM?
Most Internet-centric organizations today use some form of APM tools, as they should. But they are insufficient. Over the last ten years, the world has completely changed. If you think about it, in the first decade of this millennium, most businesses had an Exchange server, maybe Siebel CRM, a file share, and a range of other business apps, usually hosted in the same building. Everything was on the LAN. Today, it is the exact opposite. Everything is distributed.
How to set up Checkly API monitoring in 50s with Curl imports
Elastic recognized as a Strong Performer in The Forrester Wave: Artificial Intelligence for IT Operations (AIOps), Q4 2022
We are excited to announce that Elastic has been recognized as a Strong Performer in The Forrester Wave™: Artificial Intelligence for IT Operations (AIOps), Q4 2022 in our first year participating! As organizations modernize their infrastructure and applications, operations and development teams are faced with an exponential growth in data.
ScienceLogic Celebrates the End of a Stellar Year with Strong Performance in Forrester Wave
We are excited to announce that ScienceLogic has excelled in the Forrester Wave for AIOps again! We are proud to be named a Strong Performer this year—receiving the highest marks possible in the product vision, execution roadmap, performance, and automation and remediation criterion. Our Chief Product Officer, Michael Nappi, spoke about this great news, our recent acquisition of Zebrium, and ScienceLogic’s own journey to AIOps.
Martello's Top Ten for 2022
As we head towards the end of 2022, we find ourselves reflecting on the past year and those who have helped to shape our business. In our small way of giving back, we have made a donation to the Red Cross on behalf of our global customers, partners and employees so that they can continue to rapidly respond to emergencies or emerging humanitarian needs anywhere in the world. Below we have curated a list of the year’s developments that have helped us bring more value to our customers and partners.
Observability trends and challenges in 2023
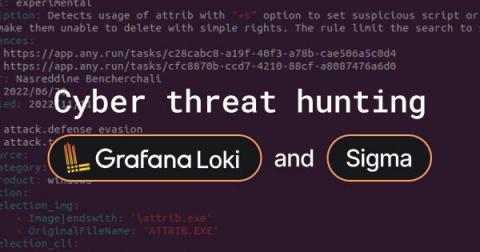
A guide to cyber threat hunting with Promtail, Grafana Loki, Sigma, and Grafana Cloud
Fact: The Security Operations team at Grafana Labs loves logs. They are a key pillar of observability for many reasons, such as how they are stuffed full of details to help us diagnose the “why?” when things go wrong. This is especially true when the information pertains not to a series of unfortunate events, but instead to an adversary trying to cause us harm.
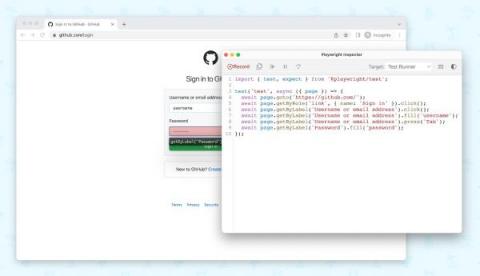
How to Bypass TOTP-Based 2FA Login Flows With Playwright
Testing applications behind a login flow is cumbersome. And it gets even worse when there’s two-factor authentication (2FA) involved. Many people work around this problem by disabling it or implementing wild hacks. Automating a 2FA-based login flow is just too hard! I thought that for a long time, too. But I must admit — I was wrong.
How Locus Decreased Customer-Reported Issues by 95% With Synthetic Monitoring from Checkly
Learn how Locus uses advanced synthetic monitoring from Checkly to ensure the reliability of its Dispatch Management Platform Locus.sh is a leading-edge technology company solving one of the most challenging global supply chain problems: last-mile logistics. Locus' order-to-delivery dispatch management platform helps enterprises transform their last-mile logistics operations into growth centers.
OpenTelemetry 2022 Holiday Goodie Bag
We here at Honeycomb really like OpenTelemetry and goodie bags, so we have a nice little OpenTelemetry-flavored holiday goodie bag to share with you before you’re off for the holidays!
Root Cause Analysis of Performance Issues for Apps Running on AWS
Founder & Friends - Introducing our Public API
5 Predictions for Kubernetes in 2023
It should surprise no one that Kubernetes uptake is growing and will continue to do so. The wildly popular container orchestration platform’s continuous development is fueled by broad adoption. This will continue in 2023 as more companies, teams and individuals embrace it as a platform for innovation, building new applications and scaling existing ones faster than ever before.
How to monitor and troubleshoot CoreDNS
Find out how to effectively and easily monitor and troubleshoot CoreDNS using Netdata.
The Benefits of APM in a Staging Environment
The earlier you can integrate APM metrics into your application, especially in your staging environment, the better. Why? Using APM metrics can help with visibility in your application development process, as the sooner you can see how your latest code performs, the faster you can optimize your application.
How KCB Bank Uganda greatly improved transaction service monitoring with Grafana
In 2019, KCB Bank Uganda reviewed its systems and came to a startling realization: Due to outdated monitoring processes, its services could be down for hours before anyone was alerted internally. This downtime led to frustrated consumers, a rise in customer service complaints, and a decline in revenue.
A Year in Internet Analysis: 2022
This past year was another busy one for the internet. In this blog post, I will highlight some of the top pieces of analysis that we published in the past 12 months. This analysis employs Kentik’s data, technology, and expertise to inform the industry and the public about issues involving the technical underpinnings of the global internet and how global events can impact connectivity. These posts are organized into two broad categories: major internet disruptions and BGP routing security.
5 Tips to Improve How You Use Github Dependabot
Software development doesn’t end when deployment is complete. Instead, developers constantly tamper with the code even after deploying the app. Staying up-to-date with security fixes, bugs, and dependencies is crucial to ensure your app performs properly. After all, nobody wants a malfunctioning product, right? GitHub Dependabotis one of the several tools you can use to update dependencies.
Product Spotlight: Smart Tiering + LogMetrics to Optimize Costs
Is all observability data worth the same cost? If you guessed no, then you’d obviously be correct. Anyone familiar with the very nature of gaining targeted observability knows that some data points hold more value than others. Yet, many observability platforms still treat all types of log data the same, and as a result, related costs remain uniform. One of the most persistent observability challenges today is the cost of indexing log data.
Goodbye LAN. The Internet is the Network.
We are at the cusp of an important technology transformation. A discontinuity in technology as Peter Drucker would call it (precipitated by Covid). For decades, IT organizations invested in building, managing, and monitoring LANs. Everything was on your local network: your CRM, your Exchange email, the file shares, and the print server. Today, many companies are shutting down their “old legacy network” and are running their enterprise without a LAN, WAN, or an OnPrem datacenter.
Understanding Your Amazon EKS Spend
Most customers running Kubernetes clusters Amazon EKS are regularly looking for ways to better understand and control their costs. While EKS simplifies Kubernetes operations tasks, customers also want to understand the cost drivers for containerized applications running on EKS and best practices for controlling costs. Anodot has collaborated with Amazon Web Services (AWS) to address these needs and share best practices on optimizing Amazon EKS costs.
The Immutability of Time Series Data
Time series data often comes in large volumes that need to be handled carefully to produce insights in near real time. We’re constantly moving through time. The time it took you to read this sentence is now forever in the past, unchangeable. This leads to something unique about data with a time dimension: It can only go in one direction. Time series data is different from other data for many reasons.
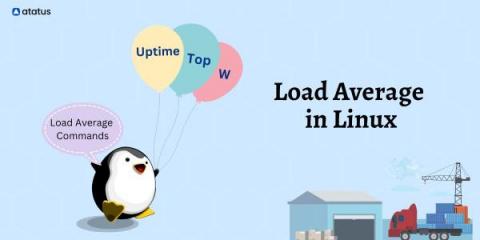
Explaining Load Average in Linux for System Administrators & Developers
When you run the uptime command, most of you might be familiar with the three numbers appearing on the top right corner of your Linux screen. But, do you know what those numbers indicate or why there are three such numbers? It is called the load average, a metric that assesses the load on your computer systems. While it can be considered a precise tool for measuring system and resource engagement, it would only be worthwhile if you understand it right.
Observability Pipelines for an SRE
In data management, numerous roles rely on and regularly use observability data. The Site Reliability Engineer is one of these roles. Site Reliability Engineers (SREs) work on the digital frontlines, ensuring performant experiences by using observability data to maintain stability and awareness of software running in various environments across organizations.
Orange Slovensko
Can Your Cloud Migration Strategy Keep Up With the Speed of Business?
A hybrid infrastructure brings business benefits but it also brings new challenges. Migrating workloads to the cloud is a complex operation that generates more data than engineering teams can adequately manage. Traditional monitoring tools are limited in helping teams find and fix problems during and after a cloud migration. This can throw business strategies off course, limit customer value and hurt the bottom line.
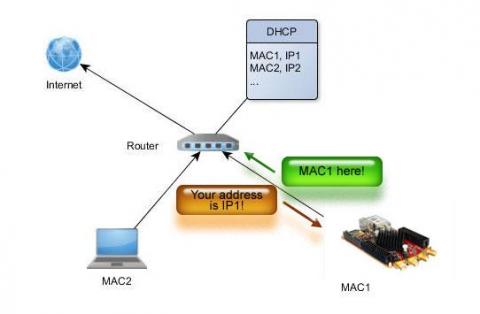
How to monitor and troubleshoot Dnsmasq for DHCP?
Find out how to effectively and easily monitor and troubleshoot Dnsmasq for DHCP using Netdata.
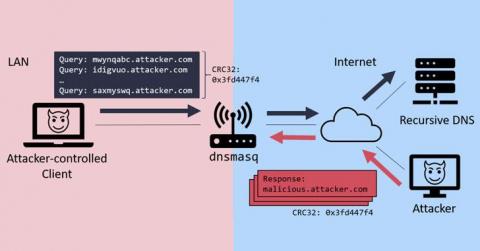
How to monitor and troubleshoot Dnsmasq DNS Forwarder
Find out how to effectively and easily monitor and troubleshoot Dnsmasq DNS Forwarder using Netdata.
Quick Bytes - Getting started with Lumigo
Configuration of historical database
Catchpoint enhances capabilities to empower IT organizations to achieve Internet Resilience and gain control of their Internet stack
How to monitor and troubleshoot Postfix
Find out how to effectively and easily monitor and troubleshoot Postfix using Netdata.
Exploring the New Container Checkpointing Feature
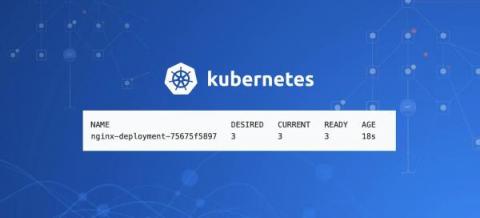
Kubernetes is a continuously evolving technology strongly supported by the open source community. In the last What’s new in Kubernetes 1.25, we mentioned the latest features that have been integrated. Among these, one may have great potential in future containerized environments because it can provide interesting forensics capabilities and container checkpointing.
How to Automate SMS Alerts and Emails
Automated alerts or notifications are forwarded through texts, emails, pagers, and CRMs to tell you when an error or predefined event has been discovered within the service. They are integral to many business intelligence solutions, including site reliability monitoring to address the factors that impact website performance. A performance monitoring tool like Uptime.com makes it easier to configure your notification settings for testing various networks, SLAs, and servers.
A new runtime, new and shiny dashboards and Firewatch - Checkly Changelog December 2022
How to Export and Schedule Reports in WhatsUp Gold
How to Create and Modify Dashboard Reports in WhatsUp Gold
Using Red Fish Discovery in WhatsUp Gold
Discovering Cloud Environments to Monitor in WhatsUp Gold
How to use monitoring and dashboards with Google Cloud Armor
ICYMI - Scripting and Query Languages in InfluxDB
At our recent InfluxDays event, Gary Fowler discussed the current state of scripting and query language support in InfluxDB. This is an aspect of the platform undergoing constant development, so here’s a quick recap of what Gary went over.
AWS re:Invent 2022 Recap: What Happened In Vegas ...
AWS re:Invent has come and gone. A great deal of fun was had along with many new insights shared. Here’s a recap from some ScienceLogicians who were in attendance.
5 Things You Need to Know Before Making the Move to Microsoft Teams Phone
Microsoft Teams Phone is a powerful collaboration and communication tool, making the use of Teams easier and more flexible than ever. Many businesses want to grab the benefits of an easy-to-manage platform that flexibly supports the complexities of their existing operations, incorporating PSTN calling. But before you dive in, what are the key things you should know?
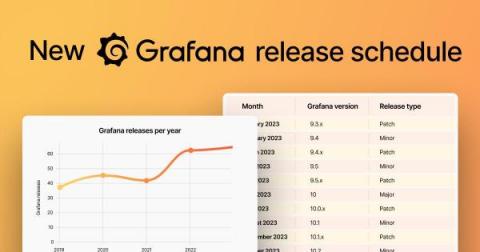
Grafana releases: New 2023 release schedule
Over the last few years, the Grafana open source project has grown at an eye-watering pace, with more than 1 million active Grafana instances now in the wild. With that growth, our processes have had to run to keep up. This is especially true when it comes to how frequently we release new versions of Grafana. Currently we cut.
Kubernetes and Cross-cloud Service Meshes
As today’s enterprises shift to the cloud, Kubernetes has emerged as the de facto platform for running containerized microservices. And while Kubernetes operates as a single cluster, enterprises inevitably run their applications on a complex, often confusing, architecture of multiple clusters deployed to a hybrid of multiple cloud providers and private data centers. This approach creates a lot of problems. How do your services find each other? How do they communicate securely?
What is Application Topology and how to access it?
Customers Should Own Their Data
Building Products to Solve Customer Problems
How to Discover Virtual Environments in WhatsUp Gold
How to Discover Windows Environments in WhatsUp Gold
How to Discover SNMP Devices in WhatsUp Gold
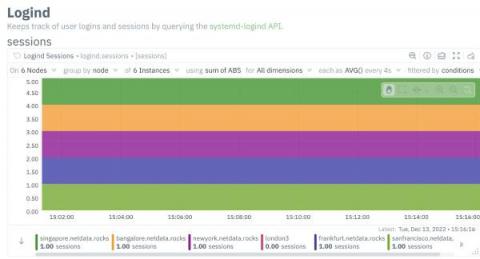
How to monitor and troubleshoot systemd-logind
Find out how to effectively and easily monitor and troubleshoot systemd-logind using Netdata.
Learn about the meaning and value of cloud-native from experts at Atchison Technology, Qumu, Microsoft, and Techstrong Group
How Covid-19 has Impacted the Software Developers
In 2020, the Covid-19-induced lockdown forced all companies to rely on the Work from Home (WFH) policy as an important measure for business continuity. It was an easy transition for the software and IT professionals compared to other industries. However, switching to WFH wasn’t as simple as a one-click operation. There were challenges in WFH, spanning from technical issues to infrastructure setup, as well as in managing the physical and mental well-being of the workforce.
Building Resilience in Manufacturing with the Power of Data
Resilience has become the new strategic imperative for manufacturers during these testing times. As the world’s challenges make headlines, so do the innovative responses of manufacturing leaders. Savvy manufacturers automate, overhaul fundamental processes, modernize their security posture and reduce their CO2 footprint. Forward-focused organizations double down on their cloud investment to become more agile and resilient. And none of it is possible without data.
Grafana Loki top 5 query performance tips
AWS monitoring: Metrics that matter
Amazon Web Services is a major cloud services platform used by companies around the globe. Its cost-effectiveness and high agility has helped brands across all categories, verticals, and sizes scale their services quickly and efficiently. With many organizations now leveraging AWS resources to develop, build, and run business-critical applications in the cloud, it is important to track and monitor the performance of these services in real time to avoid unexpected issues.
mission-critical application
A mission-critical application is a software program or suite of related programs that must function continuously in order for a business or segment of a business to be successful. If a mission-critical application experiences even brief downtime, the negative consequences are likely to be financial. In addition to lost productivity, a mission-critical app’s failure to function may also damage the business’ reputation.
Trace-based Testing: Modern Testing for the Modern Infrastructure
Traditional software application infrastructure generally followed a monolithic pattern; one application connected to one database. Understanding what was going on inside the application itself was a simple proposition, with relevant logs and metrics all originating from the same source. When it came time to scale, the answer was to get a bigger server or to get more servers.
Guide to Frontend Error Handling
To enhance user experience, avoid data loss, and guard against security vulnerabilities, frontend errors must be handled properly. In this post, we'll cover the most common types of frontend errors and best practices for handling them. We'll also explore how to use the popular error monitoring platform Rollbar to track and manage errors.
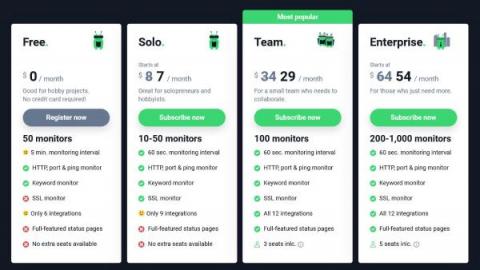
December 2022: We are introducing Sub-users and new plans!
Hey there, We’re excited to announce that the highly anticipated sub-users feature has finally launched!🚀
Forum Release: Accelerating & Securing Your Digital Transformation with AIOps
Introducing ScienceLogic Forum. Designed to expand your ability to see, contextualize, and act to reinforce the framework of AIOps.
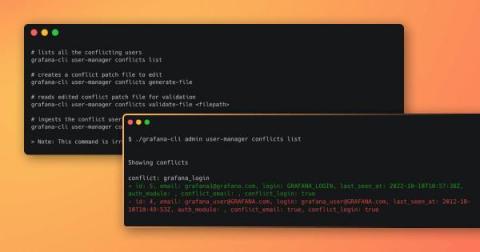
Guide to using the new Grafana CLI user identity conflict tool in Grafana 9.3
Here at Grafana Labs, one of the things we’re always working on is making Grafana more consistent. Given the increased adoption of Grafana around the world and the number of users and authentication providers we support, we wanted to create better defaults for login and email fields.
Understanding InfluxDB IOx and the Commitment to Open Source
If you’ve been following InfluxDB, you’ve probably heard of InfluxDB IOx, the next evolution of the storage engine powering InfluxDB Cloud. However, I wanted to learn more about how the open source components of the new engine help achieve the requirements for the new InfluxDB engine and why they were chosen. This post covers that precise topic. We’ll also learn why InfluxDB chose to contribute to these open source projects and what our commitment to open source looks like today.
5 Approaches to Deep Learning Clustering You Really Need to Know
Data has become the most valuable thing in the modern world. According to earthweb, more than 2.5 quintillion bytes of data will be created every day in 2022. These large quantities of data should be appropriately organized to identify meaningful patterns for decision-making. Techniques like clustering are widely used to efficiently collect data into groups based on their similarities and differences and improve the observability of your data.
Thank You Nexthink Community for A Great 2022
Hello Nexthinkers, Today is a great day for us. We just received the amazing news that for the second year running we have won 2022 Gartner Peer Insights the Customer Choice award! I wanted to take this opportunity to thank our entire community and also share why this is a big deal for us.
NS1 Implements Honeycomb to Democratize Their Code and Spark Customer Joy
The line from observability to customer joy is straighter than you think. We recently learned this from NS1, a managed DNS provider and Honeycomb customer, in a panel discussion with Nate Daly, Head of Architecture at NS1 and Chris Bertinato, Software Architect at NS1.
Introducing Obkio's Network Performance Monitoring Software - In 60 Seconds
Installing and Configuring an OpenTelemetry Agent w/ BindPlane OP
Creating a Configuration Template w/ BindPlane OP
Understanding Performance Testing in Unity: A Real-World Example
Performance testing is an important part of any application. It helps developers to increase the application reliability while providing a smooth user experience to the end users. However, when it comes to Unity projects, games and interactive applications have a higher requirement for performance compared to traditional applications.
How to monitor and troubleshoot Chrony
Find out how to effectively and easily monitor and troubleshoot Chrony using Netdata.
Cribl at AWS re:Invent 2022: Spoiler Recap!
What do you get when you throw 50,000 attendees together with Darth Vader and Obi-Wan Kenobi in Las Vegas? Lightsaber battles and demos from Cribl Jedis fighting for the liberation of customer data from vendor lock-in, of course! AWS re:Invent 2022 was a total hit this year and we had such a great time showcasing to AWS customers how easy it is to realize the full potential of the cloud by unlocking data first. The week was full of exciting new launches, talks, happy hours, and more!
Enabling TLS on a Cribl Leader for both GUI and Worker to Leader communications
How To Monitor NGINX using Telegraf and Graphite
When enterprises run online services, web servers play an essential role. They allow the software to surface on the world wide web and make it accessible through web browsers for customers worldwide. When the performance of a web server gets degraded or, even worst, if a web server is entirely down, it impacts not only the business bottom line but also the brand image for not providing reliable service to customers. Failure to manage web servers can also lead to security risks.
Hey! Let's talk AIOps-Part 2
Welcome back! In the previous blog, we discussed what AIOps is and the significant role it plays in ITOps with our panelists: Carlos Casanova, Principal Analyst at Forrester, and Gowrisankar Chinnayan, head of product management at ManageEngine. In this blog, I am going to walk you through the rest of our discussion. Our talk revolved around the reasons why organizations should adopt AIOps.
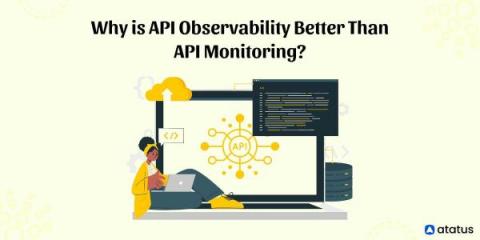
Why is API Observability Better than API Monitoring?
In recent years, there has been a rapid expansion in the API market. Today, every piece of software is either an API or uses one. They are now a crucial component of the modern digital economy. As a result, it is becoming increasingly important to grasp how to examine them carefully. In this article, we'll discuss the definitions of API observability and API monitoring as well as how API observability is better than API monitoring.
Receive website change alerts directly to your Slack workspace
When Slack was first launched back in 2013, the idea of using a centralized messaging system hadn’t been around for too long. Why? Organizations and businesses didn’t even know they needed one. Instead, they used different methods and tools to communicate – emails, SMS messaging, Skype for online meetings, etc. How did Slack earn the title of your company’s digital headquarters?
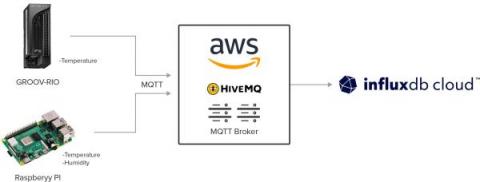
Benefits of Native MQTT Integration on InfluxDB Cloud
To a great extent, the value of the Internet of Things (IoT) is realized through the insights (data) generated from sensor data integrated in storage and analytics systems. Consequently, how the data integration is conducted directly impacts the success of IoT projects. For this reason, InfluxData introduced Native Collectors to bypass multiple data hops and enable one-step integration of data from data brokers such as HiveMQ MQTT broker into its InfluxDB Cloud time series database.
When to Use Flux vs Python
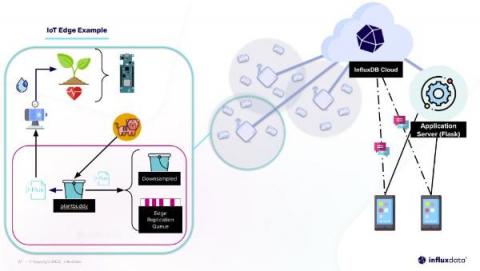
If you’re new to InfluxDB you might wonder, “Why does InfluxDB have its own query and scripting language (aka Flux)?” You might also be thinking, “InfluxDB has client libraries. Why and when should I use the Python client library and when should I use Flux?” In this post we’ll discuss when developers should use Flux and when they should use Python for developing their IoT applications.
Why Observability Is Important for IT Ops
Everyday when you come into work, you’re bombarded with a constant stream of problems. From service desk calls to network performance monitoring, you’re busy from the moment you login until the moment you click the “shut down” option on your device. Even more frustrating, your IT environment consists of an ever-expanding set of network segments, applications, devices, users, and databases across on-premises and cloud locations.
What You Need to Know About Log Management Architecture
You’ve made the decision to implement a centralized log management solution because you know that it’s going to save you time and money in the long term. However, to get the most bang for your log management buck, you need to understand how the different parts of your log management deployment work. Once you understand each resource, you can implement a more efficient log management architecture.
How to build a Formula 1 real-time analytics stack with Azure Data Explorer and Grafana Cloud
For Formula 1, speed is about more than just how fast you go around the track. It’s also about having data at your fingertips in real time to make critical improvements before, during, and after the race. “Formula 1 is one of the most fascinating data-driven sports,” said Anshul Sharma, Senior Product Manager at Microsoft. “It’s so competitive that even one tenth-second advantage can change the outcome of the race.”
Installing the Request Metrics Agent
Container Monitoring Demo
How OpManager helps with troubleshooting network issues
Grafana 9.3 feature: Grafana OAuth token improvements
As part of our efforts to improve the security of Grafana, we introduced a long-awaited feature in the latest Grafana 9.3 release that enhances Grafana’s OAuth 2.0 compatibility. The new Grafana OAuth token improvements, which are available in Grafana OSS, Grafana Cloud, and Grafana Enterprise, ensure that the user is not only logged into Grafana, but they’re also authorized by the OAuth identity provider.
Real User Monitoring (RUM) vs Synthetic Monitoring: What Are the Differences?
Three seconds is a very important number for website owners. They know that 50% of visitors will leave their website if it doesn’t load in that time. Website developers spend a lot of time optimizing and refactoring code so that it runs more quickly and provides a better user experience. User experience is something that monitoring only uptime won’t tell you. A website might be up, but if it takes 10 seconds to load, customers will bounce.
Splunk - The Data Platform for the Automotive World | Driving Transformation with Data
How to Set Up an Alert on NetPath
BigQuery: Manage your workloads
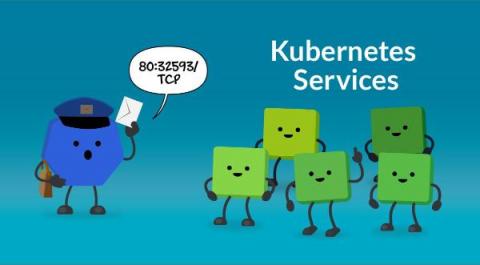
Kubernetes Services: ClusterIP, Nodeport and LoadBalancer
Pods are ephemeral. And they are meant to be. They can be seamlessly destroyed and replaced if using a Deployment. Or they can be scaled at some point when using Horizontal Pod Autoscaling (HPA). This means we can’t rely on the Pod IP address to connect with applications running in our containers internally or externally, as the Pod might not be there in the future.
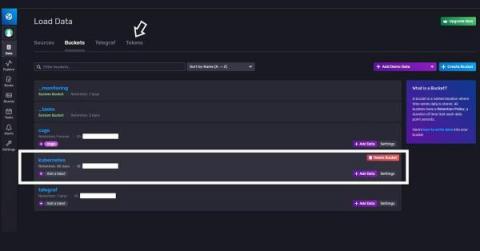
How to Monitor Kubernetes K3s Using Telegraf and InfluxDB Cloud
This article was originally published in The New Stack and is reposted here with permission. A Helm chart can simplify our lives and enable us to see what is happening with our K3s cluster using an external system. Lightweight Kubernetes, known as K3s, is an installation of Kubernetes half the size in terms of memory footprint. Do you need to monitor your nodes running K3s to know the status of your cluster?
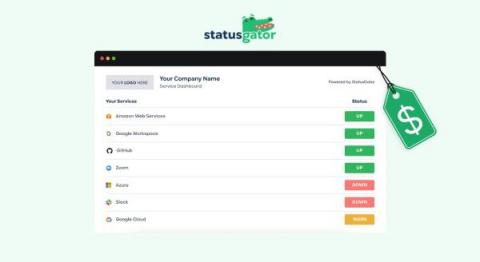
Status Page Pricing - 22 Most Popular Status Page Tools Cost Reviewed [2023]
Keeping your customers informed about the status of your website, application, or service is essential nowadays. If you don’t have a status page to communicate this, you’re missing an opportunity to improve transparency and reduce the customer support burden. It is especially true if you are running an online business and your website is your main source of income. The status page is crucial not only for your business but for your customers as well. So how much can a status page cost?
Is a Monitoring Suite a Sweet Deal?
So you are looking for an IT infrastructure monitoring solution? Well, you’ve come to the right place and I don’t mean just because we at Netreo sell an industry leading solution. This blog post takes you through a number of considerations that you should consider when looking at ITIM tools.
The Hidden Costs of Serverless Observability
The growing popularity of serverless architectures has led to an increased need for solutions to the modern challenges of microservice observability—one of the most critical components for running high-performing, secure, and resilient serverless applications. Observability solutions have to break through the complexity of serverless systems, and with the right stack, observability enables not only fast and easy debugging of applications, but drives optimization and cost efficiency.
Maximizing Application Performance: How to Extract Practical Data from Your Network
How many applications do you use that exist only on the computer in front of you? Two? One? None at all? I occasionally use two applications that live locally on my computer, but all the rest, including every application I use for personal and professional work, are delivered over the internet. That’s pretty much where we are these days, isn’t it?
Overcoming data challenges in payment monitoring
The total transaction value of digital payments is projected to exceed $1.7 billion by the end of 2022. Each one of these transactions generates masses of data that contains critical insights for merchants, payment service providers, acquirers, fintechs, and other stakeholders in the payments ecosystem. Having real-time access to these insights has the power to drive growth through customer and market understanding.
AIOps for Managed Service Providers
Icinga DB Web search bar overview
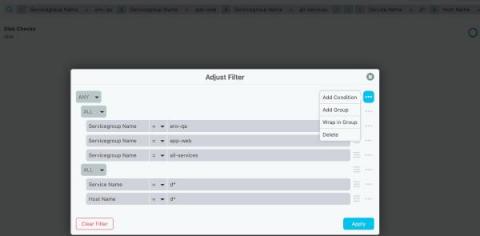
With Icinga DB Web you can filter the list views in a very elegant and lovely manner. If you haven’t tried this search bar yet, it’s time to begin now. Unlike in the monitoring module, where you have to tediously filter the views based on clicking through all the possible selections available to you, in Icinga DB Web it’s a very simple thing where you can do it instantly.
Announcing Logz.io's Data Optimization Hub
To help our customers reduce their overall observability costs, we’re excited to announce the Data Optimization Hub as part of our Open 360™ platform. The new hub inventories all of your incoming telemetry data, while providing simple filters to remove any data you don’t need. Gone are the days of paying for observability data you never use.
OpsRamp APIs - A Refreshing New Developer Experience
In the last two decades, the software industry has shifted away from on-premises applications to software-as-a-service (SaaS). SaaS now accounts for 70% of the business software market according to BetterCloud, and is worth more than $170bn annually, according to Gartner.
Slashing Development Costs in an Economic Downturn
A better developer experience: Applying observability to 3rd-party integrations
Third-party integrations are inevitable in development. Some functionality is outsourced as there is no need to develop something in-house that’s already working, while some integrations are performed to connect with the customer’s ecosystem to help them get their job done better.
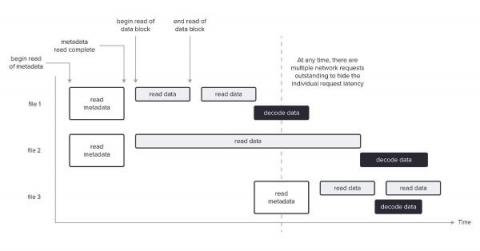
Querying Parquet with Millisecond Latency
We believe that querying data in Apache Parquet files directly can achieve similar or better storage efficiency and query performance than most specialized file formats. While it requires significant engineering effort, the benefits of Parquet’s open format and broad ecosystem support make it the obvious choice for a wide class of data systems.
How Prescient Devices Uses Time Series Data for IoT Automation
Companies need to consider both how fast they can put edge applications into action and update them, and how quickly they can process incoming data. Industrial processes are becoming increasingly automated as sensors on machines collect a growing amount of data. Much of this data is time-stamped and can help companies improve processes. This large volume of sensor data can become unwieldy if companies don’t manage it properly.
How to monitor JavaScript log messages and exceptions with Playwright
What a near motorcycle accident taught me about ServiceNow's CMDB
Back in my mid to late 20s, my most prized possession was my Yamaha R1 motorcycle. Living and working in the city of Milwaukee meant I didn’t need to worry about finding parking, gas was cheap, and it was fast, one of the fastest sport bikes on the market at the time. But with that speed and power comes great responsibility, and I took that responsibility seriously. If I was going to go out and meet friends, I promised myself, not one sip of alcohol.
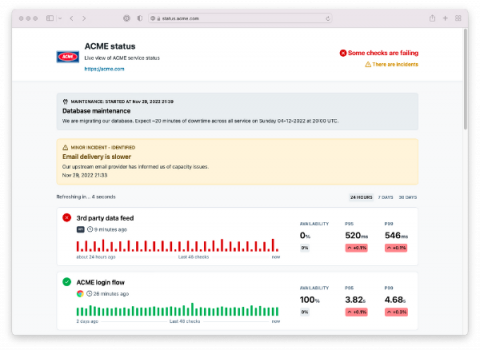
Announcing Incident Management and Updated Dashboards
Over the last few years, many customers have asked us to update our current public dashboards with new features so they can more effectively communicate what is happening with their checks to external customers or internal users. We’ve taken that input to heart, and we’re pleased to announce the availability of redesigned dashboards for Checkly.
Solving a Murder Mystery
Bugs can remain dormant in a system for a long time, until they suddenly manifest themselves in weird and unexpected ways. The deeper in the stack they are, the more surprising they tend to be. One such bug reared its head within our columnar datastore in May this year, but had been present for more than two years before detection.
Grafana 9.3 feature: New navigation updates
As Grafana has grown from a visualization platform to an observability solution, we’ve added many tools along the way. These tools are dedicated to help you throughout the software development life cycle, whether you are trying to prevent incidents, you are monitoring your application or infrastructure, or if you are in the middle of an incident.
Observability Data Needs Access and Control
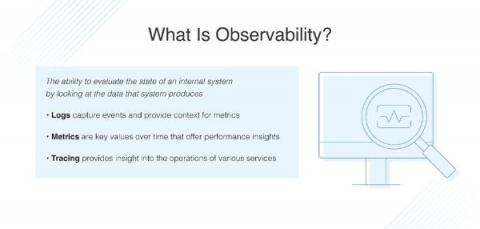
Observability is the ability to see and understand the internal state of a system from its external outputs. Logs, Metrics, and Traces, collectively called observability data, are external outputs widely considered to be three pillars of observability.
How Universal Profiling unwinds stacks without frame pointers and symbols
Elastic Universal Profiling is based on technology that came into Elastic as part of the acquisition of optimyze.cloud — a startup that had developed Prodfiler.com, the world’s first frictionless fleet-wide in-production multi-runtime profiler that was launched in August 2021. In order to bring the vision of frictionless deployability, low performance overhead, “just run it everywhere” magic to the broader market, a number of technical innovations were necessary.
DX Unified Infrastructure Management Overview
Configure pipeline alerts with Datadog CI monitors
CI pipelines have become an integral part of the development workflow, helping teams automate the continuous building and testing of new updates to application code. The growing importance of CI pipelines has naturally led to a need for increased visibility into their performance. In 2021, Datadog introduced CI Visibility to deliver granular performance metrics for each individual pipeline, allowing you to monitor build duration and related telemetry across all recent commits.
Making SNMP Monitoring Scalable, Reliable and Extensible with eG Enterprise
SNMP stands for Simple Network Management Protocol. It is an Internet Standard protocol for collecting and organizing information about managed devices on IP networks and for modifying that information to change device behavior. Figure 1: How SNMP works SNMP exposes management data in the form of variables on the managed systems organized in a management information base (MIB), which describe the system status and configuration.
Mobile: The Future is Declarative
The mobile development ecosystem has always been very diverse, arguably more diverse than the web development ecosystem. While it seems like every day there are more frameworks and tools for web developers, a lot of them are built on top of JavaScript and implement similar patterns to each other. The mobile ecosystem, on the other hand, has a core set of languages that make the differences between mobile tools and frameworks much easier to identify.
Exoprise Survey Finds 90% of Remote Workers Face Productivity Challenges Due to Ongoing IT issues
Outages ITOps professionals are thankful to avoid
As we settle into the time of year when we reflect on what we're thankful for, we tend to focus on important basics such as health, family and friends. But on a professional level, IT operations (ITOps) practitioners are thankful to avoid disastrous outages that can cause confusion, frustration, lost revenue and damaged reputations. The very last thing ITOps, network operations center (NOC) or site reliability engineering (SRE) teams want while eating their turkey and enjoying time with family is to get paged about an outage. These can be extremely costly - $12,913 per minute, in fact, and up to $1.5 million per hour for larger organizations.
NiCE VMware Management Pack 5.6 for Microsoft SCOM
Unlock business benefits by monitoring your VMware’s High Availability infrastructure. More performance, more availability, and more transparency. Get the most important advantages that extended VMware monitoring can offer with the new NiCE VMware Management Pack for Microsoft SCOM. Secure, protect, and manage large VMware environments and digital workspaces based on advanced analytics.
Catering to the Bespoke: How InfluxDB Meets Developers Where They Are
At InfluxData, we pride ourselves on building a platform – InfluxDB – for developers, by developers. It’s not enough to simply “talk the talk.” As an engineering leader, it’s really important to me that InfluxData “walks the walk,” too. This requires a holistic understanding of our users, their familiarity with time series, the environments in which they work, and the problems they’re trying to solve.
Welcome to Avantra 23
SCOM MI reporting - New SquaredUp Plugin
As you may have heard, Microsoft has just released the highly anticipated SCOM Managed Instance (SCOM MI) – cloud-hosted SCOM. In conjunction with this, we have launched a plugin for SquaredUp that lets you connect straight into SCOM MI and pull all the monitoring data you need!
How IT Can Save $400 per Endpoint in Less Than a Year
For IT and EUC teams, reducing costs is easier said than done. You can’t just blindly reduce headcount, delay transformation projects, or extend hardware lifecycles in the hopes of appeasing your CFO’s demands for short-term cost reduction. The reality is, rushed cost-cutting will put your service desk under pressure. In turn, such self-inflicted inefficiencies will only result in performance degradations, additional tickets, and escalations.
How to Reduce IT Costs without Increasing Incidents or Escalations
With organizations across industries facing inflationary pressures and the threat of recession, CFOs are forced to impose cost-cutting measures to improve cost efficiency across teams to tide through these tough times. This has resulted in IT teams being faced with a dilemma. How to improve the cost-effectiveness of the team without impacting employee satisfaction and service desk productivity?
Serverless roundup at AWS re:Invent 2022
AWS re:Invent was back and BIG last week in Las Vegas. Approximately 50,000 AWS customers and partners got together in Las Vegas to learn, talk shop, and maybe attend a couple of parties here and there. Not only did Lumigo have a booth, but our own Saar Tochner, R&D Team Lead and AWS Community Builder gave a well-received talk on Lambda extensions.
Cyber Attacks Are Getting Smarter... Are You Ready?
It feels like everything is getting a “smart” upgrade these days. From the cars we drive to how we operate our domestic appliances, almost every gadget has had a smart upgrade or now uses Artificial Intelligence (AI) to improve our lives – or so they claim…
Survey results reveal what matters most to online shoppers this holiday season
Digital experience is now as important as low prices for consumers, and pressure is on retailers to deliver incredible application performance.
8 Redis Monitoring Tools To Check Out
The open-source data platform Redis, based on in-memory data, is complicated enough when hosted only on one server. Therefore, a critical aspect of Redis management is monitoring its performance. Despite serving a vast number of queries, Redis is known for its low latency response time. Keeping track of your Redis instance's performance can be done by monitoring certain vital metrics. As well as storing data in memory and on disk simultaneously, Redis stands apart from most other databases.
Logging and global error handling in .NET 7 WPF applications
While developing elmah.io support for WPF, I had the chance to look into WPF for the first time in many years. I couldn't stop myself from digging down into all sorts of details about how logging has evolved in WPF since I last wrote a WPF app. In this post, I'll share some of the findings I made in this rediscovering journey.
Top 5 Tools for Rebranding Your Company Website
For a successful online business, branding is an essential aspect to consider. It transforms your business from a commodity found anywhere on the market into something special that only you can offer. Lucky for you, there are many apps and tools that can help your business thrive, scale up and improve its online presence, thus beating the competition.
Prioritizing Platform Stability at One of FastCo.'s Most Innovative Companies of 2022
The fitness industry is no stranger to ‘smart’ equipment, and what distinguishes one product from another ultimately comes down to user experience. Product success depends on stability, something top of mind for developers at Tonal. Ranked as one of New York Magazine’s best smart home training solutions 2022 and Men’s Health’s best connected cable machine 2022, Tonal literally sets the bar for smart home trainers.
The Case for Monitoring as Code
You build it; you own it! It’s a simple mantra that has driven software development for years. The days of writing software and throwing it over the wall to operations teams are over. Instead, software development teams take ownership of what they do and own their own software operations. There is just one problem: Monitoring tools have not yet adopted the developer workflow. As a developer, the repository is the center of the workflow. It's the one single source of truth.
How to Augment an Existing Data Lake with Exabeam and Cribl Stream
Organizations have different data lakes they use to search, whether it is Splunk, Qradar, or Sumo Logic just to name a few. Exabeam (UEBA Advanced Analytics) sits on top of those existing data lakes and pulls specific sources by running continuous queries every few minutes into Exabeam. The image below shows a Splunk query to pull windows event logs into Exabeam Advanced Analytics over the port (8089). The query is complex.
NetApp 101: Key Terms
Cloud Monitoring: Troubleshoot misfired alerts
A complete guide to managing Grafana as code: tools, tips, and tricks
We all know about the great things Grafana dashboards can do, and configuring them as code makes it possible to get even more out of them. These days, Grafana resources can mostly be managed as code in a declarative manner, which enables code review, code reuse, and in general, better workflows. This guide presents a few as code tools you can use to declaratively manage Grafana resources, plus some tips and tricks on how to incorporate them efficiently into your own use cases.
What is Proactive ScriptAssist and Why is it a Game-Changer?
Sometimes — not often, but every now and then — we come across an invention that is so remarkably useful, that we wonder: how did I survive without this? High speed internet comes to mind. So do GPS devices. And who wants to imagine a world without the cronut? Well, it’s time to add one more invention to the list: Proactive ScriptAssist. The Back Story Websites are not static things.
Graylog Labs: Graylog Reference Architecture
Highlights from AWS re:Invent 2022
Just like shopping on Black Friday, AWS re:Invent has become a post-Thanksgiving tradition for some of us at Datadog. We were excited to join tens of thousands of fellow AWS users and partners for this annual gathering that features new product announcements, technical sessions, networking, and fun. This year, we saw three themes emerge from the conference announcements and sessions.
Cost Comparison: How Scout Stacks up Against the Competition
APM tools are Application Performance Monitoring tools that help to evaluate, analyze, and monitor the application's performance. APM is a part of Application Performance Management. However, when it comes to Performance Management at an enterprise level, it is a broader concept in Managing the whole application infrastructure.
Applying OpenTelemetry for Deeper Observability
The observability market is maturing. This evolution is clearly visible in the rise of OpenTelemetry, an open source framework for application performance monitoring and observability.
CI Visibility Demo
Graylog 5.0 - A New Day for IT & SecOps
We are excited to announce the release of Graylog 5.0! Graylog 5.0 brings updates across our entire product line, including changes to infrastructure, Security, Operations, and our Open offerings. For more detailed information on what’s changed, visit our changelog pages for Graylog Open and Graylog Operations/Graylog Security.
What's New In Graylog V5
Suspect Commits via Git Blame
Errors are part of building software. Even if you are one of the fabled 10X engineers, errors are still going to happen. When an error does occur, typically you are going to look at the stack trace to understand the why and who for triaging. But figuring out who to assign an issue to just based on the stack trace can be difficult. How many times do you see a stack trace in a Sentry issue, head to GitHub, and try to figure out who changed the line of code in question? Often would be our guess.
Observability and Its Influence on Scrum Metrics
Scrum metrics are an essential indicator of your team’s progress. In an agile team, they help you understand the pace and progress of every sprint, ascertain whether you’re on track for timely delivery or not, and more. Although scrum metrics are essential, they are only one facet of the delivery process — sure, they ensure you’re on track, but how do you ensure that there are no roadblocks during development? That’s precisely where observability helps.
How to Optimize the DevOps Pipeline Through Developer Workflows
The DevOps pipeline is a crucial part of software development, but it can often get mired in bottlenecks. Most problems are caused by the development and operations teams having different responsibilities are due to inefficiencies in the pipeline design. However, thanks to continuous observability, DevOps now gets a new lease of life since it is possible to tweak the pipeline to suit the developer’s workflow.
ManageEngine named a Challenger in the 2022 GigaOm Radar for Network Validation
For over 16 years, ManageEngine Network Configuration Manager has enabled network admins to manage network device configurations and validate them—all while helping them stay compliant with international standards. Today, we are thrilled to announce that ManageEngine has been named a Challenger in the 2022 GigaOm Radar for Network Validation.
Transcending Observability for a Cloud-Native Future
With digital transformations continuing apace and the popularity of cloud-native and microservice-based applications and architectures growing, Gartner sees investments in such technologies and services increasing, predicting that "cloud-native platforms will serve as the foundation for more than 95% of new digital initiatives by 2025 - up from less than 40% in 2021."
How to improve website performance with multi-dimensional data
Metrics, metrics everywhere... a gauge here, a counter there... milliseconds, percentages... a list of variables running into pages... what is fast, what is slow...? how on earth is one to know...? Today we have all manner of variables around us, of differing gravity, that each have their own individual purpose in the measurement of web performance. Some of these are atomic or independent metrics, whereas others are aggregated or dependent.
Driving Cost-Efficient Transformations Without Impacting Quality
The only constant in the technology industry is CHANGE. We all know that while change may be a constant and has the potential to bring enormous benefits to an organization, change can also be incredibly disruptive. Technology trends such as Cloud, BYOD (Bring Your Own Device), virtual applications and desktops, and mobility have resulted in increased data volume, variety, velocity and complexity, and have turned IT operations management into an overwhelming challenge.
How flame graphs visualize continuous profiling data in Grafana Phlare
We recently announced a new open source project called Grafana Phlare. This highly available continuous profiling data source is built into Grafana core, allowing you to seamlessly monitor your profiling data. With continuous profiling, you can see which parts of your applications are consuming the most resources. You can then use that data to make any necessary tweaks to reduce consumption, which translates to lower costs.
InfluxDB Cloud Features New Query Experience
If seeing is believing, then the new UI for the InfluxDB query experience is sure to convert you. We are working on a new query/script editor and want you to try it out. Feel free to share your feedback with us so we can make it even better! Here are just some of the highlights of the new editor.
Why You Should Consider Dynamic Repurposing Instrumentation
As a developer, how much time do you actually spend writing code? According to this survey by The New Stack, developers spend less than one-third (32%) of their time writing new or improving existing code. And this is because they get stuck in multiple tasks that aren’t really part of their main responsibilities.
API Monitoring in SigNoz - Viewing details of any API over time
API Monitoring in SigNoz - Monitoring Key APIs with Dashboards
Monitor all your cloud services in Datadog with IsDown
In this article, we will explain how you can monitor all your cloud service status pages in Datadog with the help of IsDown.
Three Key Considerations for Deploying Best-of-Breed Observability | AWS reInvent 2022, Ed Walsh
Reduce Software License Cost through "Usage-Based" Application Optimization
Enterprises are looking at Software as the key differentiator to render faster services to their customers, which has led to an exponential rise in the number of Enterprise software being onboarded and deployed. The recent move to remote and hybrid working has accelerated this trend. Currently, IT teams are managing an average of 170+ Enterprise apps in large organizations and 70+ in small and medium organizations (Okta report).
What do you know about Pandora FMS Enterprise features?
We have talked many times about the life and miracles of Pandora FMS Enterprise version. We are very proud of it indeed! We are like the father of the kid who wins the football final of the school league or the mother of Halle Berry crying inconsolably when her girl received her Oscar. That’s why today, in Pandora FMS blog, we wanted to stop for a second to talk, summing things up, about our Enterprise version features.
Orange Slovensko
Galileo Active Monitoring (GAM) Quick Start Guide
Webinar Recap: What Is An Observability Pipeline?
Observability data is mission-critical for businesses that want to provide stellar customer experiences, remain secure and compliant, and mitigate risk. However, organizations are creating more data as they expand their digital presence. Its increasing volume and complexity have teams looking for solutions that enable them to better control that data, derive more value by making it actionable, and all while keeping their costs under control.
Multi-cloud vs. hybrid cloud networks: What's the difference?
In today’s digital landscape, application demands such as scalability, performance, and reliability push many IT organizations toward cloud-based networks. Initially, cloud providers’ main offering was managed, virtualized data storage and services, or cloud computing. As cloud ecosystems have matured, so have the tools, services, and use cases available to their customers.
Reduce Hardware Refresh Costs through "Performance-Based" Device Upgrade
In today’s Digital Workplace, Managing Hardware assets efficiently is every IT team’s mandate. Despite the uptick in the adoption of virtualization in various client-side components including end users’ desktops, Their PHYSICAL DEVICE – still plays a significant role in the overall digital experience and their Productivity. However, when it comes to Managing and Upgrading these Devices, most organizations decide to replace the device based on their age.
Program Outages: Why That Won't Happen With Scout
Here’s why Scout APM prevents Program Outages and supports your business with smooth operations We all know how we feel when there is a power outage. Think about that feeling for a user using your web application that is not working. Frustrating, huh? Well, the statistics out there are also swinging toward your defense. It was found that only 6% of customers using your application are willing to stay loyal to you after an outage, and 78% would just take the business elsewhere.
6 Key Factors for an Efficient DevOps Maturity Model
DevOps isn’t a sprint, it’s a marathon without a finish line in sight. Developers and IT teams join forces throughout the product life cycle, even in production, to achieve and maintain high-quality software that users love. It’s simple, and it works. In fact, according to Statista, DevOps/DevSecOps is the most practiced software development methodology globally, used by 35.9% of software development teams.
Monitoring high cardinality jobs with Grafana, Grafana Loki, and Prometheus
Ricardo Liberato is a consultant building solutions for corporate clients using the power of the Grafana ecosystem to tackle problems beyond the data center and into the business realm. Since 2006, I’ve been consulting for a Fortune 100 life sciences company building increasingly powerful observability solutions. We started with custom-built solutions, migrating to Grafana and Prometheus back in the Grafana 3 days.
Overview of DX NetOps Network Monitoring Software
Alerting from first principles
In this blog, we'll show you how Alerting for Graphite works. What do you need to look at when considering what you alert on, and where do those alerts go? An early warning system is only as good as its alarms.
Ability to import Grafana dashboards, Alerts based on ClickHouse queries and more advanced features - SigNal 19
Monitoring AWS Analytics and Services for Business Continuity
What is AIOps (artificial intelligence for IT operations)?
Deploying software to support the work of an enterprise is an increasingly complex job that’s often referred to as ‘devops.’ When enterprise teams started using artificial intelligence (AI) algorithms to more efficiently and collaboratively run these operations, end users coined the term AIOps for these tasks.
Microsoft SCOM for Office 365 Monitoring? There Is a Better Alternative.
Gartner predicts that spending on public cloud services will rise to 21% in 2023. Most organizations today support fully remote operations and use SaaS services from the cloud. But is your Microsoft Systems Center Operations Manager (SCOM) tool suitable for monitoring mission-critical services like Microsoft 365? Don't get us wrong - SCOM is a comprehensive monitoring tool for servers, infrastructure, and apps such as Exchange and SQL. However, the recently released Microsoft SCOM Management Pack for monitoring Microsoft 365 lacks clout.
Increase customer retention & stop leaving money in the shopping cart
We all know the pain and frustration associated with broken software. It's no secret that the internet is rife with broken links, slow pages, and broken shopping carts, often feeling like it's being held together with glue and duct tape. These issues aren't just causing frustration for customers; it costs businesses millions. According to the Consortium for Information and Software Quality, poor software quality cost US companies $2.08 trillion in 2020. Every interaction between a customer and your technology is an opportunity to build or destroy trust. People tend to have a poor memory when things go right, but oh boy, do they remember when something broke.
Create a Sentry Project (Video 1 of 9)
Create a GitHub Repo (Video 2 of 9)
Configure a Sentry Project (Video 3 of 9)
Connect GitHub and Sentry (Video 4 of 9)
Uploading GitHub CODEOWNERS to Sentry (Video 5 of 9)
Adding Source Maps for JavaScript Projects (Video 6 of 9)
How to Fix Stack Trace Linking (Video 7 of 9)
Automate Sentry Releases with GitHub Actions (Video 8 of 9)
Resolving Issues in GitHub via Sentry (Video 9 of 9)
FluentD vs Logstash - Choosing a Log collector for Log Analytics
A Simplified Guide to OpenTelemetry
A day in the life of a Customer Support Detective
I open my laptop and look over my cases while I slurp down my first cup of coffee. Most of my backlog is waiting on customer updates, or bug fixes. Two of my cases have been marked for closure. Not a bad start for a Monday! A pod CrashLoopBackoff issue was resolved by bumping up memory requests, and the missing metrics issue was solved after applying some Prometheus annotations to the customer’s nginx pods. I notate and close both cases. No sooner do I hear the beep of the badge scanner.
How to Setup InfluxDB, Telegraf and Grafana on Docker: Part 2
This tutorial describes how to install the Telegraf plugin as a data-collection interface with InfluxDB 1.7 and Docker. In Part 1 of this tutorial series, we covered the steps to install InfluxDB 1.7 on Docker for Linux instances. We describe in Part 2 how to install the Telegraf plugin as a data-collection interface with InfluxDB 1.7 and Docker.
Resource Guide for InfluxDB and AWS
InfluxDB Cloud runs natively on AWS. This is great for users that already rely on AWS because it keeps everything (or at least most things, hopefully!) in one place. This can also reduce data latency, if the region you use is geographically close to your data sources. Plus, it’s super easy to get started using InfluxDB on AWS. One of the great things about AWS is that it has a ton of different services and features that allow you to do more with your data.
Cloud Monitoring: A Complete Guide
Cloud monitoring is the process of tracking, reviewing, and managing the health and security of cloud-based systems and applications. Cloud monitoring is essential for any organization that relies on cloud-based applications and services. It provides visibility into the performance of these systems and can help identify potential issues before they cause downtime or data loss.
Grafana Loki 2.7 release: TSDB index, Promtail enhancements, and more
Grafana Loki 2.7 has arrived! With it comes an experimental feature we are rather excited about: a redesigned index based off of the Prometheus TSDB index. While we are still in the early stages, this enhancement in Grafana Loki, which we previewed at ObservabilityCON 2022, creates a smaller storage footprint, better query performance, and much more that we will dive into below!
Peering? ...in this Economy?
Peering is great for quality and cost savings, but how do you ensure your network is up to the task? Capacity planning is a classic task that should be very familiar to network operators. Providing the right capacity at the right time is crucial to finding a balance between cost and quality in your network.
Product Spotlight: Logz.io Telemetry Collector for Fast Data Shipping
Today we’re excited to announce Logz.io Telemetry Collector – an agent that can send logs, metrics, and traces to Logz.io in a single installation as part of our Open 360™ platform. With Telemetry Collector, customers can get started monitoring their services with Logz.io faster than ever by simplifying the data collection process.
Production testing: smoke tests with Cypress, CircleCI, and AWS
“Testing your production environment” refers to the practice of running tests on production servers, using actual data from real users. Production testing doesn’t replace other methods like unit or integration testing. Instead, it extends them. Smoke testing is one approach that Lumigo has implemented to test our own production environments.
Insurance Policy for Microsoft Teams Quality of Service is More Than Just A 'Nice to Have'
Like any piece of tech, sometimes things can go wrong on a Microsoft Teams call. But, as a business, you want to maintain productivity at all times, through a positive user experience, that isn’t impacted by drops in service. Having coverage when it comes to Teams might seem like a ‘nice to have’ but it’s actually a lot more than that when it comes to Microsoft Teams quality of service. You wouldn’t skip insurance, after all.
How to run all your Playwright test steps with soft assertions
Monitor More, Faster with WhatsUp Gold's Out-of-the-Box Features
Too many tools? Best practices for planning and implementing a successful IT tool consolidation strategy
How You Can Work with Microsoft And Telcos To Tap Into Global Business Infrastructure
Microsoft does a great job investing in its network, to the point where it has the second-largest reach of any business in the world. Tapping into that connectivity, and the partner telcos who help make it happen, is a big factor in getting the best Teams service quality available.


