Operations | Monitoring | ITSM | DevOps | Cloud
May 2023
What are the Levels of Automation and How Can AIOps Help You Move Forward
Key metrics for application performance monitoring
High availability and flawless performance of business applications are vital to maintaining a company’s online reputation and keeping its customers satisfied. If a business-critical application crashes, frustrated users may abandon the service, leading to a loss in brand value and revenue. Internal business application performance issues can also cause a drop in employee productivity. To prevent these performance issues, enterprises turn to application performance monitoring solutions.
How to Diagnose Internet Problems in Your Network
In today's digital age, a reliable and high-speed Internet connection is vital for the smooth operation of businesses. From communication and collaboration to accessing cloud-based services and online transactions, a stable internet connection is crucial for ensuring productivity and efficiency. However, despite the advancements in technology, network issues can still arise, leading to frustrating downtime and hampering business operations.
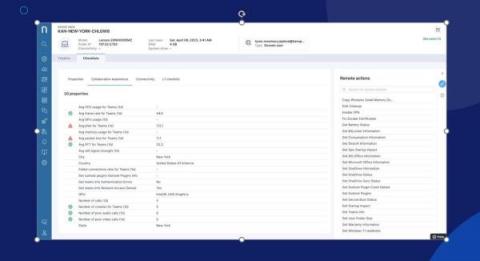
Troubleshooting Microsoft Teams
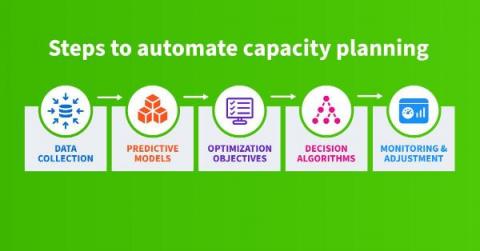
Automating Capacity Planning for IP Networks: A Journey into the Future
By automating capacity planning for IP networks, we can achieve cost reduction, enhanced accuracy, and better scalability. This process requires us to collect data, build predictive models, define optimization objectives, design decision algorithms, and carry out consistent monitoring and adjustment. However, the initial investment is large and the result will still require human oversight.
Derive Insights from Machine Data with InfluxDB
The panel discussion “From Machine Data to Business Insights, Building the Foundations of Industrial Analytics” discussed modern methods and benefits of deriving insights from machine data. InfluxDB Developer Advocate Jay Clifford explained the trend now is to “allow the builders to bring the Lego blocks and build them together how they see fit.
Set Up Tracing for a Node.js Application on AppSignal
Node.js is a very popular JavaScript runtime for the backend. Its usage has grown steadily in the past years. Some notable users of Node.js include Netflix, PayPal, Uber, and eBay. In this post, you will learn how to add tracing to a Node.js application on AppSignal. You will use an existing Quotes app that talks to a PostgreSQL database to fetch the quotes. Let’s get going!
Grafana Labs partners with GitHub to enable secret scanning
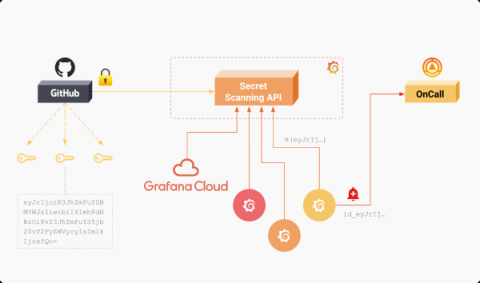
As part of our ongoing commitment to security, we are excited to announce we have partnered with GitHub to protect our users on public repositories via GitHub’s secret-scanning feature. Through the partnership, GitHub will notify Grafana Labs when one of the following secret types is exposed in the code of a public repository: GitHub actively monitors public repositories for leaked secrets. When a secret is detected, its hash is stored in Grafana Labs’ Secret Scanning API.
What are infrastructure monitoring metrics?
Nowadays businesses rely heavily on robust and resilient infrastructure to deliver uninterrupted services to their customers. This includes things like servers, databases, and cloud-based systems. It’s important to monitor the health and performance of this infrastructure, and that’s where monitoring metrics come in.
Reduce MTTR and Address the Talent Gap with Logz.io Alert Recommendations
When our CEO and co-founder Tomer Levy delivered his “Observability is Broken” presentation at last year’s AWS re:Invent, he highlighted numerous challenges faced by today’s organizations as they seek to advance their observability practices. Of the six individual points that he noted, two specifically dealt with the current shortage of available engineering expertise, with another two focused on data overload.
The Quixotic Expedition into the Vastness of Edge Logs, Part 1: Analyzing Numerous Cribl Edge Nodes with Cribl Search
Cribl Search is a powerful tool that is designed to enhance your data search efficiency, irrespective of the location of your data. This blog will explore how this tool seamlessly integrates with numerous Cribl Edge Nodes in real time, simplifying the process of discovery and troubleshooting. An integral part of Cribl Search is the “teleport” feature, which enables users to access specific Edge Nodes for in-depth analysis, simply by clicking on a host field.
Sentry Frontend Error Monitoring 101
Using Retry Insights to Identify Flaky Checks
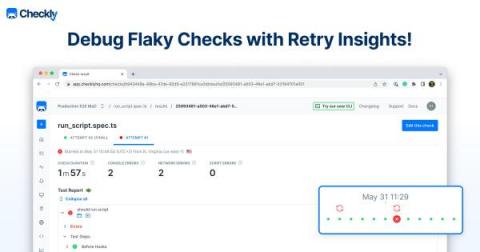
As you know, having reliable checks is a cornerstone of synthetic monitoring. We don’t want false alarms, or worse, checks succeeding when things aren’t working. But sometimes, problems can be hard to identify because they only happen intermittently, or in certain situations. Similarly, monitoring results can be skewed by infrastructure issues, or network errors on the monitoring provider end, causing false alarms when there is actually no problem with the product.
Goliath Changes the Paradigm with Industry-Only User Experience Scoring & Benchmarking
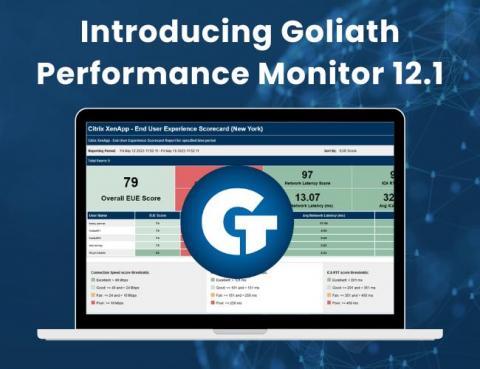
Philadelphia, PA – May 31, 2023 – Goliath Technologies, a leader in end-user experience monitoring and troubleshooting software, today announced the launch of Goliath Performance Monitor 12.1, empowering IT to do more with less.
How to ensure HTTP notification delivery
InfluxDB Cloud Serverless UI Tour - InfluxDB 3.0
Alerting with Grafana and InfluxDB Cloud
New Check Type this May: Page Speed Monitoring!
The Uptime.com Page Speed Check has arrived! 🚀 We’ve rebuilt our old Website Speed free test using the most up-to-date analytics, metrics, and auditing tools available to make sure that your websites are performing as expected, every single hour of every day. Keep reading to see exactly how our new Page Speed Check can take your website monitoring and observability to the next level.
Kubernetes Architecture Part 1: Reasons to Choose Kubernetes
This Kubernetes Architecture series covers the main components used in Kubernetes and provides an introduction to Kubernetes architecture. After reading these blogs, you’ll have a much deeper understanding of the main reasons for choosing Kubernetes as well as the main components that are involved when you start running applications on Kubernetes. This blog series covers the following topics.
Sumo Logic Log Analytics intro
Best Bee-haviors: Revamping Feature Flags with Nathan Lincoln
From Spotify to Open Source: The Backstory of Backstage
Technology juggernauts–despite their larger staffs and budgets–still face the “cognitive load” for DevOps that many organizations deal with day-to-day. That’s what led Spotify to build Backstage, which supports DevOps and platform engineering practices for the creation of developer portals.
Elevate Customer-Facing Contact Centers with Nexthink
Contact centers (or call centers) are crucial touchpoints for customer interactions across various channels, including phone, email, SMS, live chat, and more. As businesses strive to deliver exceptional customer experiences (particularly in high-volume consumer-facing industries such as financial services, telecom, travel, insurance, healthcare, online retail, etc.), it’s imperative to optimize contact center performance. How imperative?
What is Palo Alto Panorama?
5 Ways You Can Utilize Observability to Make Your Next Migration Easier
When people hear the word “migration,” they typically think about migrating from on-prem to the cloud. In reality, companies do migrations of varying types and sizes all the time. However, many teams delay making critical migrations or technical upgrades because they don’t have the proper tools and frameworks to de-risk the process.
ChatGPT and Elasticsearch: APM instrumentation, performance, and cost analysis
In a previous blog post, we built a small Python application that queries Elasticsearch using a mix of vector search and BM25 to help find the most relevant results in a proprietary data set. The top hit is then passed to OpenAI, which answers the question for us. In this blog, we will instrument a Python application that uses OpenAI and analyze its performance, as well as the cost to run the application.
Using the Trace Query Builder to plot error percentage for a service in SigNoz
OpsLogix at SCOMAthon 2023 - SCOM Open Source Monitoring in practice
What is an Internal Developer Platform (IDP) and Why It Matters
In today's evolving technological landscape, enterprises are under increasing pressure to deliver high-quality software at an accelerated pace. Internal Developer Platforms (IDPs) provide a centralized developer portal that empowers developers with self-service capabilities, standardized development environments, and automation tools to accelerate the software development lifecycle. In this week's blog, we're taking a closer look at internal developer platforms and how implementing IDPs is helping organizations overcome the complexity of modern software development and increase developer efficiency to accelerate the delivery of software products.
From Business Challenges to Solutions: The Requirements of Being a Solution Architect
Imagine being at the helm of a technological maze, ready to decipher and implement emergent trends like artificial intelligence, edge computing, and microservices. The impact is enormous - enabling efficient business operations and fostering growth. Enter experienced Solution Architects. As the lifeblood of the business strategy and as a Solution Architect, you transform complex challenges into innovative opportunities.
Why you should prioritize VMware performance monitoring in the face of rising server virtualization
Virtualization has been a rising trend in IT. A recent study of the server virtualization market revealed that in 2019, only half the servers in the world (55.6%) were purely physical, the remainder being virtual. Among virtual servers, VMware had the largest share at around 20.8%. The use of virtual servers has grown to the extent where this blog you’re currently reading is probably hosted on a virtual server.
Amazon Security Lake & ChaosSearch deliver security analytics with industry-leading cost & unlimited retention
Top 10+ Best Log Monitoring Tools & Software: Free & Paid [2023 Comparison]
In the rapidly evolving digital landscape companies are facing an increasing number of challenges in maintaining their IT infrastructure, and ensuring application stability. It is critical to stay on top of all the information to ensure the health of the organization and the business side of it. One of the ways to achieve visibility is to use a log monitoring tool to centralize the log data coming from each application and infrastructure element.
Top strategies for Network Performance monitoring
Networks today span the world and provide many connections between geographically disparate data centers, and public and private clouds. This creates a variety of network management problems. If your network is not working properly, it can be very difficult or even impossible to get the most productive or correct operation of your applications. A sophisticated network requires constant monitoring using the right tools and creating a network performance monitoring strategy.
Top network switches to use
When you set up on-premise digital infrastructure, it is crucial to enable your devices to communicate with each other. The devices on your network should be able to send and receive data packets to handle requests and send responses back to callers. One of the components that allow data transmission to the proper destination is the network switch. The network switch plays an important role in distributing data packets to devices.
What is Applied Observability?
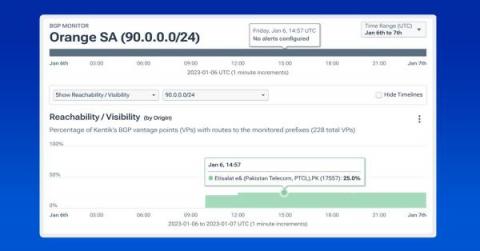
What Is BGP and Why Is It Important?
When you send an email or load a website, you probably never think about how the data gets from your computer to the server that needs to process it. But something does have to decide how the data will move across the vast expanse of the Internet – and, in particular, which of the virtually infinite number of potential routes your data will take as it moves from your device to a server and back again.
Always Empowering: We are SolarWinds
Monitor your firewall logs with Datadog
Firewall systems are critical for protecting your network and devices from unauthorized traffic. There are several types of firewalls that you can deploy for your environment via hardware, software, or the cloud—and they all typically fall under one of two categories: network-based or host-based. Network-based firewalls monitor and filter traffic to and from your network, whereas host-based firewalls manage traffic to and from a specific host, such as a laptop.
Teams and Zoom - Companies Need More than Out-of-the-box Vendor Telemetry
Companies using Zoom and Microsoft Teams as their real-time employee collaboration solution have access from their vendor(s) to the call and session data telemetry gathered by their solutions via a vendor-supplied API. But is this enough for effective management of collaboration tool performance in the enterprise digital workplace?
How To Improve the Performance of SaaS Applications using Nexthink - Application Transactions
We have seen in the Series 1 of How To Improve the Performance of SaaS Applications using Nexthink on how Nexthink Application Experience could be leveraged to proactively monitor Page load times of Web Applications to improve user experience and application performance for increased business value.
Revolutionizing SAP observability: The Elastic-Kyndryl partnership
Across industries and geographies, businesses rely heavily on Systems Applications and Products (SAP) systems. These powerful and versatile systems streamline operations and manage critical data spanning areas like finance, human resources, and supply chain. However, the real-time monitoring of these systems, with an in-depth understanding of performance metrics and quick anomaly detection, is paramount for smooth operations and business continuity. It's here that our unique offering steps in.
Are Your Data Pipelines Up to Commercial Standards?
In the data business, we often refer to the series of steps or processes used to collect, transform, and analyze data as “pipelines.” As a data scientist, I find this analogy fitting, as my concerns around data closely mirror those most people have with water: Where is it coming from? What’s in it? How can we optimize its quality, quantity, and pressure for its intended use? And, crucially, is it leaking anywhere?
Infrastructure is Fundamental: Learn Your Hybrid Cloud ABCs
In 21st-century business, computing is what makes daily operations, competitive advantage, and strategic growth possible. The foundation that enables this is a hybrid cloud infrastructure that supports business requirements, delivers a suitable user experience, and stays on budget. Mastering the ABCs of infrastructure performance management (IPM) will put you on the road to long-term success.
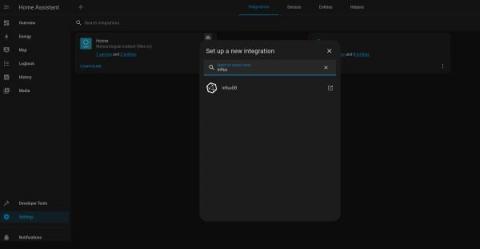
How to Integrate Grafana with Home Assistant
This post covers how to get started with Home Assistant and Grafana, including setting up InfluxDB and Grafana with Docker, configuring InfluxDB to receive data from Home Assistant, and creating a Grafana dashboard to visualize your data. It provides a comprehensive guide for real-time monitoring and analysis of Home Assistant data. In this tutorial, you’ll learn how to integrate Grafana with Home Assistant using InfluxDB.
How to Use OpenTelemetry & JavaScript Together: A Tutorial
This post was written by Siddhant Varma. Scroll down for the author’s bio. Observability is an essential aspect of a healthy software architecture and a highly performant system. It enables developers and engineers to understand and dive deeper into how their application behaves. This in turn helps them monitor it effectively.
Observability is a practice, not a job
Engineering organizations that ship fast have Observability as part of their core DNA.
The new ransomware-as-a-service (RaaS) operation MichaelKors
Rollbar New Item Detail Training
How Traceloop Leverages Honeycomb and LLMs to Generate E2E Tests
At Traceloop, we’re solving the single thing engineers hate most: writing tests for their code. More specifically, writing tests for complex systems with lots of side effects, such as this imaginary one, which is still a lot simpler than most architectures I’ve seen: As you can see, when an API call is made to a service, there are a lot of things happening asynchronously in the backend; some are even conditional.
Optimizing Website Performance: Harnessing the Power of Image Lazy Loading
In today’s fast-paced digital world, website speed is crucial in retaining attention. One of the ways to achieve faster website loading times is by implementing Image lazy loading. This technique ensures images are loaded only when visible on the user’s screen, reducing the initial load time and improving the website’s overall performance. In this article, we will explore the concept of image lazy loading, how it works, and the different methods to implement it on a website.
Revealing User Intent
What is Citrix NetScaler, and how does it work?
404 error pages: Examples and best practices for custom 404 error pages
A 404 error page, commonly known as a page not found or simply a 404 page, indicates that a user has arrived at the requested site, but the URL is empty. Let's look at the URL address https://www.site24x7.com/blog as an example.
AWS ECS Monitoring | Breaking out of the observability vendor lock-in with SigNoz
Azure Data Factory Monitoring and Alerting: The Ultimate Guide
How to start monitoring your ClickHouse instance or cluster with Grafana Cloud
ClickHouse is an open source, column-oriented database management system designed for OLAP (analytical) workloads. ClickHouse supports various data formats and SQL queries, and is popular for clickstream analysis as well as log processing use cases. We are pleased to announce that ClickHouse now has a dedicated observability integration in Grafana Cloud, which makes it easy to troubleshoot issues, track potential latency, and prevent data loss.
Observing the Future: The Power of Observability During Development
Just when you thought everything that could be shifted left has been shifted left, we’re sorry to say you’ve missed something: observability. Modern software development—where code is shipped fast and fixed quickly—simply can’t happen without building observability in before deployments happen. Teams need to see inside the code and CI/CD pipelines before anything ships, because finding problems early makes them easier to fix.
Understanding MTTR Networking: How to Improve Incident Response Time
As organizations continue to shift their operations to cloud networks, maintaining the performance and security of these systems becomes increasingly important. Read on to learn about incident management and the tools and strategies organizations can use to reduce MTTR and incident response times in their networks.
How To Improve the Performance of SaaS Applications using Application Transactions with Nexthink
We have seen in the Series 1 of How To Improve the Performance of SaaS Applications using Nexthink on how Nexthink Application Experience could be leveraged to proactively monitor Page load times of Web Applications to improve user experience and application performance for increased business value. Let us see in part 2 of this series how Nexthink could be leveraged to monitor Application Transactions.
Prometheus Sample Alert Rules
Prometheus is a robust monitoring and alerting system widely used in cloud-native and Kubernetes environments. One of the critical features of Prometheus is its ability to create and trigger alerts based on metrics it collects from various sources. Additionally, you can analyze and filter the metrics to develop: In this article, we look at Prometheus alert rules in detail. We cover alert template fields, the proper syntax for writing a rule, and several Prometheus sample alert rules you can use as is. Additionally, we also cover some challenges and best practices in Prometheus alert rule management and response.
Kafka monitoring: Message brokers observability and troubleshooting
Message brokers like Kafka enable microservices to scale. But this same quality makes them hard to troubleshoot. How can developers avoid messages and errors getting stuck in oblivion? In this post we look at a few solutions: Kafka Owl, Redpanda, and Helios.
Data Shows Outage Time & Costs are Increasing - 3 Solutions You Should Consider
The Uptime Institute recently released its Annual Outage Analysis 2023 report. Overall, the report highlights the increasing costs, frequency, and duration of outages, the prominent role of cloud and digital services in outages, the shortcomings of service providers, and the need to address human error and management failures. It also underscores the ongoing challenges of handling failures in complex distributed architectures.
10 Incident Management Best Practices
Before we dive into the nitty-gritty of incident management, let’s look a bit closer at the actual meaning of ‘incident.’ In the world of IT service management, the official definition for ‘incident’ is an “unplanned interruption to an IT service or reduction in the quality of an IT service.” Whether that means a slowdown in response time or a total system crash, you’re looking at an incident.
Webinar recap: FinOps for Managed Service Providers
Missed our latest webinar on FinOps for MSPs? We’ve got you covered! This blog post will cover what the FinOps experts discussed and the main things to remember. FinOps are revolutionizing MSP operations by adding a data-driven approach to cost management. This method helps MSPs optimize their cloud usage, provide white-glove support to customers, and give visibility on their expenses.
Real User Monitoring - Beginners Guide
Do you know what your website users are really experiencing? Are they satisfied with your website's performance? Are they able to easily navigate and find what they're looking for? Real User Monitoring (RUM) is a powerful technique that can answer these questions and more. By collecting and analysing data on real user interactions, RUM provides valuable insights into user behaviour, website or application performance, and overall user experience.
SIEM Tools: For Enhanced Threat Intelligence and System Security
SIEM is an overarching mechanism combining Security Event Management (SEM) and Security Information Management (SIM). It is a combination of different tools such as Event Logs, Security Event Logs, Event Correlation, SIM etc. These work in tandem to provide you an up-to-date threat intelligence infrastructure and enhanced security for your applications and hardware.
Understanding Metrics, Events, Logs and Traces - Key Pillars of Observability
Understanding Metrics, Logs, Events and Traces - the key pillars of observability and their pros and cons for SRE and DevOps teams.
What is End-to-End Network Monitoring?
24 Best End-to-End Network Monitoring Tools for 360-Degree Network Visibility
How to throw custom exceptions inside Logic Apps: Using default capabilities - Avoiding too many condition actions (Part III)
How To Monitor A Linux Virtual Machine
The use of virtualization in modern computing is becoming indispensable. Virtualization allows users to operate numerous operating systems on a single physical machine, which boosts productivity, lowers costs, and makes maintenance easier. But It's crucial to conduct periodic checks on a Linux virtual machine to make sure it's operating smoothly and effectively.
Agent and agentless: An ongoing battle
Observability of an SAP environment is critical. Whether you have a large complex and hybrid environment or a small set of simply architected systems, the importance of these systems is probably crucial to your business. Just thinking about system outages keeps us up at night, let alone the pressure of system performance, cross system communication and proper backend processing.
A BIG Thank You from NiCE
Thank you for being part of this year’s SCOMathon, covering 11 hours of pure Microsoft System Center Operations Manager topics delivered by leading subject matter experts. To take you even further on your exciting SCOM journey, NiCE offers free, one-to-one Azure SCOM MI consulting tailored to your technical expertise. Monitoring with Azure SCOM MI and the good old on-prem SCOM environments is clearly seeing a hype.
OpenSearch vs Solr: Which One Is Better to Use?
If you’re looking for a short answer on OpenSearch vs Solr, here’s a flow chart: We normally recommend the one you (or your team) already know or the prefer because, for most projects, there’s not that much in it in terms of features. Both search engines are well supported and have strong communities behind them. That said, there are significant differences, too.
Crash Course on Building and Monitoring AWS CDK Apps
Virtana Platform Overview
All the Hard Stuff Nobody Talks About when Building Products with LLMs
Earlier this month, we released the first version of our new natural language querying interface, Query Assistant. People are using it in all kinds of interesting ways! We’ll have a post that really dives into that soon. However, I want to talk about something else first. There’s a lot of hype around AI, and in particular, Large Language Models (LLMs).
Monitoring smart cities with Grafana, Timescale, and Sentilo
Miquel is a Project Manager at Seidor Opentrends, focused on smart cities, data, and IoT projects. Seidor Opentrends, which is headquartered in Barcelona and has offices around the world, provides end-to-end, high quality IT transformation services and serves as a consultant on open source and software architecture for municipalities throughout Spain. At Seidor OpenTrends, we build and maintain Sentilo, an open source sensor and actuator platform for smart cities.
Top 10 Website Monitoring Tools of 2023
In today’s digital landscape, where websites and online services play a crucial role in businesses’ success, having continuous uptime and optimal performance is of the utmost importance. This is where website monitoring tools come into the picture. Monitoring tools act as our vigilant sentries, constantly watching over our websites, servers, and applications to detect any issues that may affect their availability or performance.
Elastic for Public Sector
Gain visibility into your Cloudera clusters with Datadog
Cloudera Data Platform (CDP) is a data analytics and management platform that enables users to centralize, visualize, and govern their data. While users may be accustomed to data analytics solutions that are completely siloed and difficult to scale, CDP is designed to be flexible, giving customers the ability to integrate with open source technologies and deploy in a hybrid, cloud-native, or multi-cloud environment.
Maximizing ROI By Reducing Cost of Downstream Observability Platforms With BindPlane OP
Two Methods for Connecting to InfluxDB 3.0
InfluxDB 3.0 has 10x better storage compression and performance, supports unlimited cardinality data, and delivers lightning-fast SQL queries compared to previous versions. These gains are the result of our new database engine built on top of Apache Arrow. Apache Arrow processes huge amounts of columnar data and provides a wide set of tools to operate effectively on that data.
Everything You Need to Know About Google Cloud Logs
As the affordable choice for cloud computing, Google Cloud Platform (GCP) is catching up to its competitors, like AWS and Microsoft Azure. As a business, you need the speed and scalability that the cloud provides, but you want to limit your costs to ensure you hit revenue targets. With GCP, you found a digital services business partner to help you meet your business objectives, a technology that gives you the service availability you want at the speed you need.
How to sort errors in Raygun Crash Reporting
How to drill into error details with Raygun Crash Reporting
Application Experience: Improve Employee Productivity with Smarter Monitoring
The explosive growth of web applications has created a serious blind spot for End User Computing (EUC) teams. While a few of the most business-critical custom web applications built by company DevOps teams are instrumented with Application Performance Management (APM) tools, the remaining commercial SaaS applications, whether customized/extended or “out-of-the-box” are a complete blind-spot.
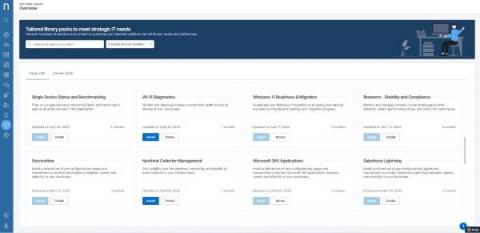
What is the Nexthink Library? An Introduction to Nexthink's Out-of-the-Box Solutions
Customers invest in Nexthink to see, diagnose, and fix problems before they occur, resolve critical disruptions, and improve overall digital employee experience to drive workforce efficiency. But after initial implementation of your new DEX platform, where do you begin? You have a robust set of measured KPI’s that must be achieved to fulfill the business requirements outlined by key leadership stakeholders, and an entirely new platform to learn how to use.
Deleting Null or Empty Values
SRE vs Platform Engineering
What's the difference between SREs and Platform Engineers? How do they differ in their daily tasks?
Discussing Future Roadmap and Next Steps | Netdata Office Hours | May 24th 2023
Building a context-driven dashboard
CloudWatch Logs to S3: The Easy Way
How To Monitor Mobile Game Application Performance
As a mobile game developer, there are many components of your game that you need to monitor. Everything from the servers that are hosting your game, to your best players, and your best-converting actions. That’s a lot of data, and it’s hard to know how to get the most out of that data. This article will look at the KPIs (Key Performance Indicators) you need to monitor, the best tools for monitoring these metrics, and how to handle this data in the most effective way.
Four steps to managing your Cloud Logging costs on a budget
Follow these best practices to learn how to get the most out of your Google Cloud and third-party logging infrastructure for the lowest cost.
This Month in Datadog: Data Streams Monitoring, OpenAI Integration, CoScreen V5, and more
How APM solutions enhance JMeter load testing visibility - Bridging the gap!
As an SRE and DevOps evangelist, I talk to many customers and prospects, most of whom run load and stress testing as part of their application delivery chain, often using JMeter for load testing. Many of them have a misconception: “I have JMeter and I am all set from a performance/ scalability perspective. I don’t need any other tools”.
Coralogix vs. New Relic: Support, Pricing and More
More platform teams owning multi-tenant systems need a full-stack observability solution that aggregates volumes of data into logs, metrics and traces. In tandem, there’s a growing number of major players in the observability industry, including New Relic. This post will compare some key features between Coralogix vs. New Relic. We will also go over what customers are looking for when choosing a complete observability platform.
Tracealyzer 4.8 is coming in June
Tracealyzer version 4.8 will be released in the first week of June, with major optimizations and improvements for Zephyr RTOS, and support for 64-bit target processors (FreeRTOS, Zephyr and SafeRTOS only). In addition, the ESP32 support is upgraded to use the latest TraceRecorder library, supporting all recent versions of ESP-IDF up to v5.2 dev. Snapshot tracing is now primarily supported by the implementation for streaming mode, using the RingBuffer stream port.
User-Centric Prioritization of your Bugs
How to manage CVE security vulnerabilities with Grafana, MergeStat, and OSV-Scanner
Patrick DeVivo is a software engineer and founder of MergeStat, an open source project that makes it possible to query the contents, history, and metadata of source code with SQL. The security posture of software supply chains has been a significant topic lately. Recent high-profile breaches have shown the importance of managing risks from third party code. Take, for example, the Log4Shell vulnerability (tracked as CVE-2021-44228 — Grafana Labs was not affected).
What to Consider for Monitoring Network Latency
In a perfect world, data would move over the Internet in real time. There would be no delays whatsoever between when one computer sends data out over the network and when it reaches the recipient. In the real world, however, there is always some level of delay when exchanging data over the network. That delay is measured in terms of network latency. Ideally, network latency is so low that no one notices it.
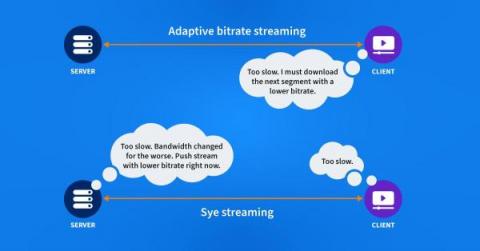
The Subtle Details of Livestreaming Prime Video with Embedded CDNs
Live sports have moved to the internet and are now streaming instead of being broadcast. Traditional streaming protocols have a built-in delay that challenges the experience of a live game. Amazon Prime has found a solution by combining a new protocol with a very distributed CDN.
Traceroute InSession: Catchpoint's effort towards a more reliable network diagnostic tool.
Since its inception in 1988, the traceroute has undergone several variations. You might be wondering, ‘Why so many?’ The answer is simple: achieving traceroute functionality has been a balance between security and utility. Whenever malicious actors exploited firewall and router vulnerabilities, their vendors responded with fixes and solutions which impacted the traceroute algorithms.
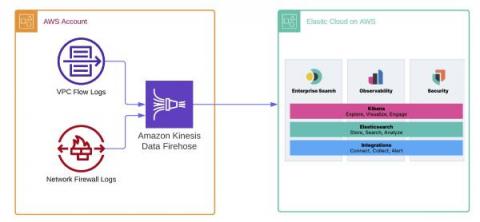
Unleash the power of Elastic and Amazon Kinesis Data Firehose to enhance observability and data analytics
As more organizations leverage the Amazon Web Services (AWS) cloud platform and services to drive operational efficiency and bring products to market, managing logs becomes a critical component of maintaining visibility and safeguarding multi-account AWS environments. Traditionally, logs are stored in Amazon Simple Storage Service (Amazon S3) and then shipped to an external monitoring and analysis solution for further processing.
Cloud Trends to Watch in 2023: Cloud Cost, Cloud Spend & More
Understand your Azure Active Directory Sign-Ins with KQL
When Azure AD is configured to record Sign-In activity, Kusto KQL can be used to gain valuable insights. This blog walks through common needs and shows how to visualize them in SquaredUp. Ruben Zimmermann is an Infrastructure Architect at a large manufacturing company who likes Azure, KQL, PowerShell and, still, SCOM.
Contributing to Sumo Docs: Simple Edits
Session Replay for Developers: Your Shortcut to Faster Troubleshooting
The 4 Best Status Page Software for 2023
As someone tasked with handling the pitfalls and consequences of unwanted downtime, it can be difficult to keep up to date with the latest software developments working to address these undesirable yet inevitable situations. And yet, whilst recognizing this fact is a necessary condition of overcoming such challenges, it is not in itself sufficient to meet the task.
Grafana Cloud k6: What's new and what's next?
To ensure the best possible end-user experience, engineering teams must be able to seamlessly transition from performance testing to problem resolution, breaking down any silos that exist between the two. That’s why, earlier this year, Grafana Labs launched Grafana Cloud k6, a unified platform that natively integrates the Grafana k6 performance testing experience directly into Grafana Cloud.
InfluxDB + Polars
A Guide to Different Types of Network Monitoring Tools: Unveiling the Superheroes
El Salvador's government health care institution delivers exceptional medical services leveraging OpManager
Instituto Salvadoreno del Seguro Social (ISSS), an El Salvador based government health care institution, provides medical services such as treatment, insurance, prescription home delivery, etc. The institution has branches in over 114 locations throughout the country, with its IT infrastructure network being very crucial for its business operations. To monitor its business critical IT network, ISSS’ IT team evaluated and chose ManageEngine OpManager.
Using Cisco Meraki Solution for SD WAN? ScienceLogic Was Built for That.
Since its acquisition by Cisco in 2012, Meraki has taken off as one of the most valuable tools for simplifying networking in the cloud era. Organizations using Meraki to install and configure software-defined networking (SDN) and software-defined wide area networking (SD-WAN) devices across their IT estates can attest to the fact.
Catchpoint and AFR-IX Telecom Join Forces to Bring More Reliable Internet to Africa
Datadog vs. New Relic: Which One Is Better [2023 Comparison]
Choosing an excellent application performance monitoring tool is a challenging task. Nowadays, there are dozens of instruments, and it can be problematic to pick the right one. However, when looking into every given “top ten list”, New Relic vs. Datadog will always be there. At this point, instead of focusing on dozens of log management tools, let’s focus on some key ones. Comparing New Relic vs. Datadog offers a distinct perspective on how infrastructure monitoring should look.
Datadog vs. Splunk: Which Is the Better Observability Solution [2023 Comparison]
Datadog and Splunk are among the most popular performance monitoring tools available on the market. If you’re looking for such a solution and looking to scratch one off your shortlist, look no further than this article. In this Datadog vs Splunk comparison, we will take a deep dive into everything each tool has to offer. We will point out their similarities and differences to help you decide which tool can meet your needs better.
Best Grafana dashboard for Graphite Metrics
It is an old cliche adage, but there is no better statement than “a picture is worth a thousand words” that explains the effectiveness of visuals to deliver a message. Especially, in the data domain where a raw message often exists in numbers, visualizing graphs and charts is the best way to share information. When it comes to visualizing metrics from Graphite, there is no solution that can beat Grafana.
How to monitor Snowflake with Grafana Cloud
Snowflake is a cloud-based data warehousing platform that allows organizations to store, manage, and analyze large amounts of data. It offers a scalable, secure, and highly available solution that separates storage and computing resources. We already offer the Snowflake datasource plugin, which allows you to query and visualize data from your Snowflake Data Cloud on your Grafana dashboards.
Exponential Smoothing: A Beginner's Guide to Getting Started
Exponential smoothing is a time series forecasting method that uses an exponentially weighted average of past observations to predict future values. This method assigns more weight to recent observations and less to older observations, allowing the forecast to adapt to changing trends in the data. The resulting forecast is a smoothed version of the original time series less affected by random fluctuations or noise in the data.
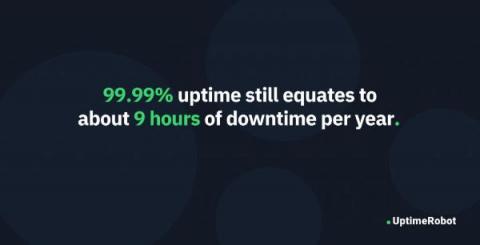
What Does 99.99% Uptime Really Mean?
Let’s face it, in today’s always-on digital world, a minute without access to a website or service can feel like a lifetime. You’ve probably heard the term “99.99% uptime” before. It’s an important factor for providers (such as hosting or app providers) and key to improving a website’s reliability and a company’s customer satisfaction. But when your service provider promises an amazing 99.99% uptime, have you ever paused to ask what it really means?
The most important infrastructure monitoring requirements
When setting up new monitoring software or migrating, it’s important to have a strong backbone in place for the systems, so you can cover as many services with as little manual burden as possible. Of course, defining the resources – like HTTP, SSH, etc. services or entire host systems – is one of the first things that comes to mind.
The Ripple Effect of Meta's $1.3 Billion GDPR Fine for Businesses That Handle Data
Meta, the parent company of Facebook, has been fined a record €1.2 billion ($1.3 billion) by the European Union for violating its data privacy laws. The fine was issued by Ireland’s Data Protection Commission, which is Meta’s lead regulator in the EU, and is the largest ever levied under the EU’s General Data Protection Regulation (GDPR), which went into effect in 2018.
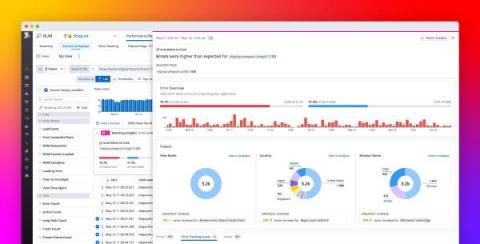
Automatically identify and efficiently investigate frontend issues with RUM Watchdog Insights
When your applications are experiencing degraded frontend performance, every minute of investigation counts towards minimizing the impact of regressions on your users. That’s why we built Watchdog Insights, an AI-powered recommendations engine that augments monitoring investigations by intelligently surfacing data that sheds light on outliers in the errors and latency affecting your applications.
Did Your Datadog Bill Explode?
Custom metrics is a key component for many companies. Stock available in warehouses, shopping cart status, number of products sold, and operational status for industrial machines are some of the many KPIs that companies need for their own business tracking purposes. When it comes to custom metrics and observability platforms costs, many companies are struggling to find a good balance between availability, performance, reliability, and costs.
How to Achieve End-to-End Visibility Within Network Infrastructure
In March 2021, Commander of the United States Cyber Command General Paul Nakasone testified before the U.S. Senate, summarizing a key organizational challenge, "It's not that we can't connect the dots; we can't see all of the dots."
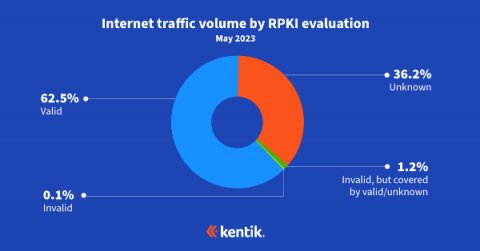
Exploring the Latest RPKI ROV Adoption Numbers
In this blog post, BGP experts Doug Madory of Kentik and Job Snijders of Fastly update their RPKI ROV analysis from last year while discussing its impact on internet routing security.
Streaming Aggregation vs Recording Rules
Streaming Aggregation and Recording Rules are two ways to tame High Cardinality. What are they? Why do we need them? How are they different?
How To Diagnose Wireless Network Issues Like a Pro - Check These 4 Things First
Covering your bases: three ways to achieve network visibility
Fast-Growing SaaS Scales Log Analytics with Huge Cost Savings
Distributed tracing Node.js- OpenTelemetry-based monitoring
As the trend toward microservices-based architectures continues to gain momentum, it’s becoming increasingly clear that distributed tracing will be a crucial tool for monitoring and debugging these complex systems in the future. When designing a microservices-based architecture, breaking extensive services into smaller, more manageable components is standard practice. Communication between these components becomes crucial, but finding the root cause can be challenging when issues arise.
5 Ways to Increase Release Velocity with Observability
The pressure on today’s development teams is real: innovate, release quickly, and then do it all again, only faster. Is it any surprise that studies are showing 83% of software developers are feeling burnout? We’re here to remind you that it doesn’t have to be this way.
Risk Management for Solution Architects: Mitigating Framework Risks
As a solution architect, you know that your expertise in envisioning and constructing robust systems is vital, especially as navigating third-party frameworks and platforms becomes increasingly integral in today's complex technological landscape. Risk management, therefore, plays a crucial role in safeguarding your organisation's digital assets and ensuring optimal performance. But how do you ensure you effectively mitigate the risks associated with these third-party frameworks and platforms? Read on to learn key tips and strategies for mitigating and managing framework risks.
Core Web Vitals update: Adjustments to LCP (and INP)
Monitoring Citrix VAD & ADC on Microsoft SCOM
Citrix virtualization technology has become a crucial aspect of many businesses. It enables organizations to provide remote access to their applications and desktops, improving productivity and efficiency. However, managing Citrix environments can be challenging, especially regarding performance and availability. That's why proactive monitoring is essential to ensure Citrix systems run efficiently. The Teqwave Citrix VAD Management Pack for Microsoft SCOM is a powerful solution that provides numerous valuable features and benefits for IT experts.
The Crucial Role of Event Management in IT Operations: Preparing for the Future with AI
Event management is a critical process within IT service management, offering a structured method to detect, assess, and respond to events that could disrupt business services. Essentially, event management is a systematic approach to tracking all detectable occurrences within IT infrastructure, applications, systems, and services.
10 Best Datadog Alternatives & Competitors [2023 Comparison]
Several years ago, there was little choice among performance monitoring tools. You had to deal with what the market offers. Datadog is one of the oldest solutions available and, thus, well-known. Yet, it is not without flaws, which might make people look for alternative solutions since the market is booming and new tools emerge regularly.
Prometheus vs. Datadog: Key Features & Differences [2023 Comparison]
DevOps teams and security engineers use monitoring tools like Prometheus and Datadog to search for bugs and find any issues that might put an app or the entire IT infrastructure at risk. Better monitoring capabilities and aspects like event monitoring mean users can log data more effectively and engage in data collection leading to data visualization. These actions lead to infrastructure metrics, which allow experts to conduct timely analysis and prevent an app from crashing.
Administer Your Splunk Cloud Stacks Easily and Efficiently with ACS Helper for Splunk
How to use Argo CD to configure Kubernetes Monitoring in Grafana Cloud
Since Kubernetes Monitoring launched in Grafana Cloud last year, we have introduced highly customizable dashboards and powerful analytics features. We’ve also focused on how to make monitoring and managing resource utilization within your fleet easier and more efficient. But what’s an easy way to add resources to your cluster while using Kubernetes Monitoring?
5 Steps to Get Telemetry Data in DX NetOps
This practitioner blog will show you how to consume telemetry data from your network devices in five easy steps. Telemetry is a monitoring technology used to do high-speed data collection from network devices. According to EMA research on network performance management, “71% of enterprises are interested in collecting streaming network telemetry with their network management tools.” This next-generation approach to monitoring has been expected to replace SNMP for years.
RDP Shortpath monitoring in Azure
Since Microsoft announced the RDP Shortpath feature was going to be enabled by default on September 6, 2022 for all Azure Virtual Desktop (AVD) customers, monitoring and troubleshooting this feature has become important. RDP Shortpath feature improves the AVD connectivity by establishing a direct UDP protocol between the AVD session hosts and the Remote Desktop Client by reducing the dependency on gateways.
Developing with OpenAI and Observability
Honeycomb recently released our Query Assistant, which uses ChatGPT behind the scenes to build queries based on your natural language question. It's pretty cool. While developing this feature, our team (including Tanya Romankova and Craig Atkinson) built tracing in from the start, and used it to get the feature working smoothly. Here's an example. This trace shows a Query Assistant call that took 14 seconds. Is ChatGPT that slow? Our traces can tell us!
Logic App Best Practices, Tips, and Tricks: #29 How to validate if an Array is empty
How can companies improve Network and API performance?
In this bi-weekly micro webinar series, Catchpoint and ITOps Times have partnered to explore six critical topics that are essential for ensuring Internet Resilience for your business. Explore each of the topics in the series: In this fourth segment, we’ll discuss techniques for enhancing Network and API performance by implementing Internet Performance Monitoring. Now, let’s get into the episode!
Making Peering Easy: Announcing the Integration of PeeringDB and Kentik
Peering evaluations are now so much easier. PeeringDB, the database of networks and the go-to location for interconnection data, is now integrated into Kentik and available to all Kentik customers at no additional cost.
AppDynamics Cloud enhancements for hybrid cloud, anomaly detection and usability
Introducing new capabilities expanding hybrid cloud support for VMs, Kubernetes and Linux apps running in public or private clouds, enhancements in application to infrastructure correlation using AI/ML-powered anomaly detection and more.
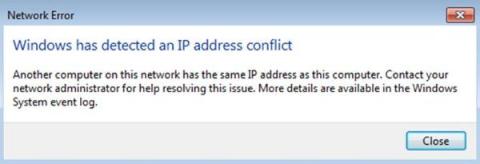
What's an IP Address Conflict, and How Do You Fix It?
9 Common Website Errors and How to Fix Them
Did you know that 88% of online consumers are less likely to return to a website after a bad user experience? This means that no matter how small, website errors can significantly impact your website's traffic and revenue. As a website owner or manager, it's crucial to identify and fix common errors to ensure your website runs smoothly and provides an exceptional user experience. But where do you start? With so many potential issues that can arise, it can be overwhelming to know what to prioritize.
Monitor Azure OpenAI with Datadog
Azure OpenAI is a service for deploying AI applications on Azure resources. With its easy-to-use REST APIs, you can leverage the service to access OpenAI’s powerful language models, such as ChatGPT, for your applications while taking advantage of the reliability and security of the Azure platform. Datadog already offers an out-of-the-box integration for OpenAI so you can monitor key performance trends, such as API usage patterns, token consumption, and more.
Avoid Azure migration cost overruns with Datadog Cloud Cost Management
Migrating your on-prem applications to Azure can help you improve scalability, reliability, and security. It can also help reduce costs and free your engineering teams to focus on innovation and performance optimization. But it can be hard to understand Azure costs as they evolve during your migration and to see how they correlate with your resource utilization once you’re up and running in Azure.
Monitor mainframe activity with Bottomline's Record and Replay offering in the Datadog Marketplace
Many organizations have faced the complex challenges that come with mainframe monitoring. MIPS-based cost models make native mainframe software expensive, and deploying individual agents to user desktops and devices is difficult to maintain and scale.
Top 20 Server Monitoring Tools of 2023
Sentry for SvelteKit
We’re happy to announce that the Sentry SvelteKit SDK is now generally available and ready to help you monitor your SvelteKit application. Last year, we entered the Svelte ecosystem by creating an SDK for Svelte, which provides support for Svelte single page apps. We knew that SvelteKit was already quite far along back then and we kept a close eye on its development. We also received a lot of requests from the community to support SvelteKit.
A Place for Everything and Everything in Its Place
With Cribl Stream, our customers are experiencing choice and control over their data that would have been a pipe dream (or maybe I should say a pipeline dream) before. The ability to get the right data to the right destination in the right format is extremely powerful. Stream can optimize the data being sent to expensive destinations; you can remove unnecessary or redundant fields, drop unnecessary events, or even pull valuable metrics from verbose logs. Optimizing your data has a few benefits.
What is Observability?
“Observability” seems to be the buzzword du jour in IT these days but what does it actually mean, and how is it any different from plain, old monitoring? In simple terms, observability is the ability to understand how a system is performing and how it is behaving from the data that system generates. It is not just about monitoring metrics or collecting logs, but also understanding the context of those metrics and logs, and how they relate to the overall health of the system.
Building and deploying AWS email templates with Azure DevOps
This is the third and final post (for now) in the series about developing email templates with MJML and deploying them to AWS. In the previous post, we developed a Gulp script to automatically build HTML from the MJML file and insert it in a template file for AWS. In this post, we will set up an automated build and deployment of the email template using Azure DevOps. A quick recap.
Continuous Delivery Pipeline for Kubernetes Using Spinnaker
Kubernetes is now the de-facto standard for container orchestration. With more and more organizations adopting Kubernetes, it is essential that we get our fundamental ops-infra in place before any migration. In this post, we will learn about leveraging Jenkins and Spinnaker to roll out new versions of your application across different Kubernetes clusters.
How Uncaught Crashes Can Damage Your Application's Reputation, Revenue, and more
At BugSplat, we have a unique view of how uncaught crashes can impact individual teams (and entire companies) through our work building tools to find and fix bugs in live applications. We've seen firsthand the difference it can make when teams have a workflow for reporting every defect that makes it into production and when they don't.
Feature Spotlight: Kubernetes Dependency Maps and Real-Time Topology
This blog dives into detail about one of StackState’s most unique and powerful features, Kubernetes dependency maps. Dependency maps are Kubernetes service and infrastructure maps, enhanced with real-time topology, that show dependencies between all components at any moment in time.
What Is Workload Automation Observability?
As workload automation environments become more complex and job volumes increase, the need for true observability is becoming an increasingly essential and critical component for optimized automated business process delivery. Most organizations run several automation engines from different vendors in both distributed and mainframe environments, and in the cloud. Sometimes these automation engines operate in a silo, sometimes they have dependencies with each other.
What is Remote Network Monitoring: Network Optimization In The Remote Work Era
How Netdata's ML-based Anomaly Detection Works
How does Netdata's machine learning (ML) based anomaly detection actually work? Read on to find out!
Common C# exceptions and how to fix them
C# is a powerful programming language, but like all code, comes with its fair share of errors. Even experienced developers can find themselves stumped when they encounter a strange exception or error code. Fortunately, with the right knowledge and techniques, you can tackle any C# exception. In this article, we’ll discuss some of the most common exceptions in C# programming and how they can be fixed.
Solution Architects: Beyond Technical Skills - Developing Soft Skills
As an experienced Solution Architect, you understand the crucial role technical expertise plays in your career. However, to truly excel and stand out in your field, it's vital to recognise the importance of soft skills. In this article, we will dive deep into various critical soft skills and explore how they can propel you to even greater success in your role as a Solution Architect. Let us dive in.
Exploring cAdvisor for Common Use Cases
Container technologies have revolutionized the field of software development. By using containers, you can bundle together an application's source code with its libraries, dependencies, and configurations, ensuring that it runs predictably and reliably on different machines. But how can you be sure that your containers are running smoothly once deployed? That's where container monitoring tools like cAdvisor come in. Below, we'll go over what cAdvisor is and the different use cases for cAdvisor.
Stay connected around the clock with ManageEngine's Site24x7
An Introduction to Using OpenTelemetry & Python Together
This post was written by Mercy Kibet, a full-stack developer with a knack for learning and writing about new and intriguing tech stacks. In today’s digital world, software applications are becoming increasingly complex and distributed, making it more challenging than ever to diagnose and troubleshoot issues when they arise.
Why Paradigm switched to Grafana Cloud: Inside their observability stack
As the largest liquidity network in crypto, Paradigm facilitates more than $11 billion in monthly volumes, representing nearly 40% global cryptocurrency option flows. Their free-to-use platform provides a single point of access to multi-asset, multi-instrument liquidity on demand, and Software Architect Jameel Al-Aziz leads the team of developers who build and maintain the platform.
Start monitoring GitLab with our new Grafana Cloud integration
GitLab is a popular open source DevSecOps platform for software development. The Enterprise Edition is a web-based Git repository manager that allows teams to collaborate on code and automate workflows for building, testing, and deploying applications. We already offer the Gitlab datasource plugin, which allows you to query and visualize data from your GitLab instance on your Grafana dashboards.
Can Network Monitoring Identify Security Threats? Here's What to Know
By continuously monitoring network activity and assets, network monitoring plays a key role in identifying cybersecurity threats. The network monitoring process gathers important data that can be used in analytics or in conjunction with cybersecurity applications to rapidly identify and respond to threats.
Troubleshooting SD-WAN Performance Problems
Software-Defined Wide Area Network (SD-WAN) technology is revolutionizing the way organizations manage their network traffic. With its ability to decouple the data plane from the control plane, SD-WAN provides organizations with a more flexible, scalable, and cost-effective solution for managing their network traffic. However, understanding and troubleshooting SD-WAN performance can be a challenge, especially when it comes to the underlying physical network, or underlay.
Webinar Recap: Unlocking the Full Value of Telemetry Data
Growth of cloud computing and the preference for data-driven decision-making have led to a steady increase in investments in observability over the years. Telemetry data is recognized as not only critical for maintaining a company’s infrastructure, but also for aiding security and business teams in making informed decisions. However, just increasing investment in observability technology is not enough.
Left, Right, Center: A 3 Step Dance to Success with Building Data Pipelines
Remember the first time you were at a wedding, or a party and you learned about dances like The Electric Slide? You know, those dances with a clear structure and steps to follow, which were a huge help to someone who was slightly challenged on the dance floor, like me? All you had to do was learn a few simple steps, and you could hang with even the best dancers.
Azure App Service Autoscaling: Steps to Configure
SQL vs. NoSQL Today: Databases, Differences & When To Use Which
Website Analytics Audit of FrontendMasters.com
SSL/TLS Explained in 7 Minutes
Leveraging OpenTelemetry to Fix Flaky Integration Tests
At Lumigo, we heavily depend on a set of tests to deploy code changes fast. For every pull request opened, we bootstrap our whole application backend and run a set of async parallel checks mimicking users’ use cases. We call them integration tests. These integration tests are how we ensure: Recently, we changed our old “traditional log traversing” of integration tests into *amazing* OpenTelemetry traces graphs.
How to adopt distributed tracing without compromising data privacy
The age-old dilemma of privacy and security vs. productivity pops up for developers every time they consider introducing a new technology to their stack. The dilemma is often viewed as a trade off: on one hand, privacy and security measures can slow down how quickly new features can be rolled out; on the other hand, prioritizing productivity and business enablement over privacy and security can increase the risk of breaches to an organization.
A guide to exception handling in PHP
Elevate your PHP skills and improve your application with this comprehensive guide to exception handling. Discover best practices, practical tips, and expert insights to master error management.
Savour ITSM's perfect burger: People, processes and technology
What is Prometheus Remote Write
Everything you need to know about Prometheus Remote Write mechanism and storing metrics in long term storage such as Levitate.
Coralogix Provides Highly Scalable Traces For Your Success
While more observability vendors are providing tracing ingestion and visualization as part of their core service, only Coralogix, the leading in-stream observability platform, supports a set of data optimization features that drive down cost, maximize insights and create a scalable tracing strategy unlike others.
Logic App Best Practices, Tips, and Tricks: #28 How to check if a string is Null or Empty
Prometheus vs Datadog
Comparison between Prometheus and Datadog - two of the most popular monitoring tools in the market today.
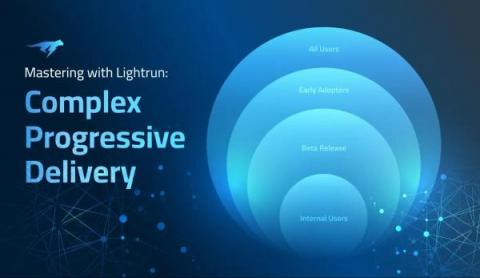
Mastering Complex Progressive Delivery Challenges with Lightrun
Progressive delivery is a modification of continuous delivery that allows developers to release new features to users in a gradual, controlled fashion. It does this in two ways. Firstly, by using feature flags to turn specific features ‘on’ or ‘off’ in production, based on certain conditions, such as specific subsets of users. This lets developers deploy rapidly to production and perform testing there before turning a feature on.
Cribl Stream Production Deployment Guide
Five worthy reads: The interfused future of AI in cryptocurrencies
Five worthy reads is a regular column on five noteworthy items we have discovered while researching trending and timeless topics. This week, we explore the amalgamation of the rapidly evolving world of artificial intelligence (AI) in cryptocurrency. Designed by Dhanwant Kumar The world of cryptocurrency has come a long way since the introduction of Bitcoin in 2009. Today, there are thousands of cryptocurrencies available, each with unique features and scenarios.
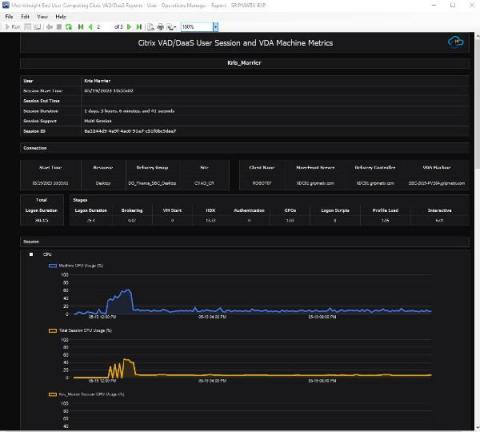
New Citrix User Experience Reporting for SCOM goes beyond Citrix Director
We're thrilled to unveil a new feature for MetrixInsight for Citrix VAD/DaaS SCOM Management Pack - a comprehensive User Experience SCOM Report. This new addition provides unparalleled insights and once again exceeds the capabilities of Citrix Director by enabling retrospective analysis of both current and terminated sessions. This feature allows you to deep-dive into key user session and VDA machine metrics.
Revolutionizing Operations Centers with Netdata's Real-time Monitoring Solution
In today's fast-paced digital landscape, 24-hour operations centers play a crucial role in managing and monitoring large-scale infrastructures. These centers must be equipped with an effective monitoring solution that addresses their unique needs, enabling them to respond quickly to incidents and maintain optimal system performance. Netdata, a comprehensive monitoring solution, has been designed to meet these critical requirements with its advanced capabilities and recent enhancements.
The Future of Infrastructure Monitoring: Scalability, Automation, and AI
In this blog post, we will explore the importance of scalability, automation, and AI in the evolving landscape of infrastructure monitoring. We will examine how Netdata's innovative solution aligns with these emerging trends, and how it can empower organizations to effectively manage their modern IT infrastructure.
C# Date Classes: Types, Formats, and How to Use Them
In this article, we will be exploring C# date classes and how to leverage them to handle and manipulate date data in our applications. We will see the different types of date objects that C# handles and the formats that can be represented, and we will learn how to cleanly process date information from users. Let’s jump right in.
Never-firing alerts: What they are and how to deal with them
Alerting is one of the main reasons for having a monitoring system. It is always better to be notified about an issue before an unhappy user or customer gets to you. For this, engineers build systems that would check for certain conditions all the time, day and night. And when the system detects an anomaly - it raises an alert. Monitoring could break, so engineers make it reliable. Monitoring could get overwhelmed, so engineers make it scalable. But what if monitoring was just poorly instructed?
Unique Tracing Cost Optimization - UP TO 90% SAVINGS!
Connect your Lambda Function to Coralogix in 3 CLICKS
[Sensu Go Workshop] Lesson 8: Introduction to Checks
Enable monitoring for enterprise-scale Azure environments in minutes with Datadog
As enterprises build and scale business-critical applications on Azure, they need continuous visibility to understand the health and performance of their services. This can be a challenge, especially for enterprises with large-scale deployments that include an ever-increasing number of subscriptions, resources, and teams.
LM Envision: Spring 2023 product release lookback
Head in the Clouds (ft. Jo Peterson): Over-tooling Data is Overrated
Understanding Observability: The Key to Effective System Monitoring
Our Recent Hosted Graphite Infrastructure Updates
Recently we updated our infrastructure. We wanted to discuss the updates we have done to show why we think it is important to keep our infrastructure up to date. Updating infrastructure is critical because it provides more security and improved speeds.
How to Decode the Hidden Information from Traceroute DNS
JBoss performance tuning - 5 best practices
A collection of 5 top tips for JBoss performance tuning to ensure optimal application performance and resilience. Learn how to monitor and troubleshoot JBoss systems to eliminate bottlenecks, reduce costs and minimize user issues.
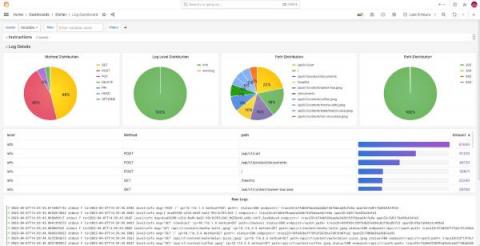
6 easy ways to improve your log dashboards with Grafana and Grafana Loki
Because of where you’re reading this post, I’m going to assume you already know that Grafana is a great tool for visualizing and presenting metrics, and persisting them on dashboards. Ever since the Grafana Loki query builder for LogQL was introduced in 2022, it’s been easy to display and visualize logs, too.
The Top 5 Gambling Website Issues
Tune into any sports game and you’ll likely see an iGaming ad at some point. Sports betting or online slots have become so ubiquitous in the modern age that the United Kingdom now has one of the largest online gambling markets in the world. Due to their high-thrills gaming and transactional nature, gambling websites face more performance issues than most. This is why it’s so important to monitor website performance, looking at conversion rate optimisation and security.
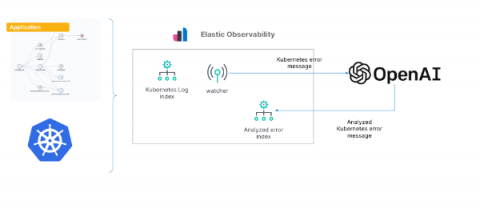
Gain insights into Kubernetes errors with Elastic Observability logs and OpenAI
As we’ve shown in previous blogs, Elastic® provides a way to ingest and manage telemetry from the Kubernetes cluster and the application running on it. Elastic provides out-of-the-box dashboards to help with tracking metrics, log management and analytics, APM functionality (which also supports native OpenTelemetry), and the ability to analyze everything with AIOps features and machine learning (ML).
Transport Your Logs to AppSignal with Winston
AppSignal Logging gives you 360-degree insights into your application's performance. To help give you those insights, we wanted to ensure our logging solution allowed you to send AppSignal your logs your way. You can now use Winston transport to send your Node.js application's logs directly to AppSignal and take advantage of having access to all of your application's performance logs and metrics in one place.
A Log's Life Cycle in Coralogix
Coralogix is a full-stack observability platform that effortlessly processes logs, metrics, traces, and security data. More specifically, logs in Coralogix are processed in larger volumes than almost any other observability provider out there, making a log’s life cycle unique. This article will examine the different stages of logs and help you better understand one of the most sophisticated telemetry processing architecture on the market.
Goats on the Road: RSA 2023 Recap
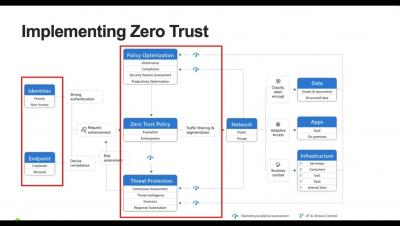
Dr. Anton Chuvakin, a noted warrior/poet/security cybersecurity expert, sums up my thoughts about RSAC 2023 marketing messaging perfectly with this post on Twitter. For those who are new to the vendor hall, the amount of just bad marketing can be overwhelming and confusing. . There’s only one chance to get your message across to your prospects, so make it short and sweet. Anton’s guess of “zero click zero trust” is closer than you think to the truth.
Configuring Azure Logic App Failure Alerts To Stay Ahead
5 Ways Honeycomb Saves Time, Money, and Sanity
There’s a reason everyone dreads debugging, especially in today’s complex cloud systems: it’s at the high stakes nexus of nervous senior management, overworked engineers, neverending rabbit holes, copious buckets of time, and fickle customers.
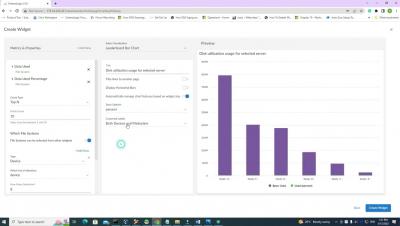
Discover the new widgets in version 770
Monitor Azure Pipelines with Datadog CI Visibility
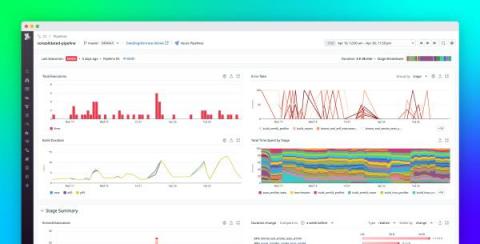
End-to-end visibility into pipelines is crucial for ensuring the health and performance of your CI system, especially at scale. Within extensive CI systems—which operate under the strain of numerous developers simultaneously pushing commits—even the slightest performance regression or uptick in failure rates can compound rapidly and have tremendous repercussions, causing major cost overruns and impeding release velocity across organizations.
Correlating Metrics, Traces, & Logs-Without the Swivel Chair
Correlation in monitoring and observability refers to the process of analyzing different types of data to identify and understand relationships between application, network, and infrastructure behavior. Correlating these data sets can help IT teams identify all technology components contributing to or impacted by a performance or reliability issue, thereby empowering them to identify root cause and troubleshoot faster.
Less is more: industry leaders share their success with tool consolidation for maximized productivity
Getting Started with the Apache Arrow Community
From logs to insights: Using Firewall Analyzer to monitor Squid proxy activity
Squid proxies are among the most popular open-source proxy servers preferred by companies across the globe to keep their networks safe and boost performance. Since Squid proxy’s release in 1996, companies have preferred it for its high-performance proxying, forwarding, and caching functions. Squid proxy logs contain information about the HTTP traffic passing through a server. This includes the source IP, destination IP, time of the request, and accessed URL.
Identify unused, costly metrics with Cardinality Management dashboards in Grafana Cloud
Organizations are dealing with an explosion of metric data as they shift to cloud native architectures and adopt tools like Prometheus and Kubernetes. This in turn can lead to surges in spending on observability metrics. So while teams want a way to scale out metrics adoption to improve their observability — and thus, improve system performance and reliability — they also need to be mindful of skyrocketing costs that could scuttle those efforts before showing meaningful results.
Eliminating the Monitoring Blind Spots Introduced by ISP Networks
ISP networks are the connective tissue for most business traffic today. Are your network monitoring capabilities aligned with this new reality? This post examines why it’s so critical to establish visibility into ISP networks, and offers key tips for success.
Monitor your Roku channels with Datadog RUM
Roku is a popular streaming platform that allows users to access a wide variety of TV shows, movies, and other types of online video content. With its easy-to-use interface and affordable hardware, Roku has become one of the most popular streaming platforms in the world. At the end of 2022, Roku reported having over 70 million active users, with content available through 350+ channels.
Challenges of observing Kubernetes: Understanding a complex and dynamic system
As technology evolves in the enterprise, oftentimes the processes and tools used to manage it must also evolve. The increased adoption of Kubernetes has become a major inflection point for those of us in the monitoring and management side of the IT operations world. What has worked for decades (traditional infrastructure monitoring) has to be adjusted to the complexity and ephemeral nature of modern distributed systems where Kubernetes has a prime role.
Defined and Explained: IT Infrastructure Monitoring
Modern IT environments and networks are more complicated and distributed than ever before, spanning public clouds, private clouds, edge locations and on-premise data centers. What once worked well—manual or simple monitoring tools—can no longer ensure end-to-end visibility within complex networks. How can you monitor what you can’t see? Fortunately, you now have access to a new generation of monitoring tools designed for the hybrid network.
Mind Your MANRS: A Safer Internet Through Secure Global Routing
We access most of the applications we use today over the internet, which means securing global routing matters to all of us. Surprisingly, the most common method is through trust relationships. MANRS, or the Mutually Agreed Norms for Routing Security, is an initiative to secure internet routing through a community of network practitioners to facilitate open communication, accountability, and the sharing of information.
A Guide to Working with the Dateutil Module in Python
Python is a highly versatile language. From software engineering to machine learning and data analysis, it’s everywhere. As a multipurpose scripting and programming language, it’s often utilized for manipulating and working with data. So, when you’re working with Python, whether you’re analyzing data or writing scripts, you’re likely to encounter dates and time stamps.
A Systematic Approach to Collaboration and Contributing to the Lattice Design System
The Honeycomb design team began work on Lattice in early 2021. Over several months, we worked to clean up and optimize typography, color, spacing, and many other product experience areas. We conducted an extensive audit of all components, documenting design inconsistencies and laying the foundation for a sustainable design system. However, a more extensive evaluation and audit were necessary before updating or developing components.
What's New in Graylog V5.1
Graylog Investigations Feature
Graylog Sigma Rules
Outputs vs. Outcomes: Understanding the Differences
Citizen Developers: How Citizen Development Works & Reduces Dev Shortages
How Endeavor Streaming Accelerates Metrics with Logz.io
The platform development team at Endeavor Streaming has a critical mission — from balancing operation of the company’s leading digital video platform, at scale, to ensuring everything in their complex cloud environment is performing as expected. Enabling the company to confidently build on top of its platform and continue to evolve their product delivery is thereby also dependent on maintaining detailed visibility into its supporting cloud applications and infrastructure.
Announcing Graylog v5.1
We are excited to announce the release of Graylog 5.1! A follow-up to our 5.0 release, Graylog 5.1 brings updates across our entire product line, including changes to infrastructure, Security, Operations, and our Open offerings.
Google Analytics 4 Has Me So Frustrated, We Built Our Own Analytics Service
Perfecting the Customer & Employee Digital Experience featuring TMNAS
The Hidden Costs of Production Downtime in the Financial Industry
Unlocking the Power of Azure: Top 36 Solutions for Azure Monitoring Tools
The Experience Watchtower: Top 22 Digital Experience Monitoring Tools
Network Connection Monitoring 101: Your Path to Network Nirvana
Alert Fatigue in SRE and DevOps: What It Is & How To Avoid It
DevOps teams and site reliability engineers (SREs) contend with a never-ending flood of notifications and alerts about outages, potential threats, and other incidents. Companies rely on their DevOps teams to not only keep abreast of all the notifications but also to identify and prioritize the critical alerts and resolve problems in a timely manner. Yet in 2021, International Data Corporation (IDC) reported that companies with 500-1,499 employees ignored or failed to investigate 27% of all alerts.
The future of Icinga + Windows: Schrödinger's agent?
I remember as if it was yesterday. I participated at the OSMC 2014 and watched Bernd’s talk “Current state of Icinga”. In the live demo Bernd has showed some of the new things we’ve built. One of them he introduced somewhat hesitantly IMHO.
SolarWinds Adds Transformative AI Features to IT Service Management Solutions
What's Missing in Free User Experience Monitoring Tools?
You get what you pay for is a common axiom, one that even applies to infrastructure management solutions. Cloud vendors bundle Digital Experience Management (DEM) solutions with their services, seemingly at no extra charge. But such products lack the capabilities needed to understand how enterprise computing resources function. As a result, corporations do not make needed adjustments and lose time, revenue and increase user frustration.
Overcoming performance bottlenecks by enhancing visibility
Are you a network admin who gets overwhelmed by the number of devices they have to manage? We can only imagine the plight you have to go through. Technological advancements have extended the scope of network monitoring. Way beyond the conventional norms of preventing downtime, network monitoring in today’s context is about maintaining the optimum performance of devices while delivering an enhanced end-user experience.
Catchpoint Expands Its Leadership in Internet Performance Monitoring
There's Nuggets in Them Buckets: How Cribl Search Can Mine Your Observability Lake
Enterprises have enough data, in fact, they are overwhelmed with it, but finding the nuggets of value amongst the data ‘noise’ is not all that simple. It is bucket’d, blob’d, and bestrewn across the enterprise infrastructure in clouds, filesystems, and hosts machines. It’s logs, metrics, traces, config files, and more, but as Jimmy Buffett says, “we’ve all got ’em, we all want ’em, but what do we do with ’em”.
Cribl Earns a Spot on the 5th Annual Enterprise Tech 30 List!
Cribl has been named to the 5th annual Enterprise Tech 30 (ET30) – a definitive list of the most promising, private enterprise tech companies. This is our first time on the ET30 list, ranking number four on the list of ten companies in the late stage category. The recognition highlights the value our innovative products deliver to our customers and partners as we work together to unlock the value of all observability data.
What is Supercloud? What to consider when monitoring and observing a Supercloud?
In recent months the term “Supercloud” has become increasingly used, particularly in the context of being a successor or qualifier to “multi-cloud”. There isn’t any definitive formal definition, it is essentially yet another buzzword and vendors and analysts are pilling in with their own take and definition to align to their own agendas and product capabilities.
Democratizing Digital Employee Experience with Nexthink Assist
Artificial Intelligence and Machine Learning have been at the heart of our strategy since the beginning. At the birth of Nexthink we wanted to help IT teams not get drowned in list of logs, but rather immediately see actionable data already processed, correlated and ready to consume.
High Cardinality for Dummies: ELI5
High Cardinality woes are far & frequent in today's modern cloud-native environment. What does it mean, & why is it such a pressing problem?
Monitoring Multi-Cloud and Hybrid-Cloud Infrastructures: Challenges and Best Practices
The advent of multi-cloud and hybrid-cloud architectures has created new opportunities for organizations to leverage best-in-class features from various cloud service providers. However, these complex environments present their own unique challenges, especially when it comes to monitoring and managing performance.
10 Best Practices When Logging in Python
In the eternal hunt for elusive bugs, logging is an indispensable aid. By recording the events and messages that occur during the execution of your program, logging opens the door to unparalleled debugging and performance monitoring capabilities. It all starts with Python’s built-in logging module. However, the true power of Python logging is unlocked not merely by using it, but by mastering it.
The True Cost of Ignoring Internet Performance Monitoring
The financial impact of Internet outages on businesses is well recognized. Yet, the exact cost remains difficult to gauge due to the individual nature of each company, its environment, the industry, risk tolerance, and so on. A significant breakthrough in understanding this cost has been achieved through a recent commissioned study conducted by Forrester Consulting on behalf of Catchpoint, entitled, Increase Revenue with Internet Performance Monitoring.
How Visibility Makes Empathy Easier, From the IT Desk to the End-User
Network Operator Confidential: Diving Into Our Latest Webinars on DDoS Trends, RPKI Adoption, and Market Intel for Service Providers
Didn’t have time to watch our two recent webinars on the top trends network operators need to know about to be successful in 2023? We’ve got you covered. Let’s look at the biggest takeaways and break down some key concepts.
How We Use Smoke Tests to Gain Confidence in Our Code
Wikipedia defines smoke testing as “preliminary testing to reveal simple failures severe enough to, for example, reject a prospective software release.” Also known as confidence testing, smoke testing is intended to focus on some critical aspects of the software that are required as a baseline.
The Leading Open Source Dashboard Software
There are many advantages to using dashboards that are powered by open-source technology that make them a compelling choice for many organizations. Below we will discuss some of the major benefits of using dashboards that are built with the help of open-source technology, along with examples of some of the leading use cases for which open-source technology has been utilized.
Achieving Company Retreat Goals With the Right Schedule
At our recent company retreat, we set out to achieve 2 main goals with our fully remote team: Based on the feedback from the team, we succeeded! 🎉 The retreat schedule is a key component to achieve our retreat goals, and we’re happy to share with you what works best for us!
The Linux integration for Grafana Cloud gets a major update
Linux is a popular open source operating system used by developers, businesses, and individuals around the world. Linux is known for its flexibility, security, and reliability, making it an excellent choice for servers, desktops, and embedded devices.
Trace your Azure Function application with Elastic Observability
Adoption of Azure Functions in cloud-native applications on Microsoft Azure has been increasing exponentially over the last few years. Serverless functions, such as the Azure Functions, provide a high level of abstraction from the underlying infrastructure and orchestration, given these tasks are managed by the cloud provider. Software development teams can then focus on the implementation of business and application logic.
What Is DPE? Developer Productivity Engineering Explained
Kubernetes Design Patterns For Optimal Observability
Technology is a fast-moving commodity. Trends, thoughts, techniques, and tools evolve rapidly in the software technology space. This rapid change is particularly felt in the software the engineers in the cloud-native space make use of to build, deploy, and operate their applications. One particular area where we see rapid evolution in the past few years/months is Observability.
How to use Cardinality Management dashboards in Grafana Cloud
What is Decentralized Network Monitoring
Catching the Pulse: The Top 30 Infrastructure Monitoring Tools
30 Powerful SNMP Network Monitoring Tools: Unleashing the Potential of Network Management
No more mistakes! Learn how to create strong, flawless software deployments with the help of automation
The impact of NWDAF on telco service providers: Embracing vendor agnostic data analytics
Network Data Analytics Function (NWDAF) is a key component in 5G networks, designed to collect, analyze, and deliver valuable insights to service providers. NWDAF provides an unbiased, vendor-vendor agnostic view of the network, expanding telco visibility beyond traditional use cases. As network complexities grow, service providers require unbiased and accurate data to make informed decisions, driving the demand for vendor agnostic data analytics.
The leading InfluxDB Dashboard Examples
InfluxDB is a powerful tool for managing time-series data. It is widely used in industries such as IoT, finance, healthcare, and more. Using InfluxDB, you can query and store large amounts of data in real-time, making it easier to identify patterns, trends, and anomalies. InfluxDB dashboards provide a comprehensive overview of your system performance, metrics, and KPIs in real-time. You can customize these dashboards to meet your specific requirements.
Don't Let Time Series Data Break Your Relational Database
This article was originally published in The New Stack and is reposted here with permission. It’s tempting to stuff time series data into the familiar Postgres or MySQL database, but that’s a bad idea for many reasons. To the uninitiated or unfamiliar, time series data exhibits similar characteristics to relational data, but the two data types have some critical differences.
What Can Network Automation Do for You?
You probably have been hearing a lot about automation and artificial intelligence (AI) these days, with a vision of some kind of AI-driven world that will take all of our jobs away. The reality is that there’s always too much work to do. AI and automation are more likely to help people get their jobs done more efficiently rather than take them away. Basic automation can have large returns for the network – and improve the quality of work.
Embracing Planned Downtime: Why It's Crucial For Your Website's Health
You’ve probably heard plenty of horror stories of unplanned website downtime wreaking havoc on businesses and costing companies thousands or even millions in lost revenue. So if you’re worried, we can’t blame you! Website downtime is usually a nightmare for any company relying on having a steady online presence. But not all downtime is bad. Scheduled, well-timed downtime can be a game-changer in keeping your site running smoothly and ensuring customer satisfaction.
Walk-through: Set Up Self-Hosted Healthchecks Instance on a VPS
In this guide, I will deploy a Healthchecks instance on a VPS. Here’s the plan.
Launching a new dashboarding experience
Since we launched the new SquaredUp last Fall, our focus has been making it easier than it’s ever been to connect to any data source, build beautiful dashboards, and share them with anyone. Today we’re excited to announce a fully redesigned dashboarding experience that does just that. The new dashboarding experience remains backed by data mesh technology, which means your data stays where it lives – it’s simply stitched together and available on-tap from the source.
A Tool for Every Data Silo
Enterprises are accumulating more and more observability and security data in isolated silos, not much different than the dust and spare change under couches and chairs in your grandparent’s rarely-used living room. There is something of value in both examples, but the nature of the value is very unclear and hard to measure without a lot of effort.
Is Northern Virginia Really the Least Reliable AWS Region And Why?
AWS users usually assume that Northern Virginia, also referred to as US East (N. Virginia) and us-east-1, is the least reliable in terms of uptime. We analyzed AWS outage history in 2022 across regions to see if N. Virginia, indeed, had the most downtime. Then we reviewed and proved some of the theories as to why N. Virginia has the most outages.
Error Logging: A Complete Guide for Beginners
Today's applications are incredibly intricate and interconnected, often relying on numerous third-party services and libraries. With this complexity comes an increased likelihood of things going wrong. However, an error doesn't usually announce itself with great fanfare and a detailed explanation. More often than not, it shows up as an unexplained crash, a suspicious slowdown, or a surprising output. Error logging shines a spotlight on these problems.
Maximizing CI/CD Pipeline Efficiency: How to Optimize your Production Pipeline Debugging?
At one particular time, a developer would spend a few months building a new feature. Then they’d go through the tedious soul-crushing effort of “integration.” That is, merging their changes into an upstream code repository, which had inevitably changed since they started their work. This task of Integration would often introduce bugs and, in some cases, might even be impossible or irrelevant, leading to months of lost work.
Is Teams The Be All & End All Of The Modern Workplace?
Teams has become more than just a handy platform to send the odd chat message or drop documents over to a colleague. In fact, it’s become fundamental to the way organizations across the world operate. But does it tick every box for modern businesses? Nearly, yes.
Digital Business Transformation Never Ends-Can Your Infrastructure Keep Up?
Digital transformation—and its intended benefits, including flexibility, scalability, agility, cost control, and more—is enabled by cloud computing. You need all these things because, now more than ever, businesses and markets are highly dynamic. Sometimes it’s an opportunity you want to capitalize on. Other times it’s a threat, such as a disruptive competitor, or a challenge, like new regulatory requirements. Some things you see coming, and others take you by surprise.
RapidSpike Wallboards
Introducing RapidSpike ROI Calculator
What is Cloud Network Monitoring & How it Ensures Sky-High Network Performance
Rojan saves thousands on IT management with ManageEngine OpManager
Monitoring AIX & Linux on IBM Power using Microsoft SCOM | NiCE Webinar
Navigating the Path to Cloud Migration: Key Challenges and Best Practices
Embarking on a cloud migration journey? Grasp the obstacles and arm yourself with best practices for a smooth transition. Success lies in understanding, planning, and adapting. As we continue to advance further into the 21st century, businesses of all sizes are finding themselves in the midst of a digital revolution.
Mastering Cloud Optimization: Strategies for Enhancing Performance and Reducing Costs
Unlock the full potential of your cloud investment! Discover strategies to enhance performance and reduce costs. In the dynamic world of cloud computing, optimization isn't just about cost reduction. It involves a fine balance between managing costs and maximizing value while ensuring efficient resource allocation.
The rise of hybrid - launching Avantra editions
When we introduced Avantra Enterprise edition in 2021, we envisioned a world where we could interconnect enterprise observability, sophisticated workflows, and our advanced automation engine. By combining these three capabilities, we believed we could create a self-healing SAP environment which could identify problems and needs, route them to the right approver or expert, and automate problem resolution as well as complex project runbooks.
Enhance network monitoring with the latest AI-powered features in OpManager
Network monitoring is a challenging job because networks continue to evolve to meet ever-changing client requirements. Businesses today heavily depend on their networks, and even a short outage can lead to penalties and lost profits. This is why your monitoring tool must also transform itself to not only scale as you grow but offer new features that address new challenges posed by the increasing usage demands placed on your network.
How to Reduce the Volume of NGINX Logs
Head in the Clouds: Data Value and Versatility with Splunk Cloud Platform
A gentle introduction to XDP
XDP, or eXpress Data Path, is a Linux networking feature that enables you to create high-performance packet-processing programs that run in the kernel. Introduced in Linux 4.8 and built on extended Berkeley Packet Filter (eBPF), XDP provides a mechanism to process network packets earlier and faster than is possible through the kernel’s native network stack. In this post, we’ll discuss.
The Most Reliable Educational Platform (LMS) for Schools and K-12 in 2023
To understand the reliability of the popular learning management systems (LMS), we analyzed incident and outage reports from the official status pages for Seesaw, Blackboard, Canvas by Instructure, PowerSchool, Nearpod, and Google Classroom over a one-year period.
40 Best Cloud Network Monitoring Tools of 2023 for All Platforms and Giants like AWS, Google, Azure, IBM, and Oracle
Querying InfluxDB Cloud with the Java Flight SQL Client
InfluxDB Cloud 3.0 is a versatile time series database built on top of the Apache ecosystem. You can query InfluxDB Cloud with the Apache Arrow Flight SQL interface, which provides SQL support for working with time series data. In this tutorial, we will walk through the process of querying InfluxDB Cloud with Flight SQL, using Java. The Java Flight SQL Client is part of Apache Arrow Flight, a framework for building high-performance data services.
Kentik OTT and CDN Analytics
Synthetics and Service Watch Dashboards
Full Overview: Reducing Web Server Logs (ex.NGINX)
Website Downtime: How to Identify and Resolve the Most Common Causes
Slow Site Performance? Top Tips to Diagnose and Optimize Your Website
Filtering Metrics by Labels in OpenTelemetry Collector
How to filter metrics by labels using OpenTelemetry Collector.
You can now add notes to downtime periods
Oh Dear offers many checks to ensure your website is healthy. The most popular check that is active for almost every site we monitor is the uptime check. When the uptime check detects that your site is down, it will notify you via one of our many available channels. The check will also create a downtime period visible on the uptime check results page. Here's what those downtimes might look like.
3 Ways to Break Down SaaS Data Silos
The Ins-and-Outs of Hardware Monitoring
Avid PC gamers know that if you want optimal performance, you have to push your computer to its limits. And if your gaming “rig” is not properly equipped with a large interior fan, your PC can overheat, resulting in more than a few performance issues. It is the same for enterprise-level devices or pieces of hardware: overheating creates problems. One such enterprise-level piece of hardware (and arguably the most crucial piece of equipment) is a server.
eG Enterprise adds Advanced Performance Monitoring of Snowflake
I’m delighted to share that version 7.2 of eG Enterprise has introduced support for performance monitoring of Snowflake databases. eG Enterprise’s integration with Snowflake enables complete visibility into the Snowflake architecture and operations, alongside the performance and costs of any dependent cloud hosted infrastructures such as AWS or Azure.
Modernizing Network Data Analytics With a Unified Data Repository
Analyzing multiple databases using multiple tools on multiple screens is error-prone, slow, and tedious at best. Yet, that’s exactly how many network operators perform analytics on the telemetry they collect from switches, routers, firewalls, and so on. A unified data repository unifies all of that data in a single database that can be organized, secured, queried, and analyzed better than when working with disparate tools.
Three Ways to Make the Most out of Honeycomb Metrics
A while ago, we added Metrics to our observability platform so teams could easily see system information right next to their application observability data—no tool or team switching required. So how can teams get the most out of metrics in an observability platform? We’re glad you asked! We had this conversation with experts at Heroku. They’ve successfully blended metrics and observability and understand what is most helpful to know.
Cisco AppDynamics innovations in DEM, agent management and SAP
Check out our new features: correlated network insights, solving agent management challenges and expanded support for SAP environments. Cisco AppDynamics has several leading observability feature additions to introduce this spring. Read on to learn more.
Overcoming Kubernetes Monitoring Challenges with Observability
At Logz.io, we’re seeing a very fast pace of adoption for Kubernetes–at this point, it’s even outpacing cloud adoption, with companies running on-prem fully adopting Kubernetes in production. Why are companies going in this direction? Kubernetes provides additional layers of abstraction, which helps create business agility and flexibility for deploying critical applications. At the same time, those abstraction layers create additional complexity for observability.
How Monitoring as Code Reduces the Time to Detect and Resolve Issues
A web application or an API breaking is a matter of when, not if. Whether the cause is buggy code making it to production or infrastructure failing to support the software built upon it, incidents of varying severity are the norm rather than the exception, appearing frequently enough that the industry has coined the terms Mean Time To Detect (MTTD) and Mean Time To Recovery (MTTR).
Datadog's shocking bill of $65 million, pricing comparison of SigNoz with other tools - SigNal 24
Introducing Charts v3.0: Slice, dice, filter and pivot the data in any way possible!
Monitor Your Applications Through New Relic via OpenTelemetry Over HTTP
As a big proponent of open source and all things open, I jumped at the opportunity to expand on Cribl Stream’s OpenTelemetry implementation. I’m happy to report that as of Cribl Stream 4.1, both our OpenTelemetry source and destination now support OTLP over HTTP!
Rollbar Item Detail Overview and Usage
Use Canvas panels to customize visualizations in Grafana
The Canvas panel, which will be Generally Available in Grafana 10, combines the power of Grafana with the flexibility of custom elements. Canvas visualizations are extensible, form-built panels you can use to explicitly place elements within static and dynamic layouts. This empowers you to design custom visualizations and overlay data in ways that aren’t possible with standard Grafana panels, all within Grafana’s UI.
IT Operations in 2023: AI/ML & Automation Will Continue to Be the North Star
The use of statistics, advanced algorithms and AI/Ml is becoming omnipresent. The benefits are visible in every walk of life, from web searches, to movie and retail recommendations, to auto-completing our emails. Of course, not many anticipated the dramatic entrance of generative AI in the form of ChatGPT for writing college essays and poetry on arcane topics.
Upgrading NPM and SAM to Hybrid Cloud Observability
Web Fonts and the Dreaded Cumulative Layout Shift
How frustrating is it when you’ve just landed on a web page, you click on a certain element and an ad or something else pops up and you end up clicking that thing instead? That’s a layout shift, which is bad for the user’s experience and the later they happen, the worse it is. Research from HTTP Archive shows that over 80% of websites use web fonts. Web fonts also cause layout shifts, if they’re not being loaded strategically.
Livestream AMA: Profiling to Solve Code-Level Performance Bottlenecks
Modernize your monitoring: an interview with Chris Kline
Transforming Monitoring with a Machine Learning-First Approach
Unlocking the full potential of monitoring through ML integration, anomaly detection, and innovative scoring engines. Machine Learning has been making waves in various industries, but its adoption in the monitoring and observability space has been slower than expected. Many “ML” features remain gimmicky and do not provide actual real world value to users that encourages their further use.
Top 30 Network Connection Monitoring Tools for Seamless Connectivity
Understanding Global Internet Connectivity Trends
Who should define Reliability - Engineering, or Product?
Whoever owns Reliability should define its parameters. But who owns the Reliability of a Product? Engineering? Product Management? Or the Customer success team?
Endpoint Performance Monitoring: Tools and Best Practices
There’s no doubt that the majority of businesses and organizations would struggle to survive without endpoints. Because endpoints directly contribute to a business’s production and success, ensuring that these devices function at peak performance is a top priority for IT teams and MSPs. However, the number of endpoints an organization uses is skyrocketing, and now the average enterprise has approximately 135,000 endpoint devices in use.
InfluxDB and PySpark
Retrace - Custom Instrumentation (Untracked Application Code)
ScienceLogic is a TrustRadius Top Rated Award Winner for Eight Categories in AIOps
Trusted Research and Review Organization Recognizes ScienceLogic as Industry’s Best for the Fourth Straight Year.
NiCE Active 365 Management Pack 4.2
As more and more companies move towards Microsoft 365, it’s essential to have the right tools to monitor the platform effectively. Monitoring Microsoft 365 can be a complex task requiring advanced monitoring tools to ensure the smooth and uninterrupted functioning of the platform. This is particularly important for businesses that rely heavily on Microsoft 365 for daily operations.
Monitor your OpenAI usage with Datadog
OpenAI is an AI research and development company whose products include the GPT family of large language models. Since the introduction of GPT-3 in 2020, these models’ fluent and adaptable processing of both natural language and code has propelled their rapid adoption across diverse fields. GPT-4, ChatGPT, and InstructGPT are now used extensively in software development, content creation, and more.
InfluxDB 3.0 vs ADX
Over the past few years, time series is one of the fastest growing database categories in the world. As more and more organizations realize how critical time series data is to their operations, more database options entered the market. InfluxDB has been the leading time series database for years, and with the release of InfluxDB 3.0, it remains at the vanguard of the time series world.
Site24x7 integrates with Zoho Directory for a simple, secure, and native user access management
User management poses a significant challenge to business and IT teams alike. Privacy and compliance regulations necessitate restricted access to critical production environments along with any IT tools used within the organization. When personnel transition to new roles, organizations, or departments that no longer require access to production environments, it is imperative that business and IT teams swiftly remove their permissions to avoid any issues that could arise during audits.
What is the difference between SSL vs. TLS? Which Gives Your Website the Best Protection?
One of the most important considerations if you're seeking maximum security for your website is using encryption protocols. You have two choices: SSL (secure sockets layer) and TLS (transport layer security). These commonly used protocols encrypt internet communications and protect sensitive website data from malicious attacks. Let's cover the key differences between SSL and TLS and point you in the right direction for choosing the best protocol for your website.
Introducing Checkly's New Look for a New Era
We are thrilled to unveil our new branding and website, reflecting our commitment to providing engineers with the best monitoring as code (MaC) platform for modern software stacks. Our rebranding efforts signify a new era for Checkly and highlight our commitment to continuous innovation and dedication to enabling a MaC workflow for you and your teams.
Splunk Wins 24 TrustRadius Top Rated Awards
How to monitor Oracle Database with Grafana Cloud
Oracle Database is an enterprise multi-model database system capable of handling large amounts of data across multiple database servers with support for a wide variety of workloads. It’s a widely used and proven database software, so we are incredibly pleased to announce that it now has a dedicated cloud integration in Grafana Cloud. With the Oracle Database (OracleDB) integration, you can monitor your database’s performance with ease.
Network Automation: Top Use Cases and Benefits
Network automation enables teams to use software to plan, develop, operate, or optimize networks with little or no human intervention. Effectively, network automation leverages some logic to execute “task A” when “event B” happens. Network automation can be used in a range of ways, anything from AI-driven network analytics to traditional health checks. Do you want to know how network automation can help your business? Keep reading.
Top Five Firewall Monitoring Best Practices
In today's hyper-connected world, cyber threats are an ever-present challenge that organizations of all sizes must face. With cybercriminals becoming increasingly advanced, prioritizing monitoring and managing your firewalls to safeguard your digital assets has never been more critical. This article aims to comprehensively understand five essential firewall monitoring best practices to fortify your network and protect your valuable data.
Collaboration Experience: Latest Update Is More Comprehensive and Easier to Use
We are excited to announce the availability of an all new, detailed and comprehensive Collaboration Experience Library pack with the 2023.4 release. This library pack gives Collaboration Experience users much greater insights for faster and more efficient troubleshooting of employee experience issues with Teams and Zoom calls. Full function workflows are included: All are designed to together simplify and speed the Collaboration Application issue workflow.
Simplifying Network Security: How AI is Changing the Game
As companies come to rely on digital systems in everything they do, network security has become more important than ever. Unfortunately, with that digital transformation comes complex networks to support it, and thus complex network security.
LogicMonitor earns multiple Top Rated awards from TrustRadius
Our Opsgenie integration is now available
When we detect a problem with your site we can notify you via mail, a slack message, a webhook, or any of our other notifications channels. For most of our users this is enough, but those work in larger teams often need more flexibility. Today, we are launching our Opsgenie integration, a modern incident management platform.
Application Experience: Faster Value and More Comprehensive than Ever
We are excited to announce the availability of significant enhancements to Application Experience and its use-cases and capabilities. For Application Experience, the 2023.4 release delivers an all-new Library Pack, coupled with several in-product enhancements to offer customers faster time to fully configured operation and increased value.
Datadog integration roundup: Apache Impala, CockroachDB, and more
At Datadog, we’re constantly developing new integrations to give you complete, end-to-end visibility into your entire system. Here are just a few of our latest releases.
6 Best CloudHarmony Alternatives To Consider in 2023
With CloudHarmony retiring on May 15th, 2023, let’s look at CloudHarmony alternatives that can provide you with information on cloud services and help you navigate through comparing one provider to another.
Best 19 Performance Monitoring Tools: APM vs. NPM
Planning in customer service: manage emergencies caused by customers' poor planning
Checkly Unveils Innovative CLI Uniting Monitoring and Testing Through a Monitoring as Code Workflow
Catchpoint Announces Free Carbon Footprint Measurement and Optimization for Websites
Faster Debugging with Collaborative Troubleshooting Tools
As developers we understand the critical role teamwork and collaboration play in solving complex problems. Often, it’s that second set of eyes that uncovers an additional issue or sheds light on the root cause of a stubborn bug. Effective collaboration becomes a critical factor in determining a team’s success or failure, especially when debugging or troubleshooting problematic issues within complex applications.
The Future of Monitoring is Automated and Opinionated
So, you think you monitor your infra? As humanity increasingly relies on technology, the need for reliable and efficient infrastructure monitoring solutions has never been greater. However, most businesses don't take this seriously. They make poor choices that soon trap their best talent, the people who should be propelling them ahead of their competition.
Reduce cardinality and costs with Grafana Cloud Adaptive Metrics
Introducing RapidSpike Wallboards
You can find out more about our Custom Dashboards here: https://www.rapidspike.com/kb/custom-dashboards/
Performance Indicators: 12 Types of KPIs & When to Use Them
Introducing Adaptive Metrics: A new cost management feature in Grafana Cloud
You’ve convinced your organization that cloud native is the way forward. You’ve championed Kubernetes and sworn by Prometheus. You’ve onboarded multiple teams to your centralized observability platform. Then you open your latest bill and see a lot of commas in your invoice, and a sinking feeling sets in. Sound familiar? We’re keenly aware of the pain this can bring. As metric cardinality grows in cloud native environments, so does the cost to store and retrieve the data.
Resilience and Redundancy in Networking
Predictability in network flows is the ability to consistently deliver traffic from one point to another, even in the face of disruptions. Yet, establishing predictability has its share of challenges. Learn all about resilience in networking and how it relates to redundancy.
Ask Miss O11y: To Metric or to Trace?
Dear Miss O11y, I remember reading quite interesting opinions from you about usage of metrics and traces in an application. Did you elaborate on those points in a blog post somewhere, so I can read your arguments to forge some advice for myself? I must admit that I was quite puzzled by your stance regarding the (un)usefulness of metrics compared to traces in apps in some contexts (debugging).
Mythbusting IPv6 with Jan Zorz, and Why IPv6 Adoption is Slow
IPv6 was developed in the late 1990s as a successor to IPv4 in response to widespread concerns about the growth of the Internet and its potential impact on the existing IPv4 address protocol, in particular potential address exhaustion. It was assumed that after some time as a dual-stack solution, we would phase out IPv4 entirely. Almost twenty-five years later, however, we are approaching full-scale depletion of IPv4 addresses, in part because IPv6 adoption is still lagging.
Building a Greener Digital Future: Catchpoint Launches Carbon Control
In our quest for a greener planet, we have become increasingly aware of the detrimental effects of single-use products like plastic bottles, coffee cups, and plastic bags on greenhouse gas emissions. However, there exists an ominous carbon culprit that goes largely unnoticed—the carbon footprint of the Internet.
A Comprehensive Guide to Troubleshooting Celery Tasks with Lightrun
This article explores the challenges associated with debugging Celery applications and demonstrates how Lightrun’s non-breaking debugging mechanisms simplify the process by enabling real-time debugging in production without changing a single line of code.
Tame the performance of code you didn't write: A journey into stable diffusion
In our daily lives as developers, we have to deal with a lot of code that we did not write ourselves (or wrote ourselves but already forgot that we did). We use tons of libraries that make our lives easier because they deal with complex stuff like machine learning, time zones, or printing. As a result, much of the code base we work with on a daily basis is a black box to us. But there are times when we need to learn what is happening in that black box.
How to Choose the Best CDN Monitoring Tool for Your Needs
Rich content like videos and graphics used to cause network congestion and long load times when all the content was stored on a centrally located server. Fortunately, Content Delivery Networks (CDNs) came to the rescue in the late 1990s, letting users load rich content from a location geographically closer to them and reducing load times by distributing a cached version of content across servers worldwide.
The Importance of an API Observability Pipeline for SaaS Tools
Third-party APIs and cloud based software as a service (SaaS) tools have become a cornerstone of modern enterprises. It is essential to monitor log data and optimize API performance. This will ensure that development teams provide the desired advantages to clients and users. To address this challenge, businesses can use an observability pipeline. It is a set of tools and processes that monitor and analyze data from various sources. That includes third-party APIs and SaaS tools.
The Met Office gains valuable data insights to make informed decisions with Elastic
Announcing Checkly CLI GA and Test Sessions Beta
Today the Checkly CLI is generally available. Together with its companion — the new test sessions screen (in beta) — this marks a big milestone for us at Checkly and our users. We already talked about monitoring as code and the CLI during its alpha and beta testing phases but here is a short recap. With the Checkly CLI you have the most powerful monitoring as code workflow at your fingertips.
Checkly CLI is Now GA, and We've Launched Our New Website and Branding
We believe monitoring should be set up as code and live in your repository. Today, we are thrilled to announce that our Checkly CLI is now available to everyone! The CLI is our native tool enabling monitoring as code (MaC). This is a significant achievement for us, and we owe it to our users who beta-tested the CLI and gave us valuable feedback over the past few weeks.
VoIP Monitoring 101: Keeping Your Calls Crystal Clear
There's power in your data - 5 Secrets to solving Citrix Problems
Data can be overwhelming. The purpose of this blog is help you sift through data to find exactly what you need to use it in a meaningful way when solving Citrix problems. After working in performance benchmarking and analysis, one thing I noticed is only the really really big companies have full-time staff dedicated to doing analysis on a daily basis. Which means, it’s up to the generalists, or Jacks and Jills-of-all-trades, to review data and make sense of it. How does one do this?
Flowmon Integrations into Enterprise Ecosystem
Flowmon is not a stand-alone system used in isolation. It is part of an ecosystem of monitoring and security tools used across the enterprise. Recently, we have introduced new integrations with Splunk and ServiceNow to simplify interoperability and enable IT and security teams to be more efficient. This is a good opportunity to remind of all the integration options and resources we have.
What do self-driving cars tell us about Site Reliability Engineering?
From Robocars to Reliability — SRE with self-driving cars; mapping out where the Observability space is in conjunction with self-driving cars.
Don't miss out on Windows! Pandora FMS has the key to its monitoring
Building MJML email templates with Gulp
This is the second post in the series about building email templates with MJML and deploying them on AWS. In the previous post, we learned about MJML and Handlebars.js for creating cross-browser email templates with dynamic content. In this post, I will show you how you can script the building process of MJML emails and prepare them for upload on AWS. Let's do a quick recap. In the previous post, I created a simple mail template in MJML.
Checkly's New Look for a New Era
How to use VictoriaMetrics for monitoring with Netdata Agent
Netdata Agent is an open-source monitoring agent capable of collecting metrics from various sources and visualizing them in real-time. It is able to discover and collect metrics with zero configuration, providing a quick and easy way to monitor systems.
3 Observability Takeaways from DevOps Pulse 2023
The observability landscape is changing fast, as organizations look to deploy applications and separate themselves from competition at a breakneck pace. What are the trends organizations need to be aware of as they make sense of the landscape? Every year, we at Logz.io set out to answer this question by going right to the DevOps and observability practitioners on the front lines.
New Logz.io Platform Feature: The Home Dashboard
Managing observability data can feel like a juggling act. Modern cloud applications generate vast amounts of data, and quickly accessing the most important data is a fundamental step toward quickly gaining unobstructed visibility into your infrastructure and applications. Yet, when data volumes grow, complexity follows. Many observability users find it overwhelming to assess the critical data generated from their complex infrastructure and applications.
Industry Experts Discuss Cybersecurity Trends and a New Fund to Shape the Future
In this live stream discussion, angel investor Ross Haleliuk joins Cribl’s Ed Bailey to make a big announcement about his new fund to shape the future of the cybersecurity industry. Ross is a big believer in focusing on the security practitioner to provide practical solutions to common issues by making early investments in companies that will promote these values.
Monitor Disk Space on Servers Without Installing Monitoring Agents
Let’s say you want to get an email notification when the free disk space on your server drops below some threshold level. There are many ways to go about this, but here is one that does not require you to install anything new on the system and is easy to audit (it’s a 4-line shell script).
How to: Search your logs using query language in AppLogs
6 Project Ideas to Get Started with IoT
A look at the main things you need to consider when planning your IoT project with links to tutorials and source code. There’s a lot of stuff written about the Internet of Things (IoT) at a conceptual level that doesn’t really cover anything concrete. If you’ve ever wanted to get started on a real IoT project but didn’t know where to start, you are in the right place.
Best 37 VoIP Monitoring Tools of 2023
Top 15 Tools to Back Up Your Website Externally
There are two types of website owners: those who back up their website data, and those who will soon start doing it. Backing up a website’s data is so critical; losing data can result in substantial revenue loss. There are various methods of backing up your website. This article outlines the top 15 tools for backing up your website externally. We will have an overview of each tool along with its benefits and drawbacks.
GigaOm Names Broadcom Highest Scoring Leader for Third Straight Year in 2023 Radar Report for Network Observability
Broadcom has been named the highest-scoring vendor for the third consecutive year in a row in the 2023 Radar Report for Network Observability.
Release 1.39.0: A new era for monitoring charts.
Another release of the Netdata Monitoring solution is here!
Using AIOps effectively with Elastic Observability
Over the past several years, one topic that has become of increasing importance for DevOps and site reliability engineering (SRE) teams is AIOps. Artificial intelligence for IT Operations (AIOps) is the application of artificial intelligence (AI), machine learning (ML), and analytics to improve the day-to-day operational work for IT operations teams.
Release 1.39.0 - Charts 3.0, Windows Support, Virtual Nodes, Custom Labels, and more
Monitor More of Your Modern IT Infrastructure Webinar
Our Super Friendly AI Sloth that Analyzes Your Performance Data
Streamline network investigations with an enhanced querying and map experience
Effective network troubleshooting requires collecting and correlating thousands of data points across your entire stack. The more data you ingest, however, the more data you have to search through in order to locate important signals. This can make it hard to find the information you need during time-sensitive investigations.
Best 36 Network Bandwidth Monitoring Tools of 2023 (Home, Free & Professionals)
Errors Got You Down? Honeycomb and OpenTelemetry are Here to Help
It’s 5:00 pm on a Friday. You’re wrapping up work, ready to head into the weekend, when one of your high-value customers Slacks you that something’s not right. Requests to their service are randomly timing out and nobody can figure out what’s causing it, so they’re looking to your team for help. You sigh as you know it’s one of those all-hands-on-deck situations, so you dig out your phone and type the "going to miss dinner" text.
Kubernetes Monitoring with OpenTelemetry
Organizations increasingly deploy and manage their applications using Kubernetes, which has emerged as the de facto standard for container orchestration. Monitoring these resources becomes critical for ensuring that the applications running on the platforms remain healthy.
7x more value for money than Datadog - SigNoz
Mastering Kubernetes Troubleshooting with StackState | Civo TV
Cribl Reference Architecture Series: How SpyCloud Architected its Cribl Stream Deployment
Top metrics for Elasticsearch monitoring with Prometheus
Starting the journey for Elasticsearch monitoring is crucial to get the right visibility and transparency over its behavior. Elasticsearch is the most used search and analytics engine. It provides both scalability and redundancy to provide a high-availability search. As of 2023, more than sixty thousand companies of all sizes and backgrounds are using it as their search solution to track a diverse range of data, like analytics, logging, or business information.
How can Internet Resilience help eCommerce players drive more revenue?
Catchpoint and ITOps Times have teamed up to break down 6 critical topics you need to understand to ensure Internet Resilience for your business in a bi-weekly microwebinar series, each lasting less than 10 minutes. Explore each of the topics in the series: In this third installment, we’ll talk about why Internet Resilience is critical for retail and eCommerce companies. Now, let’s get into the episode!
What Is Prompt Engineering? Strategies for Creating Effective AI Inputs
30 Network Monitoring Tools With All The Information You Need of 2023
Metrics, Logs and Traces: More Similar Than They Appear?
This article was originally published in The New Stack and is reposted here with permission. They require different approaches for storage and querying, making it a challenge to use a single solution. But InfluxDB is working to consolidate them into one. Time series data has unique characteristics that distinguish it from other types of data. But even within the scope of time series data, there are different types of data that require different workloads.
OpenTelemetry Tutorial: Collect Traces, Logs & Metrics with InfluxDB 3.0, Jaeger & Grafana
Here at InfluxData, we recently announced InfluxDB 3.0, which expands the number of use cases that are feasible with InfluxDB. One of the primary benefits of the new storage engine that powers InfluxDB 3.0 is its ability to store traces, metrics, events, and logs in a single database. Each of these types of time series data has unique workloads, which leaves some unanswered questions. For example: Luckily this is where our work within OpenTelemetry comes into play.
How To Monitor MemoryDB with MetricFire
Memory databases are known for their ability to store and manage large volumes of data in memory. Their memory-based architecture allows users to quickly retrieve critical information and benefit from performant data reading. Thanks to these characteristics, businesses use memory databases for various applications that require prompt data access playing a vital role within their digital resources.
APM's Trace Analyzer
Head in the Clouds: Speed Up Your Innovation With Splunk Cloud Platform
5 reasons why OVHcloud migrated its time series data to Grafana Mimir
A sysadmin in the high performance computing world since 2008, Wilfried Roset is now working with the open source databases and observability environment at OVHcloud. He leads a team focused on building industrialized, resilient, and efficient solutions. For nearly two decades, OVHcloud has been a leader in cloud hosting and has been Europe’s largest provider since 2011. To serve our 1.4 million customers globally, we need a reliable and scalable observability platform.
Simplifying Agent Management
The Platform Engineer Role Explained: Who Is a Platform Engineer?
Basic Linux Monitoring with Pandora FMS
Fully Correlated Serverless Observability
Observability in Action - OpsRamp Demo
Debugging tips for common issues with cloud-based applications
Debugging in a cloud environment can be tricky, as it involves multiple layers of abstraction and virtualization. Unlike traditional on-premise environments, cloud environments are highly distributed and dynamic, making it challenging to identify and troubleshoot issues. One of the biggest challenges with debugging cloud applications is the need for more visibility into the underlying infrastructure and the complexity of the application architecture. Fortunately, pinpointing and resolving the cause of the issue is much more manageable with server-side monitoring, detailed error reporting and cloud debugging solutions.
Cloud Transformation Strategy & Solutions
Cloud transformation is real. And it's spectacular. According to global business management and consulting firm McKinsey & Co., cloud transformation is the engine driving $1 trillion in economic activity for Fortune 500 companies alone. Innovations enabled by the cloud touch nearly every aspect of running a successful business, including the development of new products and services, access to new customers and markets, frictionless transactions, streamlined communication and collaboration, and access to talent without concern for traditional geographic barriers.
Build the ROI Case for Improving Employee Digital Experience
Budgeting for user experience management solutions has been dynamic recently. When the pandemic hit, corporations freely opened the purse strings to ensure that employees had the tools to work outside the traditional office. The Return on Investment (ROI) for improving the overall Digital Employee Experience (DEX) didn't matter so much. With inflation now the main topic in executive meetings, the strings for DEM/DEX investments have been drawn tighter. Gartner has published a report titled "Market Guide for Digital Experience Monitoring" which states that "enterprises that invest in DEM solutions can expect a 30% reduction in Mean Time to Resolution (MTTR) and a 20% reduction in downtime."
From Silos to Collaboration: How to Democratize Data in Product Analytics
What is multi-tenancy? Multi-tenancy for MSPs Explained.
Multi-tenancy is an architecture in which a single instance of a software application and its underlying resources serves multiple customers, each customer is called a tenant. Multi-tenant architectures are the foundation of most SaaS offerings. Monitoring and troubleshooting multi-tenancy architectures can be challenging.A tenant can be an individual user, but more commonly, it is a group of users like a customer organization.
8 Best Observability Tools and the Right One for You
For many of us in the software development world, observability tools are a must-have for effectively debugging applications and infrastructure. And doing the job right means selecting the right observability tool. Some might look for a fully featured enterprise solution, while others may simply search for the best open-source solution. But regardless of your approach, you have a number of considerations when selecting the right observability tool.
Introducing Rollbar Analyze
We are excited to announce the rollout of our new Rollbar Improve component, Analyze. As we strive to provide you with the best possible tools to monitor, understand, and improve your code, we've combined two powerful features, RQL and Metrics API, into one comprehensive package. Analyze is designed to deliver even more powerful insights to help your teams better understand your code and make data-driven decisions.
Introducing the Grafana Labs Bug Bounty Program
At Grafana Labs, we value the open source community and recognize the power of crowdsourcing. This is why we have decided to launch our very own bug bounty program, managed in-house by our own team, to encourage ethical hackers from around the world to help us find and responsibly report security vulnerabilities in Grafana Labs software.
Feature Focus: April 2023
You know the old saying, I’m sure: “April deploys bring May joys.” Okay, maybe it doesn’t go exactly like that, but after reading what we’ve been up to for the past month, I think it might be time for an update. Let’s dive into our Feature Focus April 2023 edition.
Code Instrumentation Practices to Improve Debugging Productivity
Code instrumentation is closely tied to debugging. Ask one of the experienced developers and they will swear by it for their day-to-day debugging needs. With modest beginnings in the form of print statements that label program execution checkpoints, present-day developers employ a host of advanced techniques for code instrumentation. When carried out in the right way, it improves developer productivity and also reduces the number of intermediate build/deployment cycles for every bug fix.
Unlock the Secrets of Kernel Memory Usage
The mem.kernel chart in Netdata provides insight into the memory usage of various kernel subsystems and mechanisms. By understanding these dimensions and their technical details, you can monitor your system's kernel memory usage and identify potential issues or inefficiencies. Monitoring these dimensions can help you ensure that your system is running efficiently and provide valuable insights into the performance of your kernel and memory subsystem.
Monitoring Disks: Understanding Workload, Performance, Utilization, Saturation, and Latency
Netdata provides a comprehensive set of charts that can help you understand the workload, performance, utilization, saturation, latency, responsiveness, and maintenance activities of your disks. In this blog we will focus on monitoring disks as block devices, not as filesystems or mount points. The Disks section in the Overview tab contains all the charts that are mentioned in this blog post.
Monitoring to Infinity and Beyond - How Netdata Scales Without Limits
Scalability is crucial for monitoring systems as it ensures that they can accommodate growth, maintain performance, provide flexibility, optimize costs, enhance fault tolerance, and support informed decision-making, all of which are critical for effective infrastructure management.
The correlation between application experiences and securing top talent
In a competitive labor market, organizations need seamless digital experience to attract new talent. Recent research from Cisco AppDynamics reveals the importance that job seekers and employees are attaching to digital experiences as the search for talent is intensifying in many industries. 97% of people state it is important that the applications they use to find and apply for jobs provide a fast and seamless experience, without any delays or disruption.
Feature Spotlight: Kubernetes Remediation Guides Make Everyone Effective in Troubleshooting
If you're accustomed to running software in production, you know that every minute counts when there's a disruption. However, not every issue is obvious enough to immediately find and remediate. That can be a big obstacle to overcome, which is where StackState's Kubernetes remediation guides come into play. They contain expert knowledge that guides you step by step to understand the issue, enabling swift remediation.
Streamlining Troubleshooting for Work-from-Home Users: Tips for Effective Active Monitoring
It may feel like ancient history, but it was only a few years ago that, in response to the pandemic, organizations made a wholesale shift to support hybrid work models—and did so literally overnight, in many cases. While some time has passed, this is a shift to which many IT organizations are still struggling to fully adapt.
Monitor OTel-instrumented apps with support for W3C Trace Context
To get visibility into highly distributed applications, organizations often use various tracing tools that are best suited to each individual service owner’s specifications. However, when a request travels between services that have been instrumented with different tools, the trace data may be formatted differently, resulting in broken traces.
Deciphering Complex Logs With Regex Using BindPlane OP and OpenTelemetry
This Month in Datadog: DASH 2023, In-App WAF and User Protection, Cloudcraft for Azure, and more!
Strengthen Your Security Strategy to Safeguard Against Migrations Risks
In part 1 of this post, we talked about how Cribl is empowering security functions by giving our customers freedom of choice and control over their data. This post focuses on their experiences and the benefits they are getting from our suite of products. In a past life, I was in charge of security and operational logging at Transunion — around 2015, things started going crazy.
Profiling from Sentry: Identify and Eliminate Performance Bottlenecks with Code-level Insight
Users are complaining about slow load times and you’ve thrown logs, traces, and metrics — heck, the entire kitchen sink of performance monitoring — at your application, but you still can’t figure out the source of the bottleneck. Maybe you missed adding instrumentation to something in the critical path, or you’re simply testing in an environment vastly different from the ones your users are experiencing in production.
How to use Elasticsearch and Time Series Data Streams for observability metrics
Elasticsearch is used for a wide variety of data types — one of these is metrics. With the introduction of Metricbeat many years ago and later our APM Agents, the metric use case has become more popular. Over the years, Elasticsearch has made many improvements on how to handle things like metrics aggregations and sparse documents. At the same time, TSVB visualizations were introduced to make visualizing metrics easier.
Prioritizing Defects with the New Auto Grouping Feature
BugSplat's new auto-grouping feature is a powerful way to automatically group crashes in a way that's meaningful to your team. Normally, crashes are grouped by the top of the call stack. But sometimes this grouping isn't ideal. For example, if the top of your call stack is KERNELBASE!RaiseException (a Windows OS function) you'd probably prefer the crashes were grouped by a different stack frame. That's what BugSplat's auto-grouping feature does!
New in Grafana 9.5: Debug Grafana instances faster with support bundles
With the arrival of Grafana 9.5, we’re excited to introduce Grafana support bundles — a tool to help debug your Grafana instance faster and more easily. Support bundles provide a simple way to gather and share information about your Grafana instance, and this feature is available across all tiers in Grafana Cloud as well as in Grafana OSS and Grafana Enterprise.
Monitoring of Event-Driven System Architecture
Event-driven architecture is an efficient and effective way to process random, high-volume events in software. Real-time monitoring of event-driven system architecture has become increasingly important as more and more applications and services move toward this architecture.
Understanding Azure Function App Metrics
InfluxDB V3 Python CLI and Client Library
Cloud Cost Management Demo
Applying Zero Trust to Data Centre Networks
Microsoft DCOM hardening and its impact on Applications Manager
Microsoft recently acknowledged a critical vulnerability in the WMI connection affecting the DCOM protocol, which allowed attackers to bypass DCOM server security, elevate their privileges, and gain unauthorized access into the systems.
Observability: What Is It and What Tools Should You Be Using?
Delete Without Deleting
3-2-1 UltraHot | A CTO, Hot Sauce & Big Data Analytics
Grafana Agent v0.33 release: reusable pipelines, monitoring Kubernetes pods, and more
Grafana Agent v0.33 is here! This new release includes a lot of exciting features, such as a powerful way to configure Grafana Agent with Flow Modules and the ability to monitor Kubernetes pods in your cluster with an Operator Flow component. We also added many more Flow components making the Flow ecosystem bigger!
A Simplified Guide to Implementing Full-Stack Observability
Releases blooming this April: New APAC Locations, Purchase Permissions, and more!
April has come and gone, and we’ve got more exciting news to show for our efforts! This month, our teams have been hard at work: Keep reading for more details!
Backfill Missing Time Series With SQL
Time series data streams are often noisy and irregular. But it doesn’t matter if the cause of the irregularity is a network error, jittery sensor, or power outage – advanced analytical tools, machine learning, and artificial intelligence models require their data inputs to include data sets with fixed time intervals. This makes the process of filling in all missing rows and values a necessary part of the data cleaning and basic analysis process.
Observability, Meet Natural Language Querying with Query Assistant
Engineers know best. No machine or tool will ever match the context and capacity that engineers have to make judgment calls about what a system should or shouldn’t do. We built Honeycomb to augment human intuition, not replace it. However, translating that intuition has proven challenging. A common pitfall in many observability tools is mandating use of a query language, which seems to result in a dynamic where only a small percentage of power users in an organization know how to use it.
The Future of Website Development: Exploring the Impact of Artificial Intelligence and Machine Learning
Artificial intelligence (AI) and machine learning (ML) are two cutting-edge technologies that are revolutionizing the field of website development. AI refers to the ability of computers to perform tasks that typically require human intelligence, such as recognizing speech, understanding natural language, and making decisions based on data. On the other hand, ML is a subset of AI that involves training algorithms to learn from data and make predictions or decisions based on that learning.
Ensure release safety with feature flag tracking in Datadog RUM
Developers and teams who want to deploy new code often and safely leverage feature flags to decouple code deployments from feature releases. Feature flags enable teams to release new features to a subset of users, making it possible to test a new feature’s impact on users and ensuring that developers can easily roll back the feature if it causes downstream issues.
Code Instrumentation in Cloud Native Applications
Cloud native is the de facto standard approach to deploying software applications today. It is optimized for a cloud computing environment, fosters better structuring and management of software deployments. Unfortunately, the cloud native approach also poses additional challenges in code instrumentation that are detrimental to developer productivity.
Using Practical Alerting to Stay on Top of Teams Call Quality - Part 2
Running your business using Teams isn’t without its challenges. We already did a post here about some of the Microsoft Teams alerts IT teams need to be alerted to sooner rather than later. But, because of how complex large Teams setups are, we’ve got a few more to add to the collection. Today, we’re focusing on the Microsoft-specific challenges you might face.
Kentique - The Fragrance of Observability
RCA Series: What is Root Cause Analysis? (1/4)
RCA Series: Root Cause Analysis in Observability with Elastic AIOps (2/4)
RCA Series: Accelerate security investigations w/ machine learning and Elastic (3/4)
RCA Series: Root Cause Analysis in Manufacturing, Electric Grids & Connected Devices (4/4)
Setting Up a Grafana Destination with BindPlane OP
Java Application Profiling with Prefix featuring OpenTelemetry
Scale Your Monitoring and Observability With Sensu
Sensu is the complete cloud monitoring solution for observability at scale, designed to give you rich insight and ensure that you know what’s going on everywhere in your system. With true multi-tenancy, an enterprise datastore that keeps pace as you scale, and streaming handlers to process all those events, you can rely on Sensu for cloud, container, and application performance monitoring that provides deep visibility into your entire infrastructure.
Unpacking the Hype: Navigating the Complexities of Advanced Data Analytics in Cybersecurity
We tell you with lots of humor why monitoring your equipment is no laughing matter
30 Best Network Performance Monitoring Software of 2023
Observability-OSS vs Paid vs Managed OSS
The Reliability industry needs a managed, non-vendor lock-in answer to spiraling costs, high cardinality and the toil of managing a tsdb.
The state of ITOM in 2023: Strategic insights into observability, AIOps, cloud migration, and more
As the IT operations environment grows increasingly intricate, businesses are starting to recognize the significance of a flawless customer experience. Customer expectations are getting higher by the day, to the point where organizations cannot afford even a few minutes of downtime or service degradation. To prevent this, they need to avoid outdated methods of operations and prevent downtime-causing issues proactively.
Avantra SAP security FAQ
We understand the importance of security when it comes to your SAP system(s) within your organization. As cyber attacks continue to become more successful, it is essential to have a process in place. Below are several frequently asked questions regarding security to provide some insight on our approach and how Avantra can help you navigate through this journey.
Running Postgres in Docker
So you want to spin up a Postgres database on your local machine, but you don't fancy having to install and manage everything manually? Running Postgres inside Docker is a great way to simplify the situation. It lets you: In this article I will explain how to do this step by step.
Empowering Security Teams: The Importance of Data Control and Freedom of Choice
Enterprises are getting increasingly tired of feeling locked into vendors, and rightfully so. As soon as you put your observability data into a SaaS vendors’ storage, it’s now their data, and it’s difficult to get it out or reuse it for other purposes. As a result, strategic independence is becoming increasingly important as organizations decide what data management tools they’re going to invest time and resources into.
10 Mistakes to avoid when framing your IT Incident Management Strategy
An IT incident is an unplanned disruption that negatively impacts an IT service. As the importance of IT to the business has increased, the impact of IT incidents has become greater. IT incidents can result in revenue loss, loss of employee productivity, SLA financial penalties, government fines, and more. An effective IT incident management strategy is now essential in every organization. For a business like Amazon whose entire business relies on IT, a single second of slowness can cost over $15,000.
Serverless Monitoring (AWS Lambda) Demo
Datadog On Caching
IOException in Java
IOException is the most generic exception in a large group of Java exceptions that express input/output and networking errors in Java applications.
Understanding System Processes States
The different states of system processes are essential to understanding how a computer system works. Each state represents a specific point in a process's life cycle and can impact system performance and stability.
Understanding Linux CPU Consumption, Load, and Pressure for Performance Optimization
As a system administrator, understanding how your Linux system's CPU is being utilized is crucial for identifying bottlenecks and optimizing performance. In this blog post, we'll dive deep into the world of Linux CPU consumption, load, and pressure, and discuss how to use these metrics effectively to identify issues and improve your system's performance.
Understanding Context Switching and Its Impact on System Performance
Context switching is the process of switching the CPU from one process, task or thread to another. In a multitasking operating system, such as Linux, the CPU has to switch between multiple processes or threads in order to keep the system running smoothly. This is necessary because each CPU core without hyperthreading can only execute one process or thread at a time.
Swap Memory - When and How to Use It on Your Production Systems or Cloud-Provided VMs
Swap memory, also known as virtual memory, is a space on a hard disk that is used to supplement the physical memory (RAM) of a computer. The swap space is used when the system runs out of physical memory, and it moves less frequently accessed data from RAM to the hard disk, freeing up space in RAM for more frequently accessed data. But should swap memory be enabled on production systems and cloud-provided virtual machines (VMs)? Let's explore the pros and cons.
How Logz.io Reduced Internal Logs Volume by 50% Using Data Optimization Hub
Cost optimization has been one of the hottest topics in observability (and beyond!) lately. Everyone is striving to be efficient, spend money wisely, and get the most out of every dollar invested. At Logz.io, we recently embarked on a very interesting and fruitful data volume optimization journey, reducing our own internal log volume by a whopping 50%. In this article, I’ll tell you how exactly we achieved this result.
Gain real user monitoring insights with Grafana Cloud Frontend Observability
At ObserabilityCON 2022, we announced a limited private preview program for Grafana Cloud Frontend Observability, our hosted service for real user monitoring. Today we are excited to introduce a public preview program that makes Frontend Observability accessible to all Grafana Cloud users, including those in our generous free-forever tier. Simply look for Frontend under Apps in the left-hand navigation of the Grafana Cloud UI and click through to set up the feature. (Not a Grafana Cloud user?
Grafana Tempo 2.1 release: TraceQL performance improvements
Grafana Tempo 2.1 is out and comes with a host of TraceQL improvements. Tempo 2.1 comes with some nice incremental improvements to TraceQL and likely some breaking changes. There’s a section down below about those, too.
Simplifying agent management for AppDynamics SaaS and On-Premises
A new set of capabilities in Cisco AppDynamics SaaS and On-Premises deployments enables users to spend less time maintaining software for application performance monitoring. Agent management has historically been time-consuming, labor-intensive and required a high level of application experience.
Remote Query Solves the Observability Data Problem
We are caught in a whirlwind of rapid data change. As more engineers, services and sophisticated practices are helping generate an astronomical amount of digital information, there’s a growing challenge of the data explosion. Coralogix offers a completely unique solution to the data problem. Using Coralogix Remote Query, the platform can drive cost savings without sacrificing insights or functionality.
Troubleshooting Slow Draining SQS Queues
This post is part of an ongoing series about troubleshooting common issues with microservice-based applications. Read the previous one on intermittent failure. Queues are an essential component of many applications, enabling asynchronous processing of tasks and messages. However, queues can become a bottleneck if they don’t drain fast enough, causing delays, increasing costs, and reducing the overall reliability of the system.
How APM, Tracing, Logs & Metrics link SEAMLESSLY in Coralogix
Capture and Enrich ELB Logs in ONE MINUTE
Instantly Analyze MILLIONS of Logs with Loggregation
The Insider's Guide to Network Connectivity Monitoring: Keeping Your Connections Strong
Understanding Interrupts, Softirqs, and Softnet in Linux
Interrupts, softirqs, and softnet are all critical parts of the Linux kernel that can impact system performance. In this blog post, we'll explore their usefulness, and discuss how to monitor them using Netdata for both bare-metal servers and VMs.
The 7 Step Guide on How To Budget for Layer 2 and Layer 3 Switches
Sleep More; Triage Faster with Sentry
As a developer, triage duty week was often the worst week of my month. Anytime a bug was reported, I’d search for the right environment, wander through logs, pray there was an associated stack trace, use my mental mapping of our code base, and route bugs to the right teams. Developers on triage rotation need to ensure bugs are routed to the correct team along with adequate information to help the team investigate the bug.
Best 30 Enterprise Network Monitoring Software of 2023
Monitoring Azure Integration Services with Proactive Strategies
How OpManager improves the performance of your IBM devices with its extensive monitoring
IBM, popularly known as Big Blue, is one of the most recognized brands in the world. And rightfully so, considering their role in many of our technological innovations over the past century. IBM is among the top 5 vendors for servers and storage devices—commanding a major market share for both the products despite their recent shift of focus towards computing innovations like quantum computing. IBM also makes other hardware devices like routers, switches, printers, load balancers, and firewalls.
How to monitor cloud vendors with Notion and IsDown
In our modern business environment, it's important to stay updated on the status of the cloud services we use daily. Many companies depend on multiple cloud platforms for different aspects of their work, and having a single place to monitor them all can make a big difference. Notion, a popular all-in-one workspace tool, can help improve team communication, while IsDown makes it easy to track cloud vendors' status pages.
Cloud Provider Performance Monitoring: April 2023 Insights
Explore our insightful April 2023 report on the performance of top cloud providers. We've carefully assessed the health of these leading services by monitoring outages and issues throughout the month. Using data from their official status pages, we've normalized the information to create a clear and concise overview of their reliability. Find out how your favorite cloud provider stacks up in this essential report.
SNMP Monitoring: What is SNMP & How to Use It
Are you tired of constantly running back and forth to check the status of your network devices? Do you wish you had a magic wand that could tell you everything you need to know about your network at a glance? Well, unfortunately, we can't give you a magic wand, but we can give you something pretty close: SNMP monitoring!
Best Practices to Build IoT Analytics | InfluxData
This article was originally published in The New Stack and is reposted here with permission. Selecting the tools that best fit your IoT data and workloads at the outset will make your job easier and faster in the long run. Today, Internet of Things (IoT) data or sensor data is all around us. Industry analysts project the number of connected devices worldwide to be a total of 30.9 billion units by 2025, up from 12.7 billion units in 2021.
Enhanced Security, Improved Performance Reporting with DX UIM 20.4 Cumulative Update 7
In today's fast-paced digital world, keeping up with the latest technology advancements is crucial for businesses to stay ahead of the competition. This is especially true in the world of IT infrastructure management, where technology is rapidly evolving and new solutions are being developed to meet the changing needs of businesses.
Q&A: How the DoD Can Modernize Its Networks and Optimize User Experience
The Department of Defense (DoD) is on a mission to modernize its IT environments, radically changing the nature of its network operations (NetOps) in the department. Network availability and performance keep getting more integral to the DoD’s charter, which means downtime isn’t just troublesome, it’s a life-or-death matter. In this post, we’ll outline how key DoD modernization imperatives are affecting NetOps.
Logging for public sector: How to make the most of your mission-critical data
With governments doubling down on logging compliance, many public sector organizations have been focusing on optimizing their log management, especially to ensure they retain logs for required periods of time. Logs — though seemingly straightforward — are the backbone of many mission-based use cases and therefore have the potential to accelerate mission success when centrally organized and leveraged strategically. In public sector, logs are instrumental in.
Lightrun Bolsters Security Measures with Role-Based Access Control (RBAC)
Lightrun enhances its enterprise-grade platform with the addition of RBAC support to ensure that only authorized users have access to sensitive information and resources as they troubleshoot their live applications. By using Lightrun’s RBAC solution, organizations can create a centralized system for managing user permissions and access rights, making it easier to enforce security policies and prevent security breaches.
Our Favorite #chArt
Heatmaps are a beautiful thing. So are charts. Even better is that sometimes, they end up producing unintentional—or intentional, in the case of our happy o11ydays experiment—art. Here’s a collection of our favorite #chArt from our Pollinators Slack community. Today would be a great time to join if you’re into good conversation about OpenTelemetry, Honeycomb-y stuff, SLOs, and obviously, art.
Using SQL to fill time series data gaps in InfluxDB
Synthetic Monitoring Demo
Mastering Event Breaking Management with Cribl Stream
Log events come in all sorts of shapes and sizes. Some are delivered as a single event per line. Others are delivered as multi-line structures. Some come in as a stream of data that will need to be parsed out. Still, others come in as an array that should be split into discrete entries. Because Cribl Stream works on events one at a time, we have to ensure we are dealing with discrete events before o11y and security teams can use the information in those events.
Automating with LogicMonitor: Ansible, Terraform, Stackstorm
Instrumenting Java APM agent with Azure App Service
Building better mobile experiences: tips from Riot Games and Nextdoor
Building high quality, performant mobile apps is hard. Developers need to keep up with rapidly changing technologies, high user expectations, and competitive app stores. We sat down with Julius Skripkauskas and Walt Leung to discuss how mobile developers can build better mobile experiences, including choosing the right technology, focusing on the right KPIs, and staying on top of trends in device formats and AI.


