Operations | Monitoring | ITSM | DevOps | Cloud
December 2023
The Top 6 Root Cause Analysis Software and Tools
The heart of problem-solving is to outline and define the problem effectively, therefore, if you aren’t aware of what the problem is then it’s particularly challenging to accurately problem solve. This is where root cause analysis tools come in, root cause analysis software and tools are designed to identify the the cause of the issue to aid your ability to rectify the problem effectively.
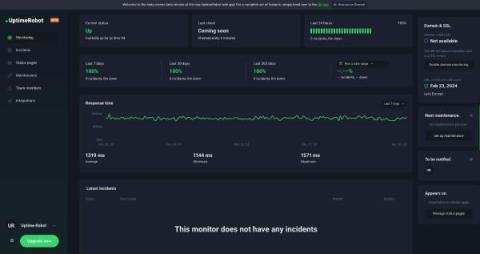
UptimeRobot Retrospective & Plans: Thank You for 2023 and Happy New Year!
Hi everyone. As we stand at the threshold of 2024, on behalf of our CEO, Michal Aftanas, and the entire UptimeRobot team, I’d like to thank you for your never-ending support. Thank you for being part of our journey over the last 12 months! It was an amazing ride full of great news (and more to come), so I’d like to take this opportunity to summarize our year together and give a peek at our plans for 2024.
December 2023: What's New at Kentik?
The year might be ending, but the Kentik news never stops. We’re back with our bite-sized roundup of everything you might have missed at Kentik in December 2023.
Monitoring Magento (now Abode Commerce): Simple Metrics for Effective Management
Magento is a popular open-source e-commerce platform that offers merchants a flexible and powerful solution for their online stores. It's known for its scalability, extensive features, and ability to customize, making it a choice for businesses of all sizes. Magento was launched in 2008 by a company called Varien. It quickly rose to prominence as one of the leading e-commerce solutions. It came in two primary editions previously.
Apache Cassandra monitoring: Challenges and solutions
Reflecting on my predictions for 2023 - Hits and Misses!
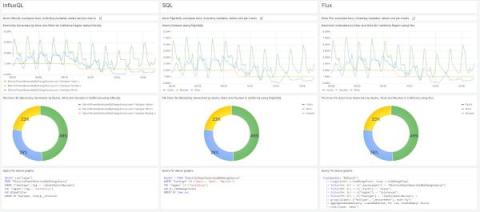
A comparison of InfluxQL, SQL, and Flux query languages for Grafana dashboards
Grant Pinkos manages two businesses near Detroit, Michigan. He enjoys Industrial IoT, Industry 4.0, guitar solos, and Pomeranians, and holds a BS in engineering and an MBA. Grant is a Grafana Champion and is very active in community discussions. He has also presented at GrafanaCON and authored a tutorial.
Installation and Upgrade Enhancements Delivered in DX Platform 23.3
On November 7, 2023, the AIOps and Observability team announced general availability of DX Operational Intelligence 23.3 and DX APM 23.3 for on-premises deployments. While the announcements and Release Notes cover all the important enhancements, several new capabilities deserve additional attention—especially those for installing and upgrading the DX Platform. These enhancements offer the following benefits: Below, you’ll see seven enhancement areas involving installation and upgrades.
Leverage Discovery Server for DX UIM to Optimize Infrastructure Observability
DX Unified Infrastructure Management (DX UIM) is a powerful solution that enables IT operations teams to monitor and manage the performance and availability of their IT infrastructure and applications. One of the key core components of DX UIM is the Discovery Server probe. This probe collects, processes, and stores information about devices and applications. In this blog, we will explore some of the benefits and use cases for Discovery Server.
7 Common SSL Certificate Errors and How to Fix Them
No matter what industry you work in, your customers need to trust you. And, with 70% of internet users now taking various steps to protect their digital footprint online, your website must be secure. As online shoppers become more security-savvy and demand more from online services, an SSL certificate error has the power to lose valuable website visitors and ultimately reduce sales. Adopting SSL certificates is fast becoming the best practice for websites worldwide. Here's why.
Time Series Differencing: A Complete Guide
Time difference analysis is a method of analyzing data points at regular time intervals over a set period. However, in time series analysis, we derive crucial information such as the variance of the variables among data points over a period of time. This gives additional information on how the data adapts over time. This can be used to analyze data during different trends at different time intervals.
Kubernetes Events Monitoring with OpenTelemetry | Complete Tutorial
An Ultimate guide on Azure FinOps to steer your cloud spending in the right direction
What's new in Avantra 24
I can't believe it's already been a year since the release of Avantra 23 in 2022. Over the past year, we've released three minor releases, 23.1, 23.2 & 23.3 that brought meaningful quality of life improvements across the entire product. We are bringing new checks, new performance optimizations, and highly requested features from our ideas portal (login needed). Additionally, there will be two new editions (Automation & Observability) so that customers can make better use of the features we have, and we have squashed 100s of bugs in different scenarios that our customers encounter in their day to day.
3 Reasons Why You Need an Embedded, Modern Database
Today's applications demand efficient data handling to provide users with seamless experiences. One solution that has gained prominence is the use of embedded databases, which are integrated within applications rather than relying on external servers. Different from a database for embedded systems, databases embedded within applications offer several advantages for storing data and analyzing it, especially in scenarios where performance, deployment simplicity, and data security are important. Embedded databases, or an embedded database management system (DBMS), can serve a variety of use cases, but are especially valuable for applications that need to provide analytics capabilities.
Top tips: 4 must-know IT budgeting tips revealed
Unveil how network traffic monitoring enhances network performance with NetFlow Analyzer
The concise guide to Loki: How to get the most out of your query performance
Thanks for joining me for Part 3 of “The concise guide to Grafana Loki,” a series of blog posts that takes a closer look at best practices for various aspects of using the log aggregation system. Today’s post is my holiday present for all the folks out there running Loki who would like to get the most query performance they can out of their cluster.
OpenTelemetry ECS Tutorial - Monitor AWS ECS metrics [Step-By-Step Guide]
Deep Dive into Time-Series Monitoring: Prometheus vs. Graphite
In the most distinct term, time-series monitoring is all about you analyzing a data or a process over a certain period of time. This period of time can vary according to our needs. We can set the monitoring to provide results every day, every week or even once in a month. Time-series monitoring works like logging, where all the activities your system goes through, are logged and stored in a file.
6 Ways to Benefit from the SUSE StackState Integration
With the recent integration between SUSE and StackState, SUSE customers will benefit from the enhanced observability StackState offers for their applications running on SUSE’s diverse Kubernetes distributions. As businesses increasingly rely on Kubernetes, ensuring the stability and performance of applications becomes of great importance.
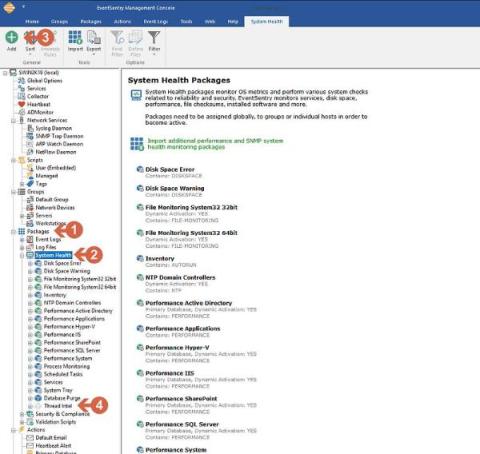
EventSentry Troubleshooting: Reducing the number of email notifications
2023 A year of achievements and transformations at Pandora FMS!
How to integrate Grafana Alerting and Telegram
Grafana Alerting helps you identify issues almost immediately after they occur — and you don’t have to constantly check your system to get the insights you need. Instead, Grafana Alerting sends alert notifications to reach you wherever you are, whether that’s in a Slack channel or in a messaging app like Telegram. Telegram is a viable option for receiving alerts, especially when you want personal or individual notifications rather than those sent to a team.
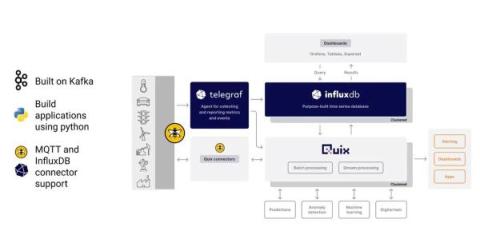
Webinar Recap: Saving the Holidays with Quix and InfluxDB: The Open Telemetry Anomaly Detection Story
Just in time for your holiday viewing! Learn how to solve real-time time series processing challenges with Quix—the stream processing framework using Kafka and Python—and purpose-built time series database InfluxDB.
What are the fundamentals of an IT service desk?
An IT service desk is the backbone of enterprises that rely highly on technology. It is responsible for providing technical support and assistance to employees and customers who experience issues with their technology. This signifies an IT service desk’s integral role in enhancing an enterprise’s internal/external service delivery and user experience. However, enterprises can only enhance their service delivery and IT operations when they maximize their service desk.
December Newsletter
Reflecting on a year of resilience and growth at Uptime.com, our CEO Jonathan Franconi has shared his gratitude for the team and our customers in the latest holiday blog post. Uptime.com is immensely proud to announce our contribution to UNICEF, supporting their mission to make a positive impact worldwide. Dive into the festive spirit with us!
Grafana dashboards in 2023: Memorable use cases of the year
As the number of Grafana users grows each year, so does the variety of reasons people are using Grafana dashboards. During 2023, members of the our community — both inside and outside of the company — shared some of their incredible professional and personal projects, including how Grafana has allowed them to successfully launch a rocket, cut back on carbon emissions, and even help balance a national power grid.
Understanding and resolving frequent website downtime issues
Website uptime is crucial for businesses to maintain a strong online presence and ensure a positive user experience. However, frequent website downtime can harm your brand reputation, customer loyalty, and your bottom line. This blog post will explore the common causes of website downtime and provide practical solutions to diagnose and resolve these issues effectively.
6 Azure FinOps Principles to ensure financial accountability
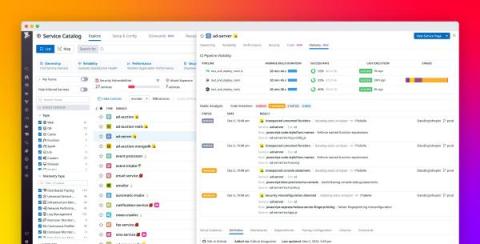
Improve your shift-left observability with the Datadog Service Catalog
Your applications are only as powerful as they are iterable. To keep up with their rapidly changing production environments, your teams need reliable CI/CD systems that implement best practices—including build and test automation, flaky test management, and deployment management. By optimizing their CI/CD pipelines, your teams can build their apps more efficiently, deploy them more safely, and catch bugs and security vulnerabilities before they make it to production.
The Ultimate Guide to Azure Synapse Cost Optimization: Save Big on Cloud Expenses
Grafana Cloud 2023: Year in review
Open source is the foundation of everything we do here at Grafana Labs, and that was on full display this year as we celebrated the 10th anniversary of Grafana and continued to improve and expand our lineup of OSS projects. But 2023 was also a banner year for Grafana Cloud, as more organizations than ever turned to the fully managed stack to carry out their observability strategies more easily and quickly.
Your Guide to Securing Project Funding and Yearly Budget Planning
As an engineer, you know your company’s problems, and you know what to do about them. However, being heard within your organization and funding a project can be challenging. Top executives might not understand your job’s ins and outs of the tools you need to do it well. Still, you need people holding the purse strings to understand why investing in your idea is brilliant.
Real User Monitoring Demystified: Elevating User Experiences and Web Performance
With constantly decreasing user attention spans, ensuring a seamless user experience has become a priority for all digital businesses. Users who encounter minimal application disruptions and responsive interactions will likely stay engaged and loyal to your product. And that’s exactly what RUM or Real User Monitoring tools such as Coralogix’s RUM solution offer.
Essential Help Desk Metrics & KPIs to Measure Performance
Does your business have a help desk in place? Are you tracking its performance? Knowing which metrics and KPIs to measure can differentiate success and failure. This article will explore the essential helpdesk metrics and KPIs and how they can help you optimize customer service. The help desk is responsible for providing support to employees and customers who need assistance with technical issues.
Prioritize network bandwidth performance with NetFlow Analyzer's QoS traffic shaping strategies
Apica 2024 and Beyond: Navigating the Future Amidst Global Challenges
As we step into 2024 and look toward the future, it’s evident that the world faces a multitude of challenges. From global risks to technological advancements, these changes will shape our lives in profound ways. This blog post delves into Apica‘s predictions for 2024 and beyond, exploring the impacts and adaptations required in various sectors.
What is Open Telemetry?
Obkio 2023 Year in Review
Why Glovo Chose Database Monitoring to Gain Context for Troubleshooting Issues
Complexity in the Clouds: A Comprehensive Checklist for Smooth Migration
“Hasn’t everyone already migrated to the cloud?” is a question you might be considering now. For many businesses – sure, they’ve migrated workloads and operations to the major cloud providers like Amazon Web Service, Google Cloud Platform, and Microsoft Azure. Still, many businesses have just now worked through their due diligence and scalability concerns. While many businesses are “fully cloud,” there are just as many yet to migrate.
Top 6 Azure FinOps Best Practices You Need to Know
How to Manage IoT Device Metrics Using Telegraf and MetricFire
Best Practices for Effective Log Management
Navigating network complexity with OpManager, the network diagram tool you need
Modern solutions for modern problems: Santa & Co. save the holiday season with the latest trends
Predict the Future! A universal approach to detecting malicious PowerShell activity
So, here’s the deal with AntiVirus software these days: It’s mostly playing catch-up with super-fast athletes — the malware guys. Traditional AV software is like old-school detectives who need a picture (or, in this case, a ‘signature’) of the bad guys to know who they’re chasing. The trouble is, these malware creators are quite sneaky — constantly changing their look and creating new disguises faster than AntiVirus can keep up with their photos.
2023 Recap: Advancements in SCOM-Centric Citrix Monitoring
Below are the most noteworthy updates from this year, highlighting our journey of continuous improvement and dedication.
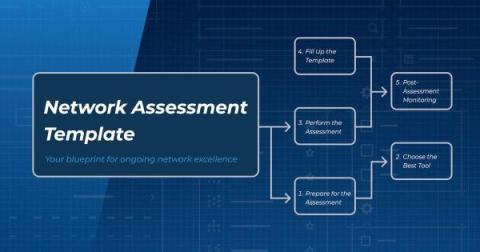
The Ultimate Network Assessment Template for Your Business
DevOps Insights with Dennis: GitOps - The way of the Kubernetes professional
How Toyota is using Datadog and AI/ML to invent new ways for humans to be more mobile #datadog
Open source at Grafana Labs in 2023: Year in review
At Grafana Labs, open source has always been part of our DNA. But in 2023 — a year in which we reflected on 10 years of Grafana, among other major OSS milestones — the power of our open source community felt especially palpable.
Reflecting on 2023: Uptime.com's Key Investments and Enhancements
As the year 2023 draws to a close, we at Uptime.com want to extend our heartfelt thanks to our valued customers for their unwavering support and continued dedication to our platform. Your engagement and feedback have been crucial in guiding our developments and enhancements. It’s been a journey of continuous innovation, fueled by our entire team’s commitment to enhancing customer experience and engagement.
Kubernetes and Beyond: A Year-End Reflection with Kelsey Hightower
With 2023 drawing to a close, the final OpenObservability Talks of the year focused on what happened this year in open source, DevOps, observability and more, with an eye towards the future. I was delighted to be joined by a special guest, Kelsey Hightower, a renowned figure in the tech community, especially known for his contributions to the Kubernetes ecosystem.
Cribl Stream: Understanding SplunkLB Intricacies
Understanding the expected behavior of the Splunk Load Balanced (Splunk LB) Destination when Splunk indexers are blocking involves complex logic. While existing documentation provides details into how the load-balancing algorithm works, this blog post dives into how a Splunk LB Destination sends events downstream and explains the intricacies of blocking vs. queuing when multiple targets (i.e., indexers) are involved.
Ship First, Model Later: A Short Recap of AI.Dev
In a keynote at AI.Dev, Robert Nishihara (CEO, Anyscale) described the shift: A year ago, the people working with ML models were ML experts. Now, they’re developers. A year ago, the process was to experiment with building a model, then put a product on top of it. Now, it’s ship a product, find the market fit, then create customized models. The general-purpose generative AI models available to all of us today (such as ChatGPT) change the way work is done.
Sailing into 2024 - Top Azure Trends and Predictions
2024 Unveiled: Catchpoint's Predictions for APM, ITOM, OTel & Beyond
As the holiday season rolls in, it’s not just about festive cheer and resolutions; it’s also time for industry leaders to cast their predictions for the new year. This year, Catchpoint’s thought leaders have stepped up with their hottest takes for 2024. Catchpoint experts are envisioning a transformative shift in the monitoring technologies, a heightened focus on performance as a key metric, and an integrated strategy for managing digital performance management.
Kubernetes Events- A Complete Guide!
Kubernetes stands out as a powerful orchestrator, managing the deployment, scaling, and operation of containerized workloads. A key component of Kubernetes observability and troubleshooting capabilities is the generation of events. These events serve as vital records, documenting incidents and changes within the cluster, offering real-time insights into the health and dynamics of the system.
AI Explainer: What's Our Vector, Victor?
Leveraging our new User Feedback widget to improve our Performance product
While Sentry can automatically detect unhandled exceptions, poor performance, and even signals of user frustration such as rage clicks, there are some problems that only a human can identify. This is where Sentry’s new User Feedback widget can help.
Introducing Netdata's Alerts Configuration Manager
Top 11 Kubernetes Monitoring Tools[Includes Free & Open-Source] in 2024
Logging and Debugging AWS Lamba
Progress Flowmon: How to Use the Benefits of Visibility in Higher Education
How To Optimize Telemetry Pipelines For Better Observability and Security
Monitor the Temperature of Your MacOS Hardware Using Telegraf
Monitoring your machine's internal temperatures is important for maintaining system health, optimizing performance, and ensuring the longevity of your computer hardware. It allows you to take proactive measures to prevent potential damage caused by overheating and helps in diagnosing and addressing cooling-related issues effectively. In this article we'll detail how to use the Telegraf agent to collect temperature readings from a Mac computer, that you can forward to a datasource.
The real costs of Datadog Synthetics monitoring
How much do Synthetics matter to your team? I think they matter a whole lot. Back when I was a freelance developer, I doubled my annual income with synthetics. Working mainly in database optimizations, I would finish out a contract and leave a synthetic monitor running at a very low frequency on their service. When I saw a pattern of slower performance, I knew it was time to hit the team lead-up to ask if I could help.
2023: The year of IT resilience!
As we close out another year, we want to take this moment to thank you, our customers, for your continued support. Whether you have been with us from the start or are just discovering our brand, we appreciate your business. This year's theme is IT resilience, which refers to the ability of an organization to withstand, adapt, and recover from disruptions or attacks with minimal or no impact.
RocksDB - Getting Started Guide
There are several reasons for creating a highly efficient and performant database in the current web era. RocksDB is an embedded key-value store designed for efficient data storage and retrieval. It is an open-source database engine developed by Facebook, which builds upon the strengths of LevelDB while incorporating several enhancements for durability, scalability, and performance.
News on the Alerts Domain and What's Cooking? | Netdata Office Hours #11
Key considerations when choosing the right application performance monitoring tool for your business
Microsoft SCOM Challenges and How to Overcome Them
As a Microsoft System Center Operations Manager (SCOM) administrator, several challenges might be encountered in managing and maintaining this complex monitoring and management tool. These challenges can vary depending on the organization's size, infrastructure, and specific requirements. Here are some of the common challenges faced by SCOM administrators.
Introduction: Sameer's SQUP learning path
Hello again, folks! It sure has been a while. For those of you who know me, you may remember I used to work at SquaredUp as a tech evangelist until a couple of years ago. Then some things happened, and I left in pursuit of something else. However, life has come full circle after about 2 years and boy am I glad to be back!
The concise guide to Grafana Loki: Everything you need to know about labels
Welcome to Part 2 of the “Concise guide to Loki,” a multi-part series where I cover some of the most important topics around our favorite logging database: Grafana Loki. As I reflect on the fifth anniversary of Loki, it felt like a good opportunity to summarize some of the important parts of how it works, how it’s built, how to run it, etc. And as the name of the series suggests, I’m doing it as concisely as I can.
A Year in Internet Analysis: 2023
In this post, Doug Madory reviews the highlights of his wide-ranging internet analysis from the past year, which included covering the state of BGP (both routing leaks and progress in RPKI), submarine cables (both cuts and another historic activation), major outages, and how geopolitics has shaped the internet in 2023.
Time Series Data and Real World AI: A Fireside Chat
Recently, InfluxData CEO Evan Kaplan sat down with Developer Advocate Jay Clifford to discuss the role of time series data and AI in industry, how it’s evolving, and specifically, the role of time series data in AI. They also discussed the future of InfluxDB in terms of real-time analytics and its role in the AI landscape.
Log Wrangling Make Your Logs Work For You
A Comprehensive guide to auto-shutdown idle Azure VMs to maximize cost savings
Unlock significant cost savings with Azure VM Reservations
Azure Cosmos DB Cost Optimization to avoid unforeseen expenses
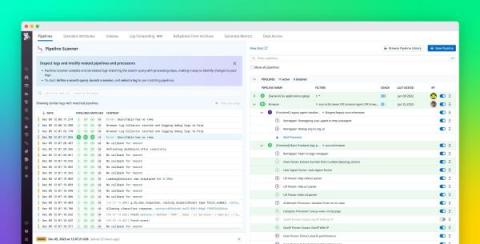
Investigate your log processing with the Datadog Log Pipeline Scanner
Large-scale organizations typically collect and manage millions of logs a day from various services. Within these orgs, many different teams may set up processing pipelines to modify and enrich logs for security monitoring, compliance audits, and DevOps. Datadog Log Pipeline let you ingest logs from your entire stack, parse and enrich them with contextual information, add tags for usage attribution, generate metrics, and quickly identify log anomalies.
The Power of Distributed Tracing in Shifting Observability Left
This is the second post in a 3-part series about shifting Observability left. If you have not had a chance to read the first, you can find it here. In today’s complex microservices deployments, gaining visibility into deployments is vital for optimal system performance and scalability. This has become even more important as the tech industry has moved toward microservice architecture reliance. Navigating through logs has become increasingly complex as requirements have grown.
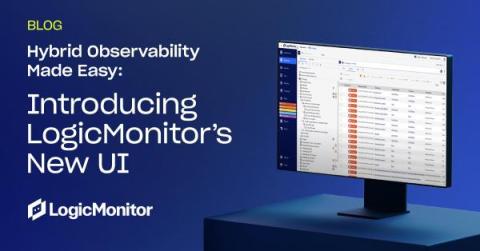
Hybrid observability made easy: introducing LogicMonitor's new UI
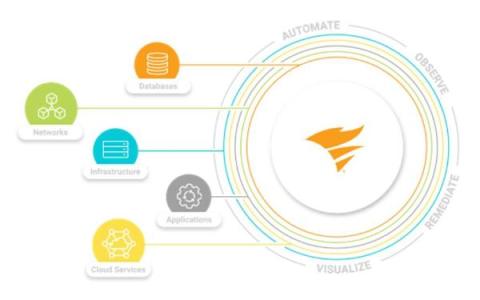
The SolarWinds Platform Explained
How to Identify DNS Issues: The IT Handbook
The Three FinOps Phases for MVP Success
Your FinOps foundations are down in your company’s cloud (woohoo!), but what comes next? How can you boost your MVP success in the cloud with your FinOps strategy? In this blog post, we’ll briefly dive into the three phases of your FinOps for top-notch implementation from beginning to end. Need a refresher on setting up an MVP FinOps framework for your cloud? In part 1 of our series, we’ll show you how it’s done!
Use Playwright codegen to create new Checkly browser checks in minutes
Scaling Up, One Network Bottleneck at a Time #shorts #datadog
Context isn't just for Christmas
Everyone has their own toys to play with this Christmas, but we all have more fun when we share. The same applies to the tools we use, the data we collect, and the insights we act on. In this video, I'll show you how one of our valued (and definitely real) customers “North Pole Industries” utilizes SquaredUp to share the magic of observability.
Uptime.com Achieves Strong Sales and Sustains Rapid Growth & Innovation in 2023
The service company continues to demonstrate market superiority in website and service monitoring, solidifying its status as the preferred provider for unified, dependable solutions for maintaining website availability. PALO ALTO, Calif., December 20, 2023 (Newswire.com) – Uptime.com, a global leader in website monitoring services, proudly announces tremendous sales results for the last two quarters of 2023, marking a new pinnacle in its growth trajectory.
Monitor Your NGINX Webserver with Telegraf
Monitoring your instance of NGINX gives you insight into your webserver's requests and connections. These insights can help in identifying performance bottlenecks, optimizing configurations, and ensuring efficient load handling. Monitoring all layers of your technology infrastructure allows for the early detection of potential problems such as server overload, disk space shortages, or network issues.
Three Pillars of Observability [And Beyond]
Five Tips for Monitoring Your Cloud Application
US federal agencies and AI: The race is on
Audit finds that there are 1,200+ government AI use cases in development and in use today.
How CloudSpend helps reduce the costs associated with your AWS Spot Instances
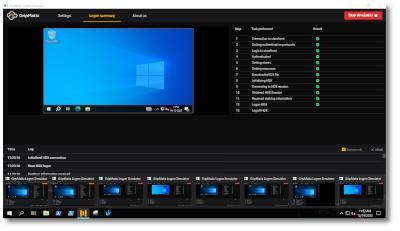
Unveiling GripMatix's Logon Simulator MP: A New Dimension in Citrix Monitoring with SCOM
MetrixInsight for Citrix Logon Simulator will be available to our valued MetrixInsight for Citrix VAD/DaaS customers, as part of our ongoing commitment to enhancing their Citrix monitoring experience. Stay tuned!
3 secure ways to handle user data in Raygun
Why Prometheus isn't enough to monitor complex environments
WhatsUp Gold 2023.1: Closing Gaps in Network Visibility
Networks are the lifeblood of organizations. They facilitate data flow, applications, and services while keeping operations running smoothly. However, there’s a critical challenge that often goes unnoticed – network visibility gaps. Progress WhatsUp Gold release 2023.1, available as of December 19, 2023, is set to change that. This release includes several exciting updates meant to close gaps in Network Visibility.
Navigating Observability Trends in 2024: Strategies for Success
For businesses reliant on customers’ positive digital experiences to achieve their goals, the seamless operation of cloud applications and infrastructure is paramount for financial success. Observability holds a pivotal role in modern enterprises, offering critical insights into your IT system’s health and performance. However, persistent issues of complexity and high costs have plagued the observability landscape.
Why do customers choose Elastic for logs?
Elastic is transforming the log experience to meet the needs of modern workflows In the absence of other observability signals, generally everything in your infrastructure (hardware, software, and services) emits log lines. Logs, however, are often structured at a developer’s whim and, first and foremost, serve the developer’s needs (e.g., debugging).
Shifting Observability Left - Empowering Developers
This is the first post in a 3-part series about shifting Observability left. When it comes to the reliability and performance of your applications, compromise is not an option in the world of software development. This is where observability can help developers achieve a more robust and scalable infrastructure.
Grafana Labs in 2023: Top 10 moments of the year
If you ask us to score 2023, we would give it a 10 out of 10. Not only because we released Grafana 10 and celebrated the 10-year anniversary of the Grafana project with the first-ever Golden Grot Awards and the launch of a four-part documentary series.
Why We Only Support JavaScript
TrackJS is the best frontend error monitoring tool. It’s all we do and we do it well. To keep it simple we have just two different JavaScript agents. One for the browser, and one for Node server environments. That’s it. No other languages or platforms are supported. Just JavaScript.
Detecting PowerShell Exploitation
In today’s digital landscape, cybersecurity is a top priority for organizations. Hackers are continuously finding new ways to exploit vulnerabilities and compromise systems. PowerShell, a powerful scripting language and automation framework developed by Microsoft, has unfortunately become a favored tool among attackers due to its capability to run.NET code and execute dynamic code downloaded from another system (or the internet) and execute it in memory without ever touching disk.
The Power of Paris Traceroute for Modern Load-Balanced Networks
Modern networking relies on the public internet, which heavily uses flow-based load balancing to optimize network traffic. However, the most common network tracing tool known to engineers, traceroute, can’t accurately map load-balanced topologies. Paris traceroute was developed to solve the problem of inferring a load-balanced topology, especially over the public internet, and help engineers troubleshoot network activity over complex networks we don’t own or manage.
On-prem application performance monitoring is still relevant, here's why
Learn how an on-prem application performance monitoring practice enables quick understanding of exactly how application health impacts transaction KPIs. Application users want seamless digital experiences — and they want them now. This common thread has organizations grappling with how to meet user expectations in increasingly complex application environments.
5 Strategies to Reduce Your AWS Lambda Expenses Efficiently
As a serverless computing service, AWS Lambda has revolutionized deployment with its pay-as-you-go model. Yet, users often grapple with unexpected costs. This guide underscores the criticality of cost optimization and prepares to unveil quintessential strategies to trim down your Lambda bills without compromising performance.
Validate NuGet packages before publishing from GitHub Actions
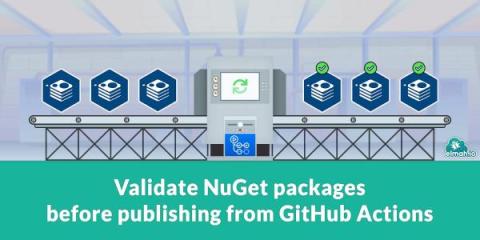
A big part of elmah.io is our clients for various web and logging frameworks. All of them are open-source, hosted on GitHub, and available as NuGet packages on nuget.org. I have blogged about building on GitHub Actions in the past. It struck me that I have never actually shared anything about the various steps we take for validating NuGet packages before pushing them. Let's fix that!
Our Lighthouse check has been upgraded to Lighthouse v11
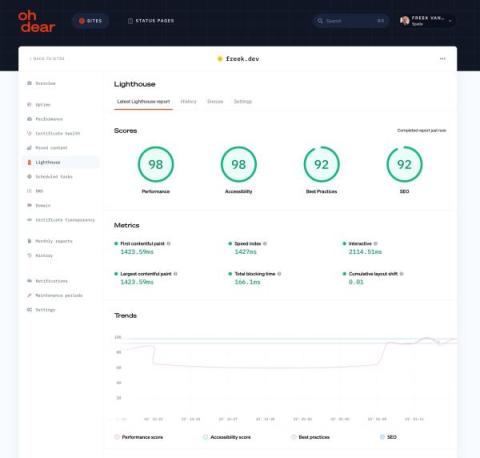
We are happy to announce that we have upgraded our Lighthouse check from v9 to the latest version, Lighthouse v11. Lighthouse is an open-source tool by Google that helps developers improve the quality of their web pages. Oh Dear can run this check frequently for your site, informing you when SEO-related problems arise. Our check may suggest optimizing images or minifying JavaScript to improve performance.
The Advent of Monitoring, Day 12: Behind the Scenes: How Checkly Is Using a Smoke Test Matrix to Tame Variant Complexity
This is the last part of our 12-day Advent of Monitoring series. In this series, Checkly's engineers will share practical monitoring tips from their own experience. At Checkly, the commitment to reliability is not just a tagline; it's embedded in our DNA. As software engineers, we understand the critical importance of dogfooding—using our own product to ensure its robustness and effectiveness. This approach holds immense value, especially since Checkly is designed for observability.
Azure Logic Apps costs optimization to maximize savings
What InfluxDB 3.0 Does That Other Databases Don't
Cool Retrace Feature - Email and share your Dashboards
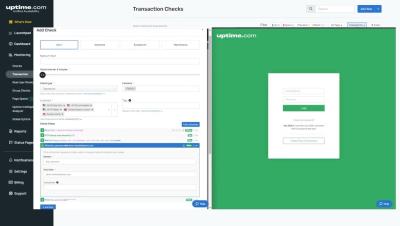
Uptime com Transaction Check Basics in less than 3 minutes
AI Governance in 2024: An Overview
Monitoring Pi-hole using Pi-hole Exporter and OpenTelemetry: A Comprehensive Guide
Grafana Loki query acceleration
The EU AI Act: What you need to know
The European Union’s new legislation is the first of its kind — and has global reach On December 8, 2023, the European Union made a significant step in digital governance by introducing the first set of comprehensive artificial intelligence (AI) regulations. This legislation, poised for a European Parliament vote by early 2024, is first out of the gate in regulating AI.
Get started with continuous profiling: Grafana Cloud Profiles
The Year in Internet Analysis: 2023
How to Install the Sentry JavaScript SDK in 60 Seconds
How to Install the Sentry Node SDK in 60 Seconds
15 Ways to Reduce IT Costs in 2024
Better Practices for Getting Data in from Splunk Universal Forwarders
While tuning isn’t strictly required, Cribl Support frequently encounters users who are having trouble getting data into Stream from Splunk forwarders. More often than not, this is a performance issue that results in the forwarders getting blocked by Stream. When they encounter this situation, customers often ask: How do I get data into Stream from my Splunk forwarders as efficiently as possible? The answer is proper tuning!
Monitor Any Running Process with the Telegraf Agent
Monitoring services and running processes on your server is crucial for maintaining system stability, optimizing performance, ensuring security, and making informed decisions regarding resource management and scaling strategies.
New Release: Apica Load Testing Tool ProxySniffer V5.1-C
Apica ProxySniffer V5.1-C is now ready with major updates and new features. The new version has support for multiple IP-addresses, housekeeping for Exec Agents and Job Controller and Automatic Detection of Insufficient Java Memory for Load Test Jobs added and more.
An introduction to Duet AI in Google Cloud
From complexity to cohesion: OpManager Plus brings IT teams together through observability
Reflecting on 2023 | A Year of IT Innovation and Transformation
As we draw the curtains on a transformative year in the realm of IT monitoring solutions, it’s a pleasure to reflect on the pivotal developments that have shaped the landscape of monitoring technologies in 2023. This year has seen remarkable strides in enhancing monitoring capabilities, and we’re thrilled to share these exciting advancements with you.
OpenTelemetry best practices: A user's guide to getting started with OpenTelemetry
If you’ve landed on this blog, you’re likely either considering starting your OpenTelemetry journey or you are well on your way. As OpenTelemetry adoption has grown, not only within the observability community but also internally at Grafana Labs and among our users, we frequently get requests around how to best implement an OpenTelemetry strategy.
The Advent of Monitoring, Day 11: Testing and Monitoring: Should You Separate or Unite Them?
The two key pillars of building reliable applications are: testing and monitoring. With testing, you can verify that each pull request works before it’s merged and deployed to production. Just testing isn’t enough, though. You also need to make sure that the application continues to work on production. Database rollovers, third-party outages, and unexpected spikes in traffic can all cause issues that need to be detected.
The World Needs Problem Solvers, Not Problem Identifiers
Why monitoring your application is important
Effective monitoring and observability tools are critical for modern enterprises. Daily operations, digital transformation, moving to a cloud-native architecture, and an ever-evolving tech stack all require ITOps, DevOps, and SRE teams to monitor increasingly complex systems. So what happens if your applications suddenly cease to function? Every moment of downtime translates to lost income, decreased customer satisfaction, and harm to your company’s reputation.
Subnetting - Ultimate Guide - Definition, How & Why?
Unlocking the Power of Real-Time Analytics with InfluxDB
How to get your first ten customers
Monitor Ray applications and clusters with Datadog
Ray is an open source compute framework that simplifies the scaling of AI and Python workloads for on-premise and cloud clusters. Ray integrates with popular libraries, data stores, and tools within the machine learning (ML) ecosystem, including Scikit-learn, PyTorch, and TensorFlow. This gives developers the flexibility to scale complex AI applications without making changes to their existing workflows or AI stack.
Webinar Recap: Building an AI Anomaly Detection Pipeline with InfluxDB
In this webinar hosted by InfluxDB and HiveMQ, we focus on how you can create value for your business using new tools in the AI and database ecosystem to quickly deploy AI models to perform tasks like anomaly detection. The webinar starts with a high-level overview of how MQTT and time series data can be valuable in an industrial IoT environment.
Azure Horizontal vs Vertical Scaling: Which is Right for You?
Retail Resilience: Lessons Learned from Cyber Week 2023
Black Friday and Cyber Monday this year marked a strong recovery for the retail and e-commerce sectors. Consumers were more eager to spend compared to 2022. Adobe Analytics highlights a significant jump in online sales, reaching $9.8 billion on Black Friday, up 7.5% from last year. Cyber Monday also saw an impressive rise, with sales hitting $12.4 billion, a 9.6% increase from 2022.
Roundtable Recap: From Cost Control to AI-driven FinOps
Did you miss our latest roundtable on AI-driven FinOps? Don’t worry, we got you! In this recap, we’ll review what our FinOps experts discussed and the key takeaways from the roundtable discussion. Not much of a reader? Watch it on demand!
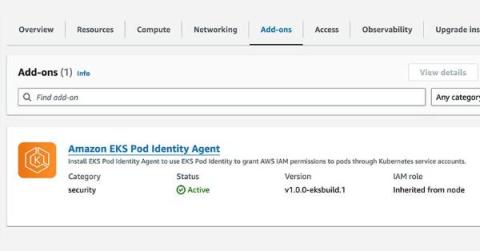
Exploring the new EKS Pod Identity Functionality
One announcement that caught my attention in the EKS space during this year’s AWS re:Invent conference was the addition of the Amazon EKS Pod Identities feature. This new addition helps simplify the complexities of AWS Identity and Access Management (IAM) within Elastic Kubernetes Service (EKS). EKS Pod Identities simplify IAM credential management in EKS clusters, addressing a problematic area over the past few years as Microservice adoption has risen across the industry.
Fleet & Discovery | Sematext
What metrics and logs don't show you (that traces do) #observability
Kubernetes Reliability Risks: How to monitor for critical issues at scale
Using VPC Flow Logs to Monitor AWS Virtual Public Cloud
How AI Can Catalyze Digital Resilience: An Introduction to Splunk's Philosophy
Monitor MongoDB With Telegraf
Monitoring your instance of MongoDB is important for maintaining optimal database performance, ensuring security, detecting and addressing issues promptly, and planning for future growth and scalability. Database and infrastructure monitoring allows for the early detection of potential problems such as server overload, disk space shortages, or network issues.
Monitor GitHub Using Telegraf and MetricFire
Monitoring your GitHub account is important for maintaining code quality, facilitating collaboration, ensuring security, enabling smooth development workflows, and improving overall project management and efficiency. This will allow you to stay updated on code changes, pull requests, issues, and comments and facilitates collaboration among team members, ensuring everyone is informed about the progress and status of your projects.
Website Monitoring Trends in 2024
Welcome to 2024, a year where the digital landscape is not just evolving—it’s revolutionizing. In this dynamic world, particularly in the realms of tech, finance, business, and real estate, staying abreast of the latest website monitoring services trends is more than a necessity—it’s your superpower. Those beginning their journey in Site Reliability Engineering (SRE) and DevOps must understand these trends are the key to unlocking a world of possibilities.
API Scraping Using Cribl And Setting Up a Notification Assistant
Cribl Stream is awesome at routing your server logs and making your job easier, but could it help you outside of work and potentially make your personal life easier? The short answer is: Yes. I’ve personally used Stream to build a notification system to inform me when certain products go on sale or when fully booked appointments become available. In this blog, I’m going to take this a step further and show you how to.
The Advent of Monitoring, Day 10: Better Observability Into Your Local Clickhouse Instance With Grafana and Prometheus
Cloud-based database providers often provide great observability out of the box. But, what if you’re developing a tricky feature locally and need more details about what your local Clickhouse is doing? There are many options, but if you’re a numbers and graphs person like me, you’ll want to be able to view the inner workings of Clickhouse in something like Grafana.
Rollbar Alternatives: Compare Before You Commit
Rollbar is acclaimed as the top error monitoring tool - with 4.5 out of 5 stars on both Capterra and G2 - amongst a competitive field. That said, we recognize there are alternatives some people consider when also looking at us. Here is our perspective on what these other tools are for, and when to choose Rollbar instead.
The Advent of Monitoring, Day 9: Advantages of Multi-Step API Checks vs Original API Checks
This is the ninth part of our 12-day Advent of Monitoring series. In this series, Checkly's engineers will share practical monitoring tips from their own experience. As a Checkly user, you’ve always had access to our two core check types: API and browser checks. API Checks are much cheaper, and therefore only run a curl-like request against the endpoint of your choice.
AI microscopy with Grafana, Theia Scientific, and Volkov Labs (Grafana Office Hours #24)
AWS re:Invent Recap!
The ITOM'ologist's Corner: OpsRamp to ServiceNow CMDB Integration
This recurring blog will look at specific ITOM technologies within the OpsRamp solution and general ITOM challenges. Got an idea for this blog or want to learn more about ITOM at OpsRamp?
Azure VM Rightsizing for Performance Excellence and Cost Control
A Head Nerds Guide to Building Custom Monitoring
I have spoken with many prospects and partners over the years and one of the more frequent questions I am asked is: “How do you build Custom Monitoring”. This is not an easy question to answer as there are so many variables at play, including: what type of device are you trying to monitor, what metrics are you looking for, what thresholds should trigger a warning or failure, etc.
When HTTP 200 is not "OK" | Snack of the Week
The Advent of Monitoring, Day 8: How to Monitor All the Nines of Your Service-Level Agreements
If you have large(r) customers, there is a point where they ask you for service-level agreements, or short SLAs. These are customer contracts defining different aspects of your service and what you guarantee for them. One common agreement is around availability, or, colloquially speaking, uptime. Your contract might state, and I am not a lawyer, that you guarantee that your service (or core parts of it) is available 99.99% of the time of a given period, mostly per month, quarter, or year.
Track service provider outages with IsDown and Datadog
When your apps and infrastructure rely on dozens of third-party providers for key functionality, it’s important to closely track their outages. If a service you rely on goes down, you need to move quickly to limit the outage’s impact on your users. IsDown provides a detailed status page aggregator and uptime monitoring for all your third-party dependencies.
Introducing Honeycomb's Microsoft Teams Integration for Enhanced Alert Management
Today marks an exciting milestone at Honeycomb, and we're thrilled to share it with you. We officially launched our integration with Microsoft Teams, a step forward in our continuous effort to streamline and enhance your observability experience. Teams now joins our growing list of over 100 Honeycomb integrations.
The unresolved cost of High Cardinality
Sentry Bundle Size: How We Reduced Replay SDK by 35%
Bundle Size matters - this is something we SDK engineers at Sentry are acutely aware of. In an ideal world, you’d get all the functionality you want with no additional bundle size - oh, wouldn’t that be nice? Sadly, in reality any feature we add to the JavaScript SDK results in additional bundle size for the SDK - there is always a trade off to be made. With Session Replay, this is especially challenging.
Optimizing the Modern Workplace: Martello's Top 5 in 2023
As we look back on 2023, Martello’s focus was squarely on the success of our customers and shared achievements with our partners. Our journey is deeply rooted in a commitment to our customers and the meaningful partnerships that propel our innovations forward. Here’s a closer look at what has defined Martello’s 2023 and the spirit of collaboration with our customers and partners that continues to shape our path.
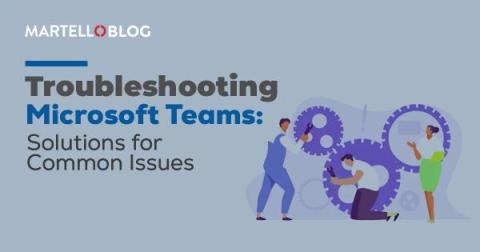
Troubleshooting Microsoft Teams: Solutions for Common Issues
Encountering problems with Microsoft Teams can disrupt your workflow, but don’t worry! This comprehensive guide for troubleshooting Microsoft Teams covers various common issues you might encounter while using Microsoft Teams. From connection hiccups to audio and video glitches, login errors, and notification mishaps, we’ve got you covered. in our e-book titled “Troubleshooting Microsoft Teams”: What Native Tools Can (and Can’t) Do.
Coralogix vs Observe: Support, Pricing, Features & More
Observe is a SaaS based observability tool built on Snowflake. It offers a graph-style approach to observability data, claiming that this makes it easier to correlate data in a seamless fashion. Let’s see how Observe compares to Coralogix.
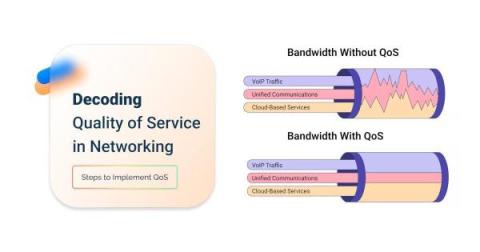
What is QoS in Networking: Decoding Quality of Service
Fetch Waterfall in React
Have you seen this problem? Or maybe this one? You’ve most likely seen this: Hint: they’re all the same. The first image is Sentry’s Event Details page, the second is Chrome’s Network tab, and the code snippet is what causes it. If you can answer yes to any of these, then you need to keep reading. If not, you still need to keep reading, so your future self can thank you. This is called “fetch waterfall” and it’s a common data fetching issue in React.
Monitor Docker With Telegraf and MetricFire
Monitoring your Docker environment is critical for ensuring optimal performance, security, and reliability of your containerized applications and infrastructure. It helps in maintaining a healthy and efficient environment while allowing for timely interventions and improvements. In general, monitoring any internal services or running process helps you track resource usage (CPU, memory, disk space), allowing for efficient allocation and optimization.
What is the principle of least privilege (PoLP)?
What is SSH?
[Webinar] Mastering log monitoring: Strategies for enhanced application failure troubleshooting
What's your favorite piece of the Source Code?
APM Security View #datadog #shorts
#ownership #reliability #performance #apm #devops #devsecops #applicationsecurity #microservicesarchitecture #vulnerability #observability #cloudcomputing
A Bright New Era in Developer Troubleshooting with Lumigo and OpenTelemetry
At Lumigo, building developer-first tools has always been at the forefront of our approach to troubleshooting and debugging. As developers ourselves, we have experienced firsthand the frustration and intricacies of sifting through logs looking for answers. We’ve also felt the pressure of the clock ticking, with production issues waiting to be resolved and the need for timely answers to surfaced application issues.
The gift of visibility: Mobile Real User Monitoring and Cisco ThousandEyes integration
How AppDynamics Mobile Real User Monitoring (MRUM) delivers true end-to-end visibility of your network and application data — wherever your customers are. As we gear up for the holiday season, we’re excited to unwrap a special gift for our customers — the gift of end-to-end visibility. Last summer, we announced the integration between Cisco AppDynamics and Cisco ThousandEyes to enhance Browser Real User Monitoring (BRUM) with network intelligence data.
AWS re:Invent re:Cap
Despite the siren song of AI in the keynotes, visitors were far more focused on solving real-world problems. These are the issues that have plagued IT practitioners for years, if not decades: troubleshooting and validating performance and availability of their applications, services, and infrastructure.
The Advent of Monitoring, Day 7: A Peek Into Our Job Monitoring Strategy With Heartbeat Checks
Table of contents This is the seventh part of our 12-day Advent of Monitoring series. In this series, Checkly's engineers will share practical monitoring tips from their own experience. At Checkly, we manage various scheduled jobs, some of which play a crucial role in our application's functionality, and others exist to support different teams within Checkly.
20 Best Cloud Monitoring Tools
When it comes to the best cloud monitoring tools, there are various services you can rely on or choose to support your IT infrastructure. After all, cloud monitoring is critical to ensure the performance, uptime, and overall health of cloud services. Numerous teams in modern IT, SaaS, and app development companies, including DevOps, SREs, and security analysts depend on cloud monitoring solutions.
Fallbacks for HTTP 404 images in HTML and JavaScript
Your images are 404ing all over the place. You’ve got an angry email from a client. Their site is “broken”, images aren’t loading, cumulative layout shift is running riot, and everything is messed up. The crowds are mocking your broken code on Twitter. A fun GIF loaded via a Giphy URL no longer exists. And someone has accidentally deleted an image from the CMS.
NiCE VMware MP 5 7 Release Recording 2023Q4
My Recap on the Gartner IT Infrastructure, Operations & Cloud Strategies Conference
Last week, I attended the Gartner IT Infrastructure, Operations & Cloud Strategies Conference (IOCS). Gartner IOCS is my favorite conference every year because of the quality and level of the presentations. Gartner analysts deliver most sessions and put a lot of effort into the presentations and supporting research. I’d like to highlight two sessions that I found to be very informative.
Monitor MySQL Performance Using Telegraf
Monitoring the performance of your MySQL database will help identify performance bottlenecks, inefficient queries, and resource-intensive processes. By tracking metrics like query execution times, server load, and resource usage, administrators can optimize configurations and fine-tune the database for better efficiency and speed. Additionally, monitoring any running process allows for the early detection of potential problems such as server overload, disk space shortages, or network issues.
Data Profiling The Secret Map of Your Telemetry Data Landscape
Web Unleashed 2023: Maximize App Performance By Optimizing Web Fonts - Lazar Nikolov
Optimize Azure App Service costs professionally for peak savings
LLM Monitoring and Observability
Large Language Models (LLMs) are advanced artificial intelligence models designed to comprehend and generate human-like language. With millions or even billions of [parameters, these models, like GPT-3, excel in natural language processing, understanding context, and generating coherent and contextually relevant text across various applications.
Understanding the difference between OpenSearch and Elasticsearch
OpenTelemetry Overview
Monitoring distributed systems means collecting data from various sources, including servers, containers, and applications. In large organizations, this data distribution makes it harder to get a single view of the performance of their entire system. OpenTelemetry helps you streamline your full-stack observability efforts by giving you a single, universal format for collecting and sending telemetry data. Thus, OpenTelemetry makes improving performance and troubleshooting issues easier for teams.
Enrichment: Better Data in for Better Response Times Out
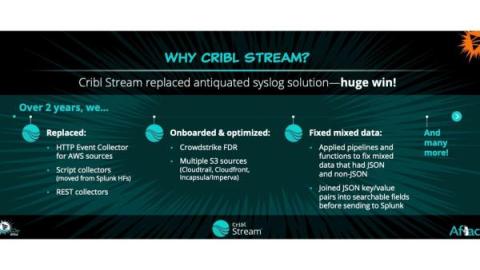
In this conversation, Cribl’s Carley Rosato talks to Aflac’s Shawn Cannon about his role as a Threat Management Consultant, and how he manages their SIEM environment, brings in new data as needed, and works to improve the ingestion process. Our customers are always coming up with new and exciting ways to implement Cribl tools — importing a 34 million-row CSV file into Redis and enriching events in Splunk might be one of the most impressive we’ve seen so far.
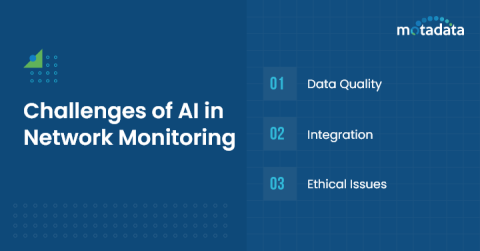
The Power of AI in Network Monitoring
As per a survey by Comcast Business, around 85% of IT leaders trust AI networking tools for meeting their organization’s goals. This stat alone is enough to show how big of a role AI is playing in network monitoring. And it’s just the beginning, with rapid development in Artificial Intelligence, we might see a lot more sophisticated AI use cases for network monitoring. But how exactly does AI help in network monitoring? What its roles, benefits, challenges, and how to implement it?
VictoriaMetrics Meetup December 2023
Unlocking Efficiency through Unified Monitoring - Maximizing Status Page Aggregation
Gone are the days of juggling multiple monitoring tools and piecing together fragmented data. The modern IT landscape demands a holistic approach known as unified monitoring when it comes to streamlining all your mission-critical services and vendors. Partner your business infrastructure with a status page aggregator and establish a health dashboard with all your dependencies.
ScienceLogic Announces "Hollywood" Release of SL1 Platform, Introducing Advanced AI/ML & Automation Capabilities for AIOps
Digital Workplace Insight 2023 - Part 2
In the previous installment of our series, we explored the initial findings of our comprehensive survey. Today, we continue our journey, focusing on the readiness of IT teams for remote work challenges and beyond.
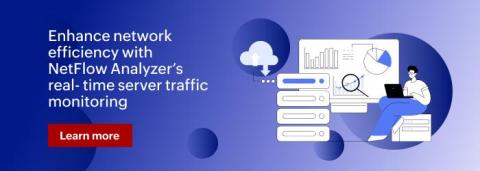
Real-time server traffic monitoring: Benefits, best practices, and NetFlow Analyzer
Analyze Transaction Scores to understand the impact of increased user activity
AppSignal Expands Monitoring Capabilities with Vector
We're excited to announce AppSignal support for Vector logs and metrics! AppSignal's Vector support allows you to expand your monitoring horizons beyond our standard language integrations, making it possible to leverage AppSignal to both monitor the performance and manage the logs of components of your stack that fall outside a standard application. With Vector, you can use AppSignal to monitor how your databases and Kubernetes clusters perform and metrics from many other sources.
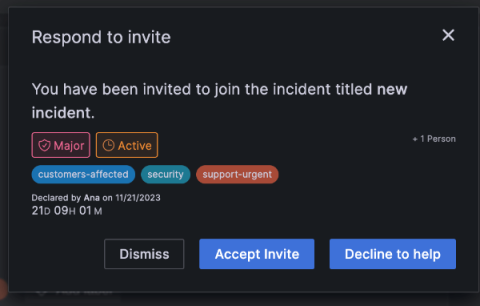
Easily page participants to accelerate incident response in Grafana IRM
Incidents almost never happen in a vacuum. When you receive an alert about a potential issue, odds are pretty good that you’ll need to navigate between different tools and teams to get things resolved. Of course, timing is critical in these situations, so the easier it is to communicate — between both tools and teams — the better off you’ll be.
Lessons Learned from Managing Kafka Costs
You probably have seen ads where someone claims that their app can save you money by finding subscriptions you forgot about. I have a hard time imaging someone with $100s of dollars of expenses they forgot about, but I have had the occasional one that was missed. The problem is that people are inefficient when it comes to managing “stuff”. That is why there are so many places to store “stuff”.
Using NetFlow to Monitor Network Traffic
In the intricate landscape of contemporary network management, comprehensive and insightful tools have never been more critical. One tool that stalwartly deciphers the complexities of network traffic is NetFlow. Developed by Cisco Systems, NetFlow is a robust protocol that serves as a cornerstone for understanding, monitoring, and optimizing the flow of data within a network.
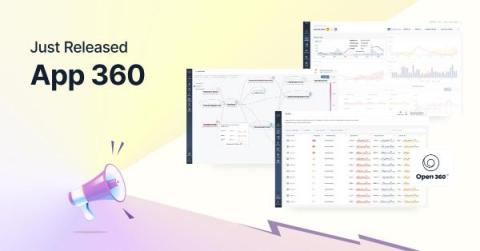
Rethinking APM with Logz.io App 360
As we continue to navigate the ongoing evolution of the observability landscape, Logz.io is constantly striving to provide our customers with the advanced platform capabilities needed to make sense of their increasingly complex environments. Sometimes that means taking a new approach to long-standing practices.
Lumigo Releases 1-Click OpenTelemetry for Microservices Troubleshooting
Lumigo is excited to announce its microservice troubleshooting platform now provides developers and DevOps with the power of OpenTelemetry (OTel) with a single click. Lumigo has long been the leading troubleshooting platform for serverless, but now, users can harness its best-in-class debugging and observability platform for all microservices-based environments.
DevOps Insights with Dennis: Kubernetes cluster orchestration with Ansible and Terraform
Database Observability Provides the Features Customers Need for Effective Monitoring
Network Latency & How To Improve Latency
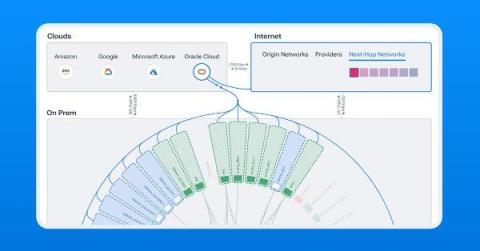
Kentik Expands Hybrid Cloud Observability with OCI Support
Kentik now provides network insight into Oracle Cloud Infrastructure (OCI) workloads, allowing customers to map, query, and visualize OCI, hybrid, and multi-cloud traffic and performance.
Prometheus Metrics Types - A Deep Dive
Building an Internal Development Platform (IDP): A Journey of Innovation and Growth #shorts
Broadcom's ValueOps and AppNeta Solutions Are Now Available on Google Cloud Marketplace
We are pleased to announce that several Broadcom software products are now available on the Google Cloud Marketplace, providing Google Cloud customers with market leading value stream management and network performance monitoring capabilities via a simplified procurement process and consolidated billing with their Google Cloud account.
Azure App Service rightsizing to maximize cost efficiency
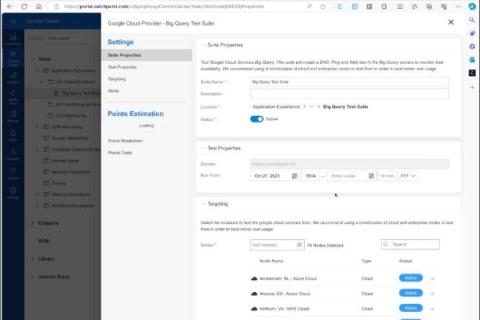
Google Test Suite: Monitoring Google Cloud Services Just Got Easier
In today's dynamic cloud computing environment, effective monitoring of cloud services is essential. Developed in partnership with Google Cloud, Google Test Suite offers easy-to-deploy test templates to monitor your Google Cloud Platform (GCP) services.
Add participants to an incident in Grafana Cloud IRM
How to download and run Grafana on your MacOS - Grafana for Beginners Ep.4
How to test non-deterministic user flows with Playwright
Monitor Network Performance Using Telegraf
Monitoring your network performance is important for many reasons and can help in detecting network issues such as bandwidth congestion, latency, packet loss, or hardware failures. By continuously monitoring your network, you can identify areas where improvements can be made, allowing for optimization of resources, better allocation of bandwidth, and overall enhancement of network efficiency.
Coffee Talk with SURGe: 12-DEC-2023 Kyivstar Cyberattack, Water Utilities Hacked, Log4j Exploited
Just a fifth of IT professionals say they fully understand how AI tools work
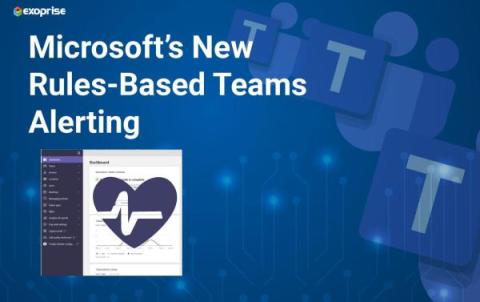
Microsoft's New Teams Rules-Based QoS Alerts
Microsoft introduced new Quality of Service (QoS) monitoring rules for Microsoft Teams and their administrators. These rules empower organizations to be notified of Teams call quality issues when users are experiencing problems during audio, video, or screen sharing. This article discusses the new monitoring rules, how Exoprise can enhance the rules, and how to monitor Microsoft Teams effectively.
Achieve proactive VM performance management with OpManager
Virtualization and the creation of many virtual machines (VMs) within the same infrastructure was the solution organizations came up with when faced with expansive, expensive networks that needed more hardware and thus more capital expenditure to host applications. While they resolved the bigger pain points, VMs still have to be monitored as they are heavy on resource usage.
Cyber-Physical Systems (CPS) Explained
Stop paying for unused resources with Azure Reservations utilization monitoring
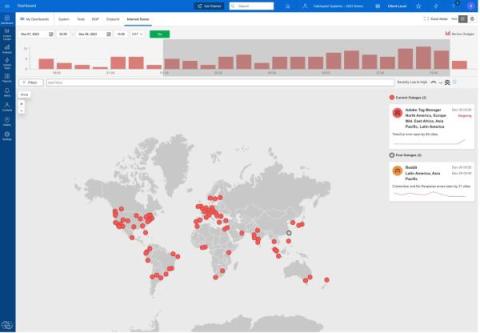
Adobe Experience Cloud Outage: The Impact of Relying on Third-party Services
On December 8, 2023, Adobe's extensive customer base was impacted by a series of outages in the Adobe Experience Cloud, starting from 8:00 AM EST and continuing until 1:45 AM EST on December 9. We haven't seen a third-party outage of this magnitude since the DoubleClick outage of 2018.
Combine Business iQ with business risk observability to build a seamless digital experience
Why shared intelligence across business, security and application performance is a pivotal growth driver — and how to achieve it. In a global application survey, 62% of consumers agreed that mobile app security protection and features are equally important. Additional research suggests brands have one shot to get it right — or risk losing 32% of their users after just one poor experience.
Behind the Scenes: Rocket Lawyer's Secret Sauce for Uninterrupted Digital Legal Services
'The Story of Grafana' documentary: The community behind the code
How do you know that your open source project has been enthusiastically adopted by the community? A) Engineers give you a raucous standing ovation when a feature is revealed. B) People form a long line to meet you at an industry event. C) Every time there is a release, social media notifications blow up your phone. If you’re Grafana founder Torkel Ödegaard, the answer is D) all of the above.
How to Analyze Subscriber Behavior with Kentik
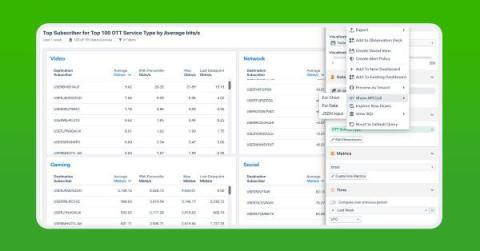
Learn how to analyze subscriber behavior using Kentik. In this post, we focus on the challenges and solutions of identifying and tracking the customers in an IP network while complying with regulations such as GDPR, show how Kentik Custom Dimensions and Data Explorer provide the analysis, and finally touch on how the associated APIs help automate and ease the entire process.
The Advent of Monitoring, Day 5: Dealing With Third-Party Dependencies Causing False Positives for Synthetics
When we’re testing our apps, it's a big headache to simulate what the user goes through while steering clear of the more problematic parts of those processes. These parts, often external and beyond our control and responsibility, are usually not the focus of our testing. Think external services, third-party modules, or APIs. Relying on these unpredictable elements for our tests is a no-go. Nor do we want to rework our tests to check internal implementations just to dodge these issues.
How to Monitor ISP Networks Like a Pro
Searching the Google Workspace API using Cribl Search
Google Workspace is a robust set of productivity applications with billions of users and millions of paying organizations. These include small mom-and-pop shops and the largest enterprises. Google provides the Google Reports API, “a RESTful API you can use to access information about the Google Workspace activities of your users.” This data is critical for establishing a solid security posture.
Security and the API Economy A Panel Discussion with IDC and Broadcom
AWS Observability 2.7.0 - Sumo Logic Customer Brown Bags - Observability - December 12th, 2023
Yaman Hakmi & Sherif Adel Medhat about Business Transactions & Business iQ
Yaman Hakmi & Vivek Inbakumar talking about Cisco Observability
How to Customise Monitors in StackState for Enhanced Observability | StackState Tuning Tutorial
Datadog On Maintaining eBPF at Scale #datadog #shorts
The Advent of Monitoring, Day 6: How We Use Checkly to Monitor Checkly: A Backender's Perspective
Table of contents As a golden rule of building a developer tool, you should always dog-food your own product. But, how does this work with a monitoring solution 🤔? Doesn’t it create a chicken and egg problem? Checkly uses multiple tools to monitor the platform, and tools from our competitors as well. However, we still dogfood our platform heavily. I believe this is mainly due to our engineers also liking the product and finding it quite easy to monitor their features.
Network Observability 101: A Primer
In today's digital-first landscape, maintaining the health and performance of your network is critical for the seamless operation of your business and its services. To that end, network observability has emerged as a key concept and discipline in ensuring the robustness and performance of networks. But what is network observability?
5 Ways AIOps Monitoring Benefits EUC Environments
The adoption of AIOps monitoring technologies has been somewhat slower in EUC than many other areas of IT. The legacy VDI and DaaS vendor tools set expectations low for many. It is still relatively common for us to come across potential customers who are using legacy tools and manually exporting 6 months of data into an excel spreadsheet to try and work out average and peak usage of resources such as CPU to then manually calculate alert thresholds.
Top 9 Benefits of Remote Network Monitoring
Are you relying on outdated manual methods to monitor your network? Struggling to keep up with the increasing complexity of your IT infrastructure? Being constantly reactive to network problems instead of proactive in preventing them? If you answered yes to any of these questions, then you’re putting your business at risk. But don’t worry, there’s a way out — Remote Network Monitoring.
Release 1.44.0 - Netdata vs Prometheus, Netdata Journal Logs, Netdata's log2journal (Beta) and more!
The Advent of Monitoring, Day 4: Solving E2E Testing Challenges With Checkly's PWT Garbage Collector
This is the fourth part of our 12-day Advent of Monitoring series. In this series, Checkly's engineers will share practical monitoring tips from their own experience. One challenge in conducting end-to-end (E2E) testing is managing the artifacts created during the process. These artifacts are necessary for asserting specific functionalities.
What is Grafana Loki? #observability
The Story of Grafana | Episode 2: Community | Grafana Documentary
Open source log monitoring: The concise guide to Grafana Loki
Five years ago today, Grafana Loki was introduced to the world on the KubeconNA 2018 stage when David Kaltschmidt, now a Senior Director of Engineering at Grafana Labs, clicked the button to make the Loki repo public live in front of the sold-out crowd. At the time, Loki was a prototype: We bolted together Grafana as a UI, Cortex internals, and Prometheus labels to find out if there was a need for a new open source tool to manage logs.
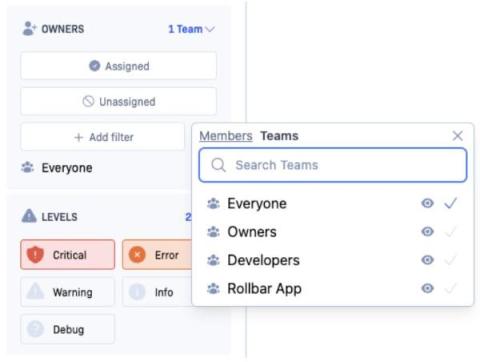
Team Assignment
Assign items to teams as well as individual owners! We’re excited to announce a new feature for Advanced and Enterprise customers - the ability to set a team as the owner of an item. Previously, Rollbar has only allowed users to assign a specific team member as the owner of an item. However, recognizing the need for flexibility in ownership, especially in collaborative environments, we now allow a team to be set as the owner of an item.
Galileo Client Testimonial - Carhartt
Data Overload: Why Companies Collect Too Much Data and Pay the Price
In the US, a recurring news topic is the state of the federal budget – and if we’ll get one signed. Government budgets have hundreds of thousands of line items; each bickered over to gain or lose political capital with one group or another. However, most government budgets aren’t up for debate. Only about 30% of the US federal budget is discretionary or flexible. Nearly two-thirds, or 63%, is mandatory spending required due to prior commitments.
Cribl Search & Parquet Pushdowns - Smooth Like Butter!
Data is growing, and we are being asked to search larger and larger amounts of data. This puts larger and larger demands on Search resources. Reading all the data to find matching events is muscling through the data. Wouldn’t it be more efficient to be able to do filtering before reading the data? Cribl Search does precisely that by leveraging Parquet Pushdowns.
Top 6 IPAM Software & IP Address Management Tools in 2023
November Product Updates for Sentry
Grab your favorite mug, fill it with some warm chocolatey goodness – it is hot cocoa season after all –, and check out our most recent product updates to Sentry.
How to Set Up Effective Network Monitoring Alerts
Yaman`s Key Findings from Customer Conversations
5 Signs Your Website Needs Monitoring ASAP
Your website is more than just a digital storefront—it’s a vital part of your business’s infrastructure. But how do you know when it’s time to implement serious website monitoring? Here are five telltale signs that your site needs immediate attention, and why Uptime.com is your go-to solution.
The Advent of Monitoring, Day 3: Easy Monitoring for Self-Hosted Projects with Checkly
This is the third part of our 12-day Advent of Monitoring series. In this series, Checkly's engineers will share practical monitoring tips from their own experience. When it comes to running self-hosted services or side projects, monitoring is key. But, who has the time to set up a complex monitoring system? We want to deliver cool software and not be busy with configuring Prometheus servers or Grafana Dashboards.
The Advent of Monitoring, Day 2: Debugging Dashboard Outages with Checkly's API Checks
Table of contents This is the second part of our 12-day Advent of Monitoring series. In this series, Checkly's engineers will share practical monitoring tips from their own experience. We encountered a tricky issue with our public dashboards: they were experiencing sporadic outages, happening about once every two days. The infrequency and unpredictability of these outages made them particularly challenging to diagnose.
Using OpenTelemetry Collector Loki Receiver to Send Logs to SigNoz [Code Tutorial]
Comparing Uptime Monitoring, Heartbeat Monitoring, and Synthetic Monitoring
Applications Manager extends support for new Azure services!
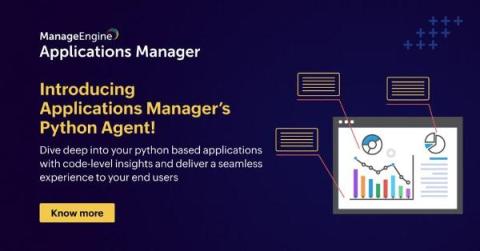
Applications Manager now supports Python applications!
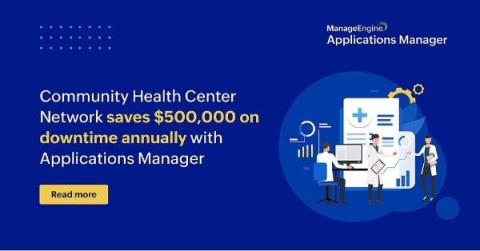
Applications Manager helps Community Health Center Network provide excellent, affordable care underserved communities
Manage IPs and switch ports with OpManager MSP's new IPAM and SPM add-on
Observability Engineering: A Beginner's Guide
Fault Tolerance: What It Is & How To Build It
4 Strategies to Reduce Observability Costs - Without Sacrificing Visibility
Today’s end users have little to no patience for performance issues. Jitters, slow load times, and full-blown outages can quickly lead to brand damage, lost customers, and diminished revenue. That’s why it’s essential for DevOps and engineers to be able to quickly identify and resolve issues before users ever notice them. Doing this requires collecting and analyzing massive amounts of telemetry data – metrics, traces, and logs.
How-to surface your multi-cloud costs with SquaredUp
Working in the cloud is certainly convenient, but the convenience comes at a price. With more and more organizations transitioning to the cloud, and a rise in preference towards cloud-native applications, hosting most, if not all the components of your business in the cloud is becoming increasingly common.
Correlate AWS and Prometheus with SquaredUp's data mesh
I recently delved into the idea of using labels within Prometheus to craft objects and hierarchies where none initially existed. Check out that piece here. The essence was harnessing the prowess of OTEL to achieve more, faster. The ambition? Transform these abstract virtual objects and integrate them into SquaredUp's knowledge graph, thereby unlocking the potential of data mesh and correlation.
Monitor Cloudflare Workers using Prometheus Exporter
Monitor your chaos engineering experiments with Steadybit's offering in the Datadog Marketplace
Steadybit is a software reliability platform that uses chaos engineering and fault injection to help organizations improve the stability and performance of their applications. By allowing customers to simulate turbulent scenarios in a controlled environment, Steadybit enables you to identify and mitigate potential system issues to reduce downtime and improve resilience.
Performance optimization techniques in time series databases: sync.Pool for CPU-bound operations
Internally, VictoriaMetrics makes heavy use of sync.Pool, a data structure built into Go’s standard library. sync.Pool is intended to store temporary, fungible objects for reuse to relieve pressure on the garbage collector. If you are familiar with free lists, you can think of sync.Pool as a data structure that allows you to implement them in a thread-safe way.
The Advent of Monitoring Day 1: What Are Synthetics and Why They Are Needed
This is the first part of our 12-day Advent of Monitoring series. In this series, Checkly's engineers will share practical monitoring tips from their own experience. Hey there! Here is my take on what synthetic monitoring means and why it’s awesome! I think it’s a very complicated word for a very straightforward concept. In fact, I am convinced, that once you've used it, you will never want to live without it.
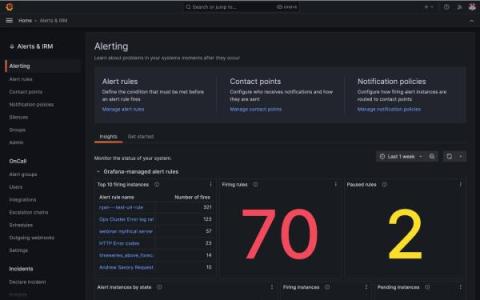
Grafana Alerting: How to monitor alerts for better alert management
With the release of Grafana 10.2, we made a number of enhancements to Grafana Alerting. These updates included the rollout of Insights, a new section of the Grafana Alerting home page. Available now to all Grafana Cloud users, Insights offers valuable information, such as statistics on alert rules and notifications, to help you monitor alerting data and quickly analyze alert performance.
What's Next: DX UIM 23.4
AWS re:Invent 2023 Recap
As we reflect on AWS re:Invent 2023, the Coralogix team is invigorated by the incredible response and feedback we received from the thousands of participants who visited our booth. It was clear that a recurring theme among companies is the need for an observability solution that not only scales affordably with increasing data volumes but is also at the forefront of innovation. Coralogix stands out as the ideal match for these requirements.
How To Guide: Connecting Cribl Search with the Azure API
In the ever-evolving world of data analysis, the ability to interact directly with live API endpoints is a significant advancement for practitioners. Cribl Search now offers this capability, enhancing your data analysis toolkit. This new feature allows you to gain broader visibility into the periphery of your infrastructure, enabling a more comprehensive analysis of user journeys and operational trends.
Top tips: 4 innovative ways IoT today can keep the doctor away
Top tips is a weekly column where we highlight what’s trending in the tech world and list ways to explore these trends. This week we’re looking at four revolutionary ways IoT is transforming healthcare. The past four years have brought about a series of unprecedented events that challenged our worldview, our lifestyle, and most importantly, how we view healthcare.
Take Back Control of Your Workflows, Data, and Costs with Splunk Observability
Monitor HAProxy Metrics and Logs with OpenTelemetry [Step By Step Guide]
FinOps and Cloud Cost Optimization #shorts #datadog #cloudservices
A deep dive into CPU requests and limits in Kubernetes
In a previous blog post, we explained how containers’ CPU and memory requests can affect how they are scheduled. We also introduced some of the effects CPU and memory limits can have on applications, assuming that CPU limits were enforced by the Completely Fair Scheduler (CFS) quota. In this post, we are going to dive a bit deeper into CPU and share some general recommendations for specifying CPU requests and limits.
Application Observability in Minutes: How to Implement App 360
As applications in the cloud become more distributed and complex, the Mean Time To Resolution (MTTR) for production issues is getting longer. Modern systems are built with hundreds of distinct, ephemeral, and interconnected cloud components, which can make it exceptionally hard for engineers to understand the current state of their applications, what problems are impacting customers, and why those problems are occurring.
Introducing App 360: Your Observability-Centric, Cost-Effective APM Alternative
Years before founding Logz.io, I was a software engineer, working with various tools to ensure my products and services performed correctly. There were few tools I dreaded using more than application performance management (APM), and I know that I’m not alone. I hated traditional APM. It’s heavy. It’s hard to implement. It’s expensive. It takes a very long time to derive business value.
Transforming digital success: Cisco Cloud Observability business metrics unveiled
In the dynamic landscape of digital business, the pursuit of delivering exceptional user experiences in every digital interaction continues to be a challenge. Cisco, a pioneer in full-stack observability, announced on November 28 at AWS re:Invent the release of business metrics for Cisco Cloud Observability. Let’s delve into the revolutionary landscape that this innovation is carving for both business owners and technical users.
How To Use AUTOSAR Runnables With Tracealyzer
Tracing of “runnables” is a fairly new feature in Percepio Tracealyzer, added in v4.7.0. One of our automotive customers needed this feature to make ISO 26262 certification of their Electronic Control Unit (ECU) software easier. In order to properly allocate ECU functions to tasks and to cores, and to ensure that they meet the budgeted resources, it is useful to know execution times, response times and wait times for each task and runnable.
Is your Java Observability tool Lambda Expressions aware?
Most SREs and IT Ops manage Java applications without source code access or communication with AppDev teams. When applications have performance issues those SREs or IT Ops teams deploying and maintaining the infrastructure often have to prove that it is the application at fault and supply information to the app supplier which provides evidence of the issue.
Why you need a Time Series Data Warehouse
8 Best Network Traffic Analysis Tools in 2023
6 Best Network Protocol Analyzer Tools in 2023
AI Explainer: ChatGPT Doesn't Actually Understand Any Words
AWS re:Invent 2023 highlights: Observability at Stripe, Capital One, and McDonald's
Last week, I attended the Amazon Web Services (AWS) re:Invent conference in Las Vegas, NV, with 50,000+ others. It was quite a busy week with several keynotes, announcements, and many sessions. While the hot topic at re:Invent was generative AI, I’ll focus my blog post on a few customer sessions I attended around observability: Stripe, Capital One, and McDonald’s.
Combining AWS and Prometheus with OpenTelemetry
In the realm of data and complex scenarios, we humans naturally gravitate towards visualizing things as entities with attributes, rather than just raw data. Consider the phrase, “The response time on our Ad Generation service has increased.” It immediately resonates with the audience supporting the service.
Apica Wins at the 2023 Intellyx Digital Innovator Award
In a significant achievement in digital transformation, APICA has been honored with the prestigious Winter 2023 Intellyx Digital Innovator Award. This recognition comes from Intellyx, the pioneering analyst firm exclusively focused on digital transformation, and the trailblazing vendors spearheading this journey. The Intellyx Digital Innovator Awards are not just accolades; they are a testament to a company’s ability to stand out in an intensely competitive and innovative field.
How to: Setup Cloud Deploy alerts
OpenTelemetry vs Jaeger : Comparing Apple and Oranges
Traces to metrics: Ad hoc RED metrics in Grafana Tempo
Traces to metrics: Ad hoc RED metrics in Grafana Tempo with 'Aggregate by'
In observability, finding the root cause of a problem is sometimes likened to finding a needle in a haystack. Considering that the problem might be visible in only a tiny fraction of millions or billions of individual traces, the task of reviewing enough traces to find the right one is daunting and often ends in failure.
Learning by Example with Cribl's New Lookup Examples Pack
In the world of data management, Cribl offers various methods to enhance data using the Lookup Function and many C.Lookup Expressions. While Cribl’s documentation is comprehensive, practical examples are often the most effective learning tools. That’s why we’ve introduced the new Lookup Examples Pack.
Search Best Practices - Sumo Logic Customer Brown Bag - Logging - Dec 5th, 2023
ES|QL Live: Empowering Your Data Journey
Importance of Log Management in IT Security
Around 70% of companies experienced cyberattacks in the past year. With this increase in cyberattacks, the importance of log management in IT security has also increased over the years. That’s the reason why small and enterprise businesses have started to invest in log management tools to protect their businesses from cybersecurity breaches.
What is Cloud Computing? Everything you need to know about the cloud explained
IT Support Levels: Optimizing the Support Service through Tiers 0 to 4
The art of software engineering management
Symbolicating stack traces from Apple system libraries
In the world of software development, quickly finding and fixing errors drives better experiences for both end-users and developers. One key tool in this process is the symbol map, which records debugging information that was lost in the compilation process. Symbol maps (or source maps if we're talking JavaScript) connect the code developers write to the minified code in production, making it easier to decipher crashes by pinpointing the exact source code that caused the error.
InfluxDB and Time Series Data is Foundational to the AI Revolution
Pairing InfluxDB with Data Lakes and Data Warehouses
Introduction to DX UIM
Spotlight: Sentry for Development
A long time ago I worked on a project called Django Debug Toolbar (DJDT). It was a local development plugin that would give you a debug overlay within Django’s development environment, helping you diagnose things like the SQL queries being made, environment configuration, and what templates were rendered. In general, it made the local dev experience much better, helping you prevent or more easily fix things like N+1 queries.
AI's Impact on Cloud-Native at KubeCon 2023
Cloud-native developers and practitioners gathered from around the world to learn, collaborate, and network at KubeCon/CloudNativeCon North America 2023 between November 6th and 9th at McCormick Place in Chicago, IL—myself included. This wasn’t my first time attending—I’ve been coming to KubeCon since 2016—but it was easily one of the most exciting experiences I’ve had as part of the Cloud Native community.
Improving Logic App security by suppressing workflow headers in external HTTP calls
VictoriaMetrics Enterprise, the World's Fastest Open-Source-Based Monitoring: Try It for Free
We’re happy to announce that we now offer a free trial of our VictoriaMetrics Enterprise solution! Designed to help solve an organisation’s monitoring and observability set ups, no matter the scale, VictoriaMetrics Enterprise provides reliable, secure and cost-efficient monitoring. The free trial of VictoriaMetrics Enterprise is perfect for organisations with large data loads, for whom cost-efficient monitoring is mission-critical.
Tracealyzer 4.8.2 Is Out
Tracealyzer version 4.8.2 has just been released. This version mainly fixes bugs, such as custom state machine models not being remembered on trace reload, and eliminates a number of compiler warnings in the Recorder source code. In addition, the update features improved streaming over UDP, and the bundled SSH library SSH.NET has been updated to the latest version. Users with a current maintenance contract can upgrade to Tracealyzer 4.8.2 from within the application, or by visiting the update page.
Checkly Recognized by Intellyx: A Reflection of Our Commitment to Monitoring as Code
We're excited to share that Checkly has been named a 2023 Winter Intellyx Digital Innovator. This recognition resonates deeply with our Monitoring as Code (MaC) workflow and the values we uphold in delivering Checkly to cloud-native engineers, solving uptime and reliability challenges to ship with confidence.
Experience Everywhere Wrap Up: Electric Energy Around the World
The Experience Everywhere tour is a wrap, and what a tour it was! We had an incredible time meeting up with our customers, partners, and DEX practitioners from all around the world to share expertise, learn, and grow. If you couldn’t make it (or even if you could) – you can relive all the action now over on our Experience Replays. Below, we asked a few Nexthinkers to send us their thoughts on each of the four Experience locations.
Monitor complex API endpoints with Checkly API checks
CTO Fireside Chat #cto #asana #datadog #leadership #ml #ai #shorts
Sending Data to Elastic Security With Cribl Stream (And Making It Work With Elastic SIEM)
Cribl Stream is a real-time security and observability data processing pipeline that can be used to collect, transform, enrich, reduce, redact, and route data from a variety of sources to a variety of destinations. One of the popular destinations for Cribl users is Elastic SIEM. This blog post will walk you through the steps on how to set up Cribl Stream to normalize and forward data to use with Elastic Security for SIEM.
Multi-Cluster Observability Part 3: Practical Tips for Operational Success
This is the final article of a three-part series. To start at the beginning, read Part 1: Benefiting from multi-cluster setups requires familiarity with common variations and Part 2: Exploring the facets of a multi-cluster observability strategy. As companies scale software production, they lean on Kubernetes as a crucial container orchestration platform for managing, deploying and ensuring software availability.
Sematext Kubernetes Monitoring Demo
Future-Proofing Resilience: How Manufacturers Are Navigating Growing Pains of IT/OT Convergence
How to Monitor MSP Networks for 360-Degree Visibility
OpenTelemetry Auto & Manual Instrumentation Explained with a Sample Python App
The case for Kubernetes resource limits: predictability vs. efficiency
This blog post by Grafana Labs Senior Software Engineer Milan Plžík was originally published on the Kubernetes.io blog on Nov. 16, 2023. There’s been quite a lot of posts suggesting that not using Kubernetes resource limits might be a fairly useful thing (for example, For the Love of God, Stop Using CPU Limits on Kubernetes or Kubernetes: Make your services faster by removing CPU limits ).
What's new in SquaredUp: 2023 June - Dec highlights
As 2023 draws to a close, we’re celebrating a full year since the release of SquaredUp Cloud – our revolutionary observability portal for product, engineering, and IT teams. In the last six months, we’ve packed in a ton of product improvements, including new visualizations, even more out-of-the-box dashboards, and a fast growing suite of pre-built plugins.
InfluxDB Expands into Real-Time Analytics
[Webinar] Are your networks resilient? Learn how network observability can help.
57% of UK consumers say digital bliss a must for festive fun, Cisco survey reveals
Unlock the power of network forecasting with machine learning
In the dynamic world of IT, traditional network monitoring approaches are no longer sufficient to manage the complexities of today’s networks—be they wired or wireless. To stay ahead of network events, IT administrators must shift from being reactive to adopting a proactive stance. This transition involves a comprehensive approach to network monitoring that includes forecasting future network requirements with the help of machine learning (ML) technology.
Benefits of Public Sites for External Monitoring
Exoprise supports monitoring from inside the firewall and outside the firewall. Every day, we have prospects spin up Synthetic Transaction Monitoring (STM) as part of their free trial to test tenant access and performance from one of the Exoprise public points of presence, which we refer to as public sites.
Mocha vs Jasmine, Chai, Sinon & Cucumber in 2024
Web Unleashed 2023: Publishing JavaScript Libraries Made Easy - Abhijeet Prasad
Highlights from AWS re:Invent 2023
Whether or not you made the journey to this year’s re:Invent, there’s always a variety of great announcements lost amid an action-packed week of keynotes, breakouts, expo hall demos, and networking sessions. No need to worry—we’re always happy to be a big part of the re:Invent experience and share our observations with you.
'The Story of Grafana' documentary: Celebrating OSS, community, and innovation
On Dec. 5, 2013, Torkel Ödegaard made the first commit in GitHub for a personal project that would become Grafana. “It’s hard to believe it’s been 10 years since Torkel launched Grafana, growing from a small man with a big dream to becoming the most popular data visualization software in the world,” says Grafana Labs co-founder and CEO Raj Dutt. “The Story of Grafana” chronicles that meteoric journey.
Cribl Stream + CDS: An Air Gapped Data Transfer Solution
In this blog series, we’ll explore how Cribl Stream can leverage your existing cross-domain solution (CDS) to easily collect and send your log and metric data between disparate security domains or across air-gapped networks. The goal is to retain as much fidelity of the data as possible, deduplicating processes and simplifying management efforts.
The Story of Grafana | Episode 1: Democratize Metrics | Grafana Documentary
Unraveling the Dangers of Phishing: From Basics to Effective Prevention
Brands must focus on digital experience to spread festive cheer this holiday season
Survey results reveal the critical role of applications and digital services during the most wonderful time of the year. Research published today by Cisco reveals that consumers around the world will be using more applications and digital services over the holiday season than ever before. But seasonal goodwill will quickly turn to festive fury if applications don’t perform as they should. And some people claim they will turn into the Grinch!
Why Is Log Data So Important In Observability?
ShipHero's Observability Journey to Seamless Software Debugging
ShipHero needed a robust, cost efficient observability platform to support DevOps, customer support, and more. Committed to timely service, ShipHero recognizes that the seamless performance of its software is paramount to customer satisfaction. To maintain this high standard, the development team needs the right data at their fingertips to quickly find and solve problems as they occur.
Stop observing, start automating: RedHat and LogicMonitor pioneer the next gen of Event-Driven Ansible
Datadog on Kubernetes Node Management #datadog #kubernetes #observability #infrastructure #shorts
Detect and diagnose purchase abandonment with automation
Using InfluxQL in InfluxDB 3.0
What InfluxDB 3.0 Product is Right for You? Paul Dix Explains
What's the Deal with Cardinality and InfluxDB 3.0?
User Behavior Monitoring with M-21-31
Monitoring Microsoft Windows with Grafana Cloud: new updates
Windows is widely used by developers, businesses, and individuals alike. Renowned for its adaptability, security, and reliability, the operating system is a preferred choice for servers, desktops, and embedded devices. It also holds a significant presence in the cloud, serving as the foundation for numerous major websites and applications.
How fintech companies can prepare for new DORA regulations
re:Invent Recap Livestream
Why InfluxData Built the All-New InfluxDB 3.0
Health Check Monitoring With OpenTelemetry | Complete Code Tutorial
Monitoring with AWS Cloudwatch
SLA Management Best Practices for IT Services
Leveraging ISP Network Monitoring for Competitive Edge
2024 Predictions: AI Innovation Meets Digital Resilience
Decoding routing outages: 7 tips for safeguarding your network connectivity
Network outages have become a dreaded reality, disrupting businesses, personal lives, and communication channels. While no network is immune to this unfortunate event, the recent Australian telecom outage serves as a stark reminder of the impact such disruptions can have. The outage, which lasted for several hours, caused nationwide disruptions to Australian businesses, essential services, and daily life.
NiCE Active 365 Management Pack for Microsoft SCOM
Monitoring Microsoft 365 is crucial for maintaining a secure and efficient digital workspace. It enables real-time tracking of user activities, ensuring compliance with security protocols and identifying potential threats or anomalies. Continuous monitoring helps in the early detection of issues, preventing downtime and data loss, while also providing insights for optimizing system performance.
NiCE VMware Management Pack for Microsoft SCOM
Monitoring VMware environments is crucial for maintaining optimal performance and ensuring seamless operations within an organization. It provides real-time visibility into the health, performance, and utilization of virtualized infrastructure, enabling proactive identification of potential issues before they impact critical systems.
NiCE VMware Management Pack for Microsoft SCOM | Use Case
Monitoring VMware environments is crucial for maintaining optimal performance and ensuring seamless operations within an organization. It provides real-time visibility into the health, performance, and utilization of virtualized infrastructure, enabling proactive identification of potential issues before they impact critical systems.
NiCE Oracle Management Pack for Microsoft SCOM
Monitoring Oracle databases is crucial for maintaining optimal performance, identifying potential issues, and ensuring data integrity within an organization. It allows real-time tracking of database health, performance metrics, and resource utilization, enabling timely interventions to prevent downtime or performance bottlenecks. Additionally, monitoring helps in detecting and addressing security threats, ensuring compliance with industry standards and regulations.
Amazon EKS Monitoring with OpenTelemetry [Step By Step Guide]
re:Invent 2023 day 4 recap
Werner Vogel’s keynote is usually the highlight of re:Invent and 2023 is no different. Although there were no noteworthy service announcements, Werner gave a timely reminder that cost is an important non-functional requirement and that we should all strive to be a frugal architect.
Migrating BizTalk Platform one-way routing solutions
6 Best IP Address Trackers to Identify IP Addresses in 2023
Troubleshooting K8S EKS with Lightrun Developer Observability Platform
ELI5 Distributed tracing #observability #tracing #tempo
Conway's Law Explained
KubeCon NA 2023: What a Conference!
Now that we’ve had time to decompress from KubeCon, we wanted to do a writeup about our collective experience. Six of us spoke at the conference and Charity participated in a panel, so we included short talk recaps.
Insights and Innovations: Gartner IT Symposium/Xpo 2023
Gartner recently held their annual IT Symposium/Xpo in Orlando and Barcelona, respectively. We attended both events, a jam-packed four days of learning, dynamic conversations, and innovative sessions. It was great showcasing our latest capabilities, reconnecting with our clients, and witnessing first-hand the demand for Internet resilience within the broader community.
How Toyota Connected uses Datadog Workflow Automation to reduce time to resolution #datadog #shorts
Log management with Grafana Cloud: 4 observability experts share their move from OSS to Grafana Cloud Logs
While we built Grafana Loki as an open source log aggregation system that is cost effective and easy to operate, let’s face it: sometimes there is no time or bandwidth to mess around with self-managing and self-hosting. Luckily there’s the fully managed Grafana Cloud observability stack for log management. “Grafana Cloud is a no-BS platform. The engineering costs of hosting it ourselves would be much higher," says Jameel Al-Aziz, a software architect at Paradigm.
Events vs. Alerts vs. Incidents
Event. Alert. Incident. These terms are bandied about, often interchangeably, in IT operations management. Broadly speaking, they all refer to situations where something is potentially amiss and needs to be investigated and resolved. Each of these three words does, however, have a distinct definition. Because they are used in scenarios where clear communication and timeliness are critical, it’s important to understand the differences and use them appropriately.
The Dangers of Using VC Funded Companies
TrackJS started ten years ago. To date, the only funding TrackJS ever received was the initial founder investment of $4,500 dollars (a whopping $1,500 per founder). Today, you’d call us a “bootstrapped” business. We’re proud of that fact. It means there’s no outside investors. No one to make us build a product we don’t want to build. And no one that can pull the plug if the growth chart doesn’t look like a hockey stick.
Apica Ascent Triumphs in 2023 SoftwareReviews APM Report
Apica’s Ascent has achieved remarkable results in the 2023 Application Performance Management Data Quadrant Report published by SoftwareReviews, a notable source for insights on the software provider landscape. The report gathers extensive customer experience data from business and IT professionals, offering detailed and authentic insights into the experience of evaluating and purchasing enterprise software.
Unified Observability: MongoDB and Grafana Cloud integration
Discover the Untapped Power of AI in Predicting Correlations Before It's Too Late!
Your device pings, signaling another tech alert. Before you can address it, two more chime in. We all know the feeling. In today’s digital world, it’s easy to feel overwhelmed by the sheer number of notifications we receive. But what if there was a smarter way to handle them?
How to Instrument Java Applications using OpenTelemetry - Tutorial & Best Practices
Nonprofits' Silent Sentinel: How Uptime.com Is Revolutionizing Website Monitoring
In the world of nonprofits, every interaction, every donation, and every piece of content delivered serves a mission. Your website isn’t just a portal—it’s a lifeline connecting needs to solutions, dreams to reality, and intentions to impacts. However, like a capricious trickster, downtime slinks around corners, ready to sever those connections in an unanticipated moment.
Migrating a BizTalk Request-Response routing solution with LOB Adapters
How to Monitor Microsoft Teams Key Metrics
The pandemic has made Unified Communications and Collaboration (UCC) Platforms like Microsoft Teams essential for remote work. As organizations rely on Teams (and similar applications) for meetings, user experience becomes critical. Many DEM solutions promise effective Microsoft Teams monitoring. However, many such solutions lack data acquisition to measure and quantify results. Many DEM tools struggle with the nomadic nature of work today and can't capture or partition metrics depending on where employees work; hybrid, at home, or at the corporate HQ. This article assesses the effectiveness of performance monitoring compared to other solutions.
How DORA DevOps best practices helped Circles launch a telco-as-a-service in under two months
Circles X uses DORA DevOps best practices to build the first telco-as-a-service in Indonesia, helping partners to launch a digital telco.
AWS re:Invent 2023 Recap: Top Highlights and Takeaways
How to get started with Tempo with Joe Elliott (Grafana Office Hours #22)
Log Management: The Apica Way
In today’s hybrid cloud era, the volume and diversity of log data have exploded, which makes managing them ever so challenging. IT teams need to conquer the gush of logs by providing context whilst having an effective log management strategy. Without a powerful log management solution, it all becomes too cumbersome. And even if you do get your hand around a good log management platform, you’ll find yourself stuck with hefty licensing costs and impractical compliance issues.
Announcing CloudFabrix's Data Fabric for Observability for Cisco's Observability Platform
Netdata's Cost Transparency - Unveiling the True Cost of Monitoring
A Practical Guide to Debugging Browser Performance With OpenTelemetry
So you’ve taken a look at the core web vitals for your site and… it’s not looking good. You’re overwhelmed, and you don’t know what change to make because everything seems like too big of a project to make a real difference. There are so many measurements to keep track of and the standards cited seem even scarier. This is extremely normal. Web performance standards can feel impossible to meet for a lot of us.
Azure Savings Plan for Compute Resources
What Is Network Optimization?
The future of generative AI in public sector
Recently, I sat down with Adelaide O’Brien, research vice president at IDC Government Insights, to discuss the current and future state of generative AI in the public sector worldwide. The full conversation is available to view on demand, but I also wanted to highlight some of the takeaways from the discussion.
Spring Boot Monitoring with Open-Source Tools
7 Million Docker Downloads, uPlot Charting Library, and Improvements in Dashboard - SigNal 31
Nginx Metrics and Logs Monitoring with OpenTelemetry
Detecting Dubious Domains with Levenshtein, Shannon & URL Toolbox
OnlineOrNot updates from November 2023
How To Instrument Golang app using OpenTelemetry - Tutorial & Best Practices
Cassandra vs OpenSearch
In the following comparison table, we will provide you with an extensive guide designed to enable a detailed assessment of Cassandra and OpenSearch. This comparison aims to supply an in-depth exploration of multiple aspects of these two database systems, providing you with the insights required to make informed decisions tailored to your specific use case.
Observability with Grafana Cloud: Explore the latest and greatest features
Grafana Cloud constantly evolves to include new, cutting-edge features for end-to-end observability. In fact, just last month at ObservabilityCON 2023, we made a number of updates to our fully managed observability platform, including the general availability of Grafana Cloud Application Observability, Grafana SLO, and Adaptive Metrics.
Configuring Elastic Agent's new output to Kafka
Data Lakehouses Explained
The big data landscape is always changing to solve existing problems and continues to push the boundaries of performance and scale. Data lakehouses are a new architectural pattern that is rapidly gaining popularity by solving a variety of problems seen with previous solutions like data warehouses and data lakes. In this article, you will learn the following.
Routing Around the World with Cribl Stream!
Transunion is an American consumer credit reporting agency that operates in over 30 countries. They use Cribl Stream to aggregate and route regional data into a centralized hub, presenting it in a single dashboard that admins can use to interpret the overall health of their system. Watch the full video on YouTube or below to see Transunion’s Steve Koelpin and Don Reilly walk through this use case.


