Operations | Monitoring | ITSM | DevOps | Cloud
March 2023
Elastic Observability 8.7: Enhanced observability for synthetic monitoring, serverless functions, and Kubernetes
Elastic Observability 8.7 introduces new capabilities that drive efficiency into the management and use of synthetic monitoring and expand visibility into serverless applications and Kubernetes deployments. These new features allow customers to: Observability 8.7 is available now on Elastic Cloud — the only hosted Elasticsearch offering to include all of the new features in this latest release.
Lightrun's Product Updates - Q1 2023
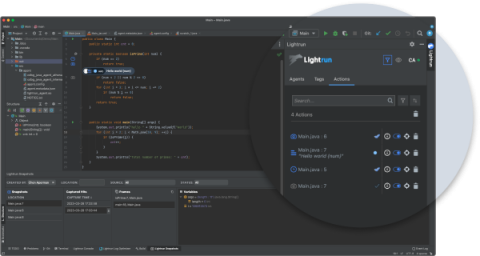
During the past quarter, Lightrun has been busy at work producing a wealth of developer productivity tools and enhancements, aiming for greater troubleshooting of distributed workload applications and cost efficiency. Read more below the main new features as well as the key product enhancements that were released in Q1 of 2023!
Building a Distributed Security Team With Cjapi's James Curtis
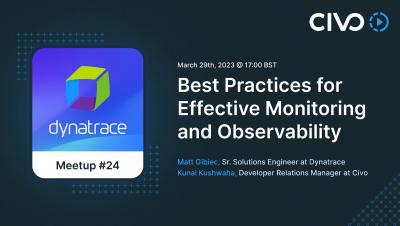
Best Practices for Effective Monitoring and Observability - Civo.com
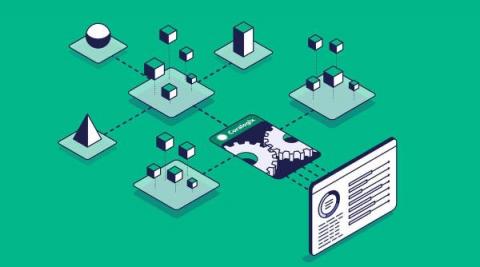
Four Things That Make Coralogix Unique
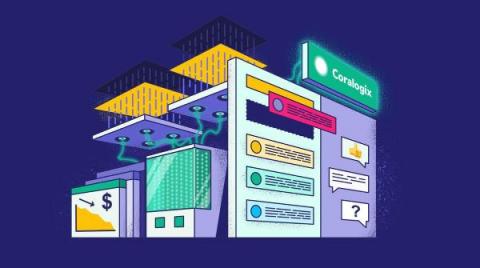
SaaS Observability is a busy, competitive marketplace. Alas, it is also a very homogeneous industry. Vendors implement the features that have worked well for their competition, and genuine innovation is rare. At Coralogix, we have no shortage of innovation, so here are four features of Coralogix that nobody else in the observability world has.
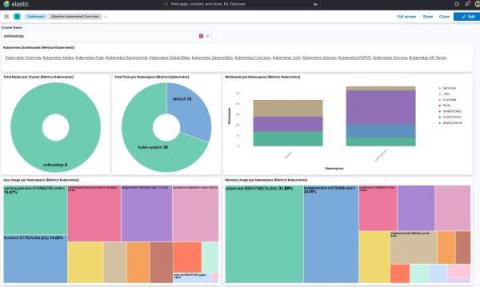
Comprehensive Kubernetes Observability with LogicMonitor's Kube-State-Metrics Integration
Splunk Synthetics in Observability Terraform Provider Released
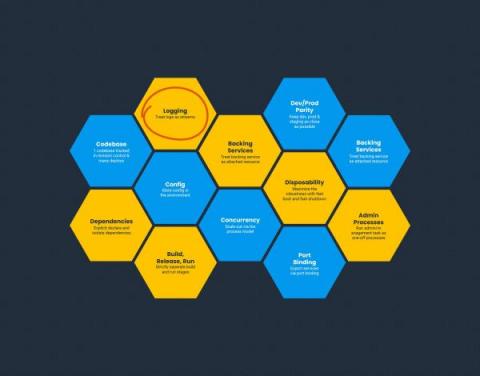
Twelve-Factor Apps and Modern Observability
The Twelve-Factor App methodology is a go-to guide for people building microservices. In its time, it presented a step change in how we think about building applications that were built to scale, and be agnostic of their hosting. As applications and hosting have evolved, some of these factors also need to. Specifically, factor 11: Logs (which I’d also argue should be a lot higher up in the ordering).
Elastic Observability: Built for open technologies like Kubernetes, OpenTelemetry, Prometheus, Istio, and more
As an operations engineer (SRE, IT Operations, DevOps), managing technology and data sprawl is an ongoing challenge. Cloud Native Computing Foundation (CNCF) projects are helping minimize sprawl and standardize technology and data, from Kubernetes, OpenTelemetry, Prometheus, Istio, and more. Kubernetes and OpenTelemetry are becoming the de facto standard for deploying and monitoring a cloud native application.
Trace at Your Own Pace: Three Easy Ways to Get Started with Distributed Tracing
Learn How NS1 Uses Distributed Tracing to Release Code More Quickly and Reliably
Making the Case: The Business Value of Observability
Discover Unknown Service Interaction Patterns With Istio & Honeycomb
Intercom: Building a More Resilient Ecosystem Through Observability
What Is Observability? Examples of How It Can Help You
Observability is a powerful concept that can help you gain insight into the performance of your systems and applications. It refers to the ability to measure, monitor, analyze, and manage different aspects of an infrastructure or application—from hardware components to application code. With observability techniques such as distributed tracing, monitoring metrics, log analysis, and anomaly detection, organizations can ensure their applications run smoothly without downtime or disruption.
Learn How SumUp Implemented SLOs to Mitigate User Outages and Reduce Customer Churn
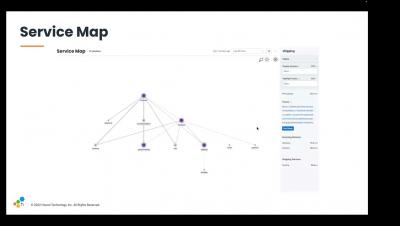
Learn to Leverage Service Maps with Honeycomb
Surface and Confirm Buggy Patterns in Your Logs Without Slow Search
Honeycomb and OTel Demo
How Much Should Your Observability Stack Cost?
Observability is critical to any software development. It is a term that describes the ability to monitor the performance and health of applications, services, and infrastructure. Observability aims to quickly identify and troubleshoot problems before they become full-blown incidents that can lead to costly downtime. But how much should you invest in an observability stack? Regarding the cost of your observability stack, there is no one-size-fits-all answer.
Reference Architecture Series: Scaling Syslog
See How Coveo Engineers Reduced User Latency
Join Jeli and Honeycomb for an Incident Response and Analysis Discussion
The future of observability: Trends and predictions business leaders should plan for in 2023 and beyond
If the past year has taught us anything, it’s that the more things change, the more things stay the same. The whiplash and pivot from the go-go economy post-pandemic to a belt-tightening macroeconomic environment induced by higher inflation and interest rates has been seen before, but rarely this quickly. Technology leaders have always had to do more with less, but this slowdown may be unpredictable, longer, and more pronounced than expected.
The Ultimate Guide to Digital Workplace Observability
The digital workplace has evolved dramatically over the past decade, both in terms of the increased reliance on technology for daily operations and the complexity of that technology. In order to manage an improve the digital workplace, service desk teams need more than just a comprehensive view of their IT environments — they need to be able to analyze that data in real-time to make faster, more continuously effective decisions. Enter: digital workplace observability.
Introduction to Kubernetes Observability
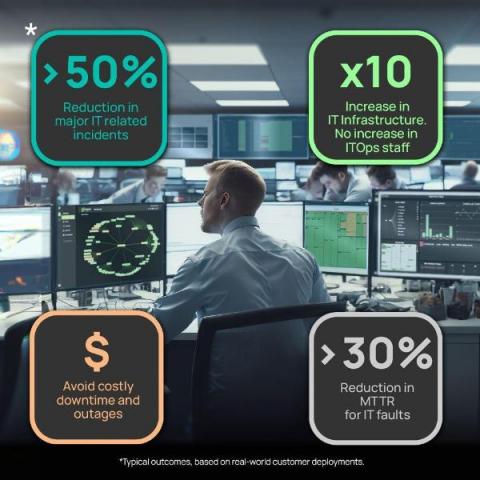
Top 10 AIOps & Observability Capabilities for the Banking and Finance Sector
Maintaining trust in the business services your customers rely on is everything. With ever-increasing customer expectations and the promise of ‘always-on’ services, poor digital experiences and outages can cause significant harm to your business. The Interlink Software AIOps and Observability platform strengthens IT teams’ capability to deliver more reliable, available digital services and reduce the risk of customer impacting disruption.
Ask Miss O11y: Is There a Beginner's Guide On How to Add Observability to Your Applications?
I want to make my microservices more observable. Currently, I only have logs. I’ll add metrics soon, but I’m not really sure if there is a set path you follow. Is there a beginner's guide to observability of some sort, or best practice, like you have to have x kinds of metrics? I just want to know what all possibilities are out there. I am very new to this space.
Splunk Observability in Less Than 2 Minutes
User Experience Monitoring with Elastic Observability Synthetics
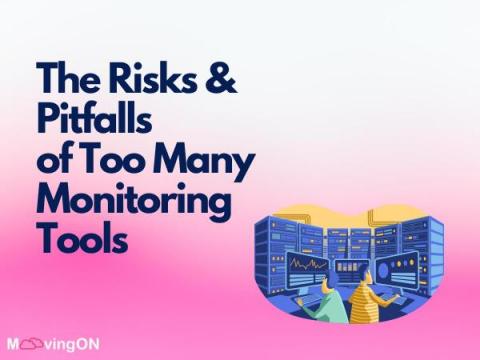
The Risks and Pitfalls of Too Many Monitoring Tools
If you are like most organizations, your technology environment is a complex mixture of tools needed to run your business. In this environment, monitoring and observability are critical to making sure everything is running smoothly. You use monitoring tools to measure server resources, log-parsing tools for troubleshooting, application tools to observe application performance, and audit-request tools to comply with regulations. While these are all valid observability needs, there are risks to overdoing it by introducing too many tools. Here are some ways to avoid monitoring proliferation when developing your observability strategy.
Level Up Your Observability Game With the Cribl Suite of Products: All About Our 4.1 Release
After our recent company-wide offsite in New Orleans, the Cribl employees are feeling like they’ve leveled up in more ways than one. Not only did we indulge in delicious beignets and king cakes, but we also came back motivated to create some kick-ass new product features with our 4.1 release. It’s like we soaked up all the good vibes and brought them back with us.
Observing an application with Elastic Observability APM
Easily configure Elastic to ingest OpenTelemetry data
SaaS Observability Platforms: A Buyer's Guide
Observability is the ability to gather data from metrics, logs, traces, and other sources, and use that data to form a complete picture of a system’s behavior, performance, and health. While monitoring alone was once the go-to approach for managing IT infrastructure, observability goes further, allowing IT teams to detect and understand unexpected or unknown events.
How Do We Cultivate the End User Community Within Cloud-Native Projects?
The open source community talks a lot about the problem of aligning incentives. If you’re not familiar with the discourse, most of this conversation so far has centered around the most classic model of open source: the solo unpaid developer who maintains a tiny but essential library that’s holding up half the internet. For example, Denis Pushkarev, the solo maintainer of popular JavaScript library core-js, announced that he can’t continue if not better compensated.
Platform Engineering Is the Future of Ops
How We Define SRE Work, as a Team
Last year, I wrote How We Define SRE Work. This article described how I came up with the charter for the SRE team, which we bootstrapped right around then. It’s been a while. The SRE team is now four engineers and a manager. We are involved in all sorts of things across the organization, across all sorts of spheres. We are embedded in teams and we handle training, vendor management, capacity planning, cluster updates, tooling, and so on.
MIAX and Cribl Stream: Enriching Data for Improved Observability and Faster Time to Value
Using Cribl Stream for observability is a given, but what about using Cribl Stream to get MORE from your data? Observability is all about being able to collect, route, store, and search your data. Implementing enrichment with observability provides more context and elevates your ho-hum data to robust information. This is key to faster, more confident decision-making!
Gain real-time observability into your software supply chain with the New Relic Log Analytics Integration
Metrics vs. Logs vs. Traces (vs. Profiles)
In software observability, we often talk about three signal types - metrics, logs, and distributed traces. More recently I've been hearing about profiles as another signal type. In this article I will explain the different observability signals and when to use them in a clear and concise way.
Using Elastic to observe GKE Autopilot clusters
Elastic Agent provides a new observability option for fully managed GKE clusters
Part 3: Automating the Observer
This is the final blog of a three-part blog series on Observability—the challenges and the solutions.
A Guide to Enterprise Observability Strategy
Observability is a critical step for digital transformation and cloud journeys. Any enterprise building applications and delivering them to customers is on the hook to keep those applications running smoothly to ensure seamless digital experiences. To gain visibility into a system’s health and performance, there is no real alternative to observability. The stakes are high for getting observability right — poor digital experiences can damage reputations and prevent revenue generation.
Feature Focus: Winter Edition
It’s been a minute since our last Feature Focus, and we have a bit of catching up to do! I’m happy to report we’ll resume monthly updates next month, but until then, please enjoy this super-sized winter digest of what we’ve been up to at Honeycomb.
The Importance of Observability Pipelines in Gaining Control over Observability and Security Data
Today’s enterprises must have the capability to cope with the growing volumes of observability data, including metrics, logs, and traces. This data is a critical asset for IT operations, site reliability engineers (SREs), and security teams that are responsible for maintaining the performance and protection of data and infrastructure. As systems become more complex, the ability to effectively manage and analyze observability data becomes increasingly important.
Panel Discussion: Observability
Deploys Are the WRONG Way to Change User Experience
I'm no stranger to ranting about deploys. But there's one thing I haven't sufficiently ranted about yet, which is this: Deploying software is a terrible, horrible, no good, very bad way to go about the process of changing user-facing code. It sucks even if you have excellent, fast, fully automated deploys (which most of you do not). Relying on deploys to change user experience is a problem because it fundamentally confuses and scrambles up two very different actions: Deploys and releases.
Getting Started with Instant Evaluation
Why Seven.One Entertainment Group Chose Datadog RUM for Client-side Observability
How Coveo Reduced User Latency and Mean Time to Resolution with Honeycomb Observability
When you’re just getting started with observability, a proof of concept (POC) can be exactly what you need to see the positive impact of this shift right away. Coveo, an intelligent search platform that uses AI to personalize customer interactions, used a successful POC to jumpstart its Honeycomb observability journey—which has grown to include 10,000+ machine learning models in production at any one time. Wondering how Coveo got there? So were we.
Beyond Logging: The Power of Observability in Modern Systems
Empowering Security Observability: Solving Common Struggles for SOC Analysts and Security Engineers
5 key takeaways from the Grafana Labs Observability Survey 2023
Observability is coming into its own, as SREs and DevOps practitioners increasingly seek to centralize the sprawl of tools and data sources to better manage their workloads and respond to incidents faster — and to save time and money in the process. That was the overarching message from more than 250 observability practitioners who took part in the Grafana Labs’ first ever Observability Survey.
Data Gravity in Cloud Networks: Distributed Gravity and Network Observability
So far in this series, I’ve outlined how a scaling enterprise’s accumulation of data (data gravity) struggles against three consistent forces: cost, performance, and reliability. This struggle changes an enterprise; this is “digital transformation,” affecting everything from how business domains are represented in IT to software architectures, development and deployment models, and even personnel structures.
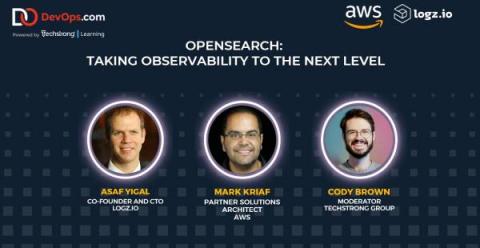
OpenSearch and Logz.io - Taking Observability to the Next Level
If you’re in the cloud engineering and DevOps space, you’ve probably seen the name OpenSearch a lot over the last couple of years. But, what is your current understanding of OpenSearch, and the components around it? Let’s take a closer look.
Caring for Complex Systems: We Can Do This
When we work at it, professionals are pretty good at analysis. We can break down a simple system, look at its parts and their relations, and master it. Given enough time and teammates, we can analyze a very complicated system and fix it when it breaks. But complex systems don’t yield to analysis. We have to add another skill: sense-making. Complex systems have parts that learn and change, with relations that vary with state and history. They respond to and influence their environment.
Managing Complex Cloud Migration With Observability
How Can You Optimize Business Cost and Performance With Observability?
Businesses are increasingly adopting distributed microservices to build and deploy applications. Microservices directly streamline the production time from development to deployment; thus, businesses can scale faster. However, with the increasing complexity of distributed services comes visual opacity of your systems across the company. In other words, the more complex your system gets, the harder it becomes to visualize how it works and how individual resources are allocated.
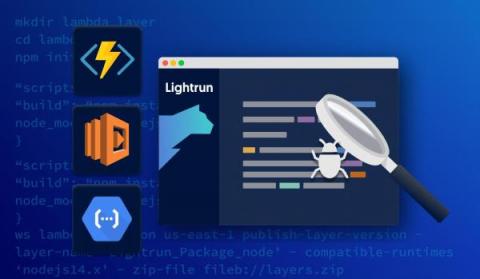
Debugging Serverless Functions with Lightrun
Developers are increasingly drawn to Functions-as-a-Service (FaaS) offerings provided by major cloud providers such as AWS Lambda, Azure Functions, and GCP Cloud Functions. The Cloud Native Computing Foundation (CNCF) has estimated that more than four million developers utilized FaaS offerings in 2020. Datadog has reported that over half of its customers have integrated FaaS products in cloud environments, indicating the growth and maturity of this ecosystem.
Understanding Distributed Tracing with a Message Bus
So you're used to debugging systems using a distributed trace, but your system is about to introduce a message queue—and that will work the same… right? Unfortunately, in a lot of implementations, this isn't the case. In this post, we'll talk about trace propagation (manual and OpenTelemetry), W3C tracing, and also where a trace might start and finish.
Observability from Development to Production with Platform.sh Observability
Event Breakers in Cribl Stream
Machine-Learning Automation: Processing, Storing, & Analyzing Data in the Digital Age
The world of software is growing more complex, and simultaneously changing faster than ever before. The simple monolithic applications of recent memory are being replaced by horizontal cloud-native applications. It is no surprise that such applications are more complex and can break into infinitely more ways (and ever new ways). They also generate a lot more data to keep track of. The pressure to move fast means software release cycles have shrunk drastically from months to hours, with constant change being the new normal.
How Monitoring, Observability & Telemetry Come Together for Business Resilience
Industry Experts Discuss Cybersecurity Trends and a New Fund to Shape the Future
How to Achieve Full Stack Observability in Highly Distributed Environments Webinar
How 3 Companies Implemented Distributed Tracing for Better Insight into Their Systems
Distributed tracing enables you to monitor and observe requests as they flow through your distributed systems to understand whether these requests are behaving properly. You can compare tiny differences between multiple traces coming through your microservices-based applications every day to pinpoint areas that are affecting performance. As a result, debugging and troubleshooting are simpler and faster.
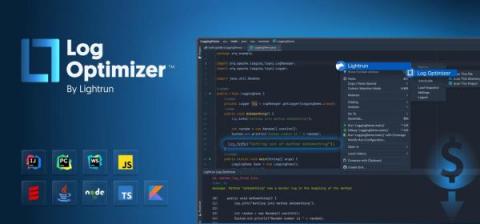
Reduce 60% of your Logging Volume, and Save 40% of your Logging Costs with Lightrun Log Optimizer
As organizations are adopting more of the FinOps foundation practices and trying to optimize their cloud-computing costs, engineering plays an imperative role in that maturity. Traditional troubleshooting of applications nowadays relies heavily on static logs and legacy telemetry that developers added either when first writing their applications, or whenever they run a troubleshooting session where they lack telemetry and need to add more logs in an ad-hoc fashion.


