Operations | Monitoring | ITSM | DevOps | Cloud

Open Source

Generative AI for Kubernetes: Meet K8sGPT Open Source Project

Troubleshooting within Kubernetes environments can be a daunting task. If we could only have a magical artificial intelligence advisor that could gather all the data about what goes on the system, and tell me what’s wrong, and even how to solve it. Wouldn’t it be nice? K8sGPT is a young open source project that uses generative AI to give Kubernetes superpowers to everyone. It recently turned a year old, and is now part of the Cloud Native Computing Foundation (CNCF).

The power of Kubevirt and Calico

Virtualization is a powerful technology that allows businesses to run multiple operating systems and applications on a single physical server. Kubevirt is an open-source tool that makes it easy to deploy and manage virtual machines (VMs) on Kubernetes and Calico is an open-source networking and security tool that provides easy yet robust networking and security for Kubernetes workloads.

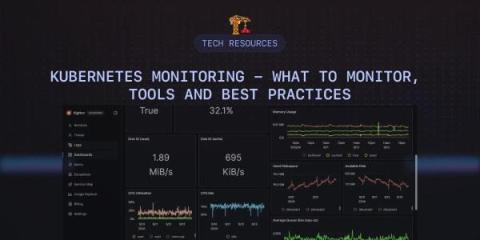
Kubernetes Monitoring - What to Monitor, Tools and Best Practices

Kubernetes has since emerged as “THE” container orchestration platform for deploying and managing containerized workloads as a result of its robust capabilities. However, the complexity of its architecture and its dynamic nature present significant challenges in monitoring deployed workloads and the platform itself. Kubernetes monitoring is crucial for maintaining the health, performance, and reliability of containerized applications.

An overview of machine learning security risks

Data is at the heart of all machine learning (ML) initiatives – and bad actors know it. As AI continues to occupy the limelight of modern tech discourse, ML systems are becoming increasingly attractive targets for attack. With the Identity Theft Resource Center reporting a 72% spike in data breaches in 2023, it’s critical to take the proper precautions to ensure your ML projects don’t provide a back door to your data.

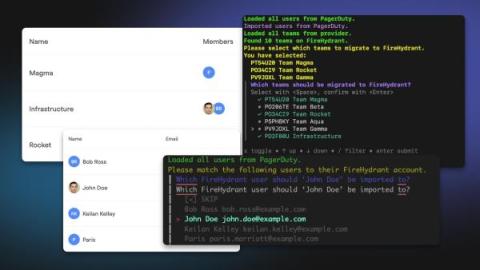
Speedrun to Signals: automated migrations are here

When we launched Signals to the world, we were excited to hear how our product resonated with many teams. But with that excitement came an understandable concern: how much time and effort will I have to put in to move from my existing provider to Signals? We hear you — that’s why we built the Signals Migrator tool. And we’re open sourcing it.

When Your Open Source Turns to the Dark Side

Not that long ago, in a galaxy that isn’t remotely far away, a disturbance in the open source world was felt with wide-ranging reverberations. Imagine waking up one morning to find out that your beloved open source tool, which lies at the heart of your system, is being relicensed. What does it mean? Can you still use it as before? Could the new license be infectious and require you to open source your own business logic? This doom’s day nightmare scenario isn’t hypothetical.

Open-source Telemetry Pipelines: An Overview

Imagine a well-designed plumbing system with pipes carrying water from a well, a reservoir, and an underground storage tank to various rooms in your house. It will have valves, pumps, and filters to ensure the water is of good quality and is supplied with adequate pressure. It will also have pressure gauges installed at some key points to monitor whether the system is functioning efficiently. From time to time, you will check pressure, water purity, and if there are any issues across the system.

How To Harness the Full Potential of ELK Clusters

The ELK Stack is a collection of three open-source projects, Elasticsearch, Logstash, and Kibana. They operate together to centralize and examine logs and other types of machine-generated data in real time. With the ELK stack, you can utilize clusters for effective log and event data analysis and other uses. ELK clusters can provide significant benefits to your organization, but the configuration of these clusters can be particularly challenging, as there are a lot of aspects to consider.

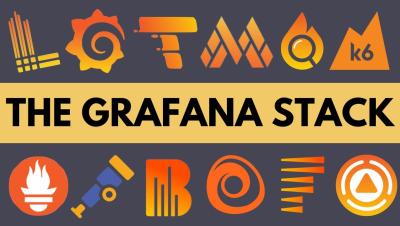
Open source observability explained - the Grafana Labs stack

Wish you could have open source observability explained to you? Senior Developer Advocate Nicole van der Hoeven explains how all the OSS projects from the Grafana Labs stack work together and how the picture they're all building towards is continuous reliability. TIMESTAMPS: ☁️ Grafana Cloud is the easiest way to get started with Grafana dashboards, metrics, logs, and traces. Our forever-free tier includes access to 10k metrics, 50GB logs, 50GB traces and more. We also have plans for every use case.