Unlocking the full potential of monitoring through ML integration, anomaly detection, and innovative scoring engines. Machine Learning has been making waves in various industries, but its adoption in the monitoring and observability space has been slower than expected. Many “ML” features remain gimmicky and do not provide actual real world value to users that encourages their further use.
So, you think you monitor your infra? As humanity increasingly relies on technology, the need for reliable and efficient infrastructure monitoring solutions has never been greater. However, most businesses don't take this seriously. They make poor choices that soon trap their best talent, the people who should be propelling them ahead of their competition.
Another release of the Netdata Monitoring solution is here!
The mem.kernel chart in Netdata provides insight into the memory usage of various kernel subsystems and mechanisms. By understanding these dimensions and their technical details, you can monitor your system's kernel memory usage and identify potential issues or inefficiencies. Monitoring these dimensions can help you ensure that your system is running efficiently and provide valuable insights into the performance of your kernel and memory subsystem.
Netdata provides a comprehensive set of charts that can help you understand the workload, performance, utilization, saturation, latency, responsiveness, and maintenance activities of your disks. In this blog we will focus on monitoring disks as block devices, not as filesystems or mount points. The Disks section in the Overview tab contains all the charts that are mentioned in this blog post.
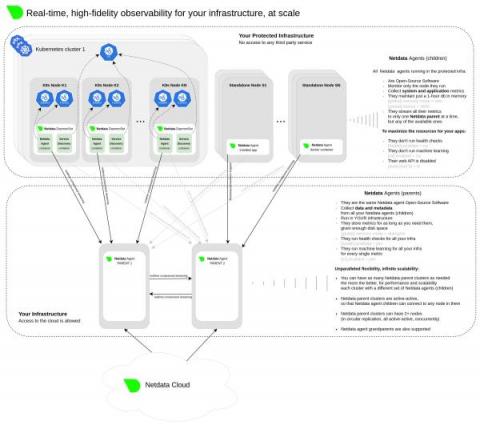
Scalability is crucial for monitoring systems as it ensures that they can accommodate growth, maintain performance, provide flexibility, optimize costs, enhance fault tolerance, and support informed decision-making, all of which are critical for effective infrastructure management.
The different states of system processes are essential to understanding how a computer system works. Each state represents a specific point in a process's life cycle and can impact system performance and stability.
As a system administrator, understanding how your Linux system's CPU is being utilized is crucial for identifying bottlenecks and optimizing performance. In this blog post, we'll dive deep into the world of Linux CPU consumption, load, and pressure, and discuss how to use these metrics effectively to identify issues and improve your system's performance.