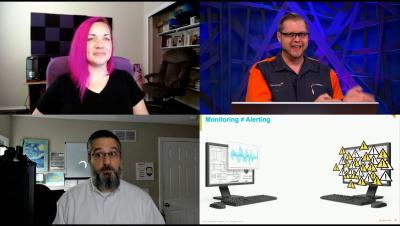
Operations | Monitoring | ITSM | DevOps | Cloud

July 2021

Spring Boot - Monitor your application with OpenTelemetry & SigNoz

In this video, we show a step by step process to monitor your Spring Boot application with OpenTelemetry. We use SigNoz as the backend and visualisation UI. SigNoz is an open source alternative to DataDog, NewRelic, etc. We natively support Opentelemetry based instrumentation. You can instrument any application written in a language/framework supported by OpenTelemetry and visualise metrics and traces in SigNoz.
Featured Post

How You Can Make Your Database More Efficient

Data is the lifeblood of your business, critical to its survival and success. It delivers insights into customers' specific needs, helping you better understand them and deliver a more tailored user experience. With data playing such a key role in whether modern businesses sink or swim, it's vitally important to optimize your database to ensure data is insightful, relevant, and actionable, providing the end user with the best possible experience.

Monitor AWS FSx audit logs with Datadog

Amazon FSx for Windows File Server is a fully managed file storage service built on Windows Server. Migrating on-premise Windows file systems to a managed service like FSx enables organizations to reduce operational overhead and take advantage of the flexibility and scalability of the cloud. But having visibility into file access activity across their environment is key for security and compliance requirements, particularly in sectors such as financial services and healthcare.

What Is Network Latency: Complete Guide on How to Check, Measure and Reduce It to Improve Performance

So you finally launched your service worldwide, great! The next thing you’ll see is thousands and thousands of people flooding into your amazing website from all corners of the world expecting to have the same experience regardless of their location. Here is where things get tricky. Having an infrastructure that will support the expansion of your service across the globe without sacrificing user experience is going to be real though as distance will introduce latency.

Why MSPs Need End-to-End Visibility

The “shared responsibility” model of the cloud puts most of the control with Microsoft, despite the MSP being responsible. As shown below, Microsoft puts very little responsibility into the hands of the customer (or, in your case, the MSP), which is why most MSPs stick to the basic onboarding-related tasks as their Microsoft 365 offering. But the customer’s reliance on Microsoft 365 has changed in the last 14 months… and so have their expectations.

Splunk Machine Learning Toolkit Overview

You no longer have to be a data scientist to bring intelligence to your Splunk data. The Machine Learning Toolkit (MLTK) availble for free on Splunkbase, is a purpose built tool that extends Splunk Processing Language (SPL) with machine learning algorithms, new commands, and powerful visualizations. This video provides a high-level overview of MLTK and preview the use-cases that it supports.

Splunk Mobile - Overview (in 60s)

Splunk Mobile enables you to unlock value from your data anywhere at any time. Regardless of your role or level of technical expertise, you can use Splunk Mobile to view dashboards and take action from your mobile device. Whether you’re a C-suite executive looking for a report, a NOC manager investigating an issue, or a SOC analyst uncovering an anomaly, getting answers has never been more convenient with the power of Splunk in the palm of your hands. Splunk Mobile is made for all organizations and roles, including yours.

Splunk Mobile - Backend Summary (in 60s)

Get to know the Secure Gateway Splunk app, which allows you to deploy and manage your fleet of mobile devices at scale. Plus, take a peek behind the scenes to learn how Splunk Secure Gateway facilitates communication between mobile devices and Splunk platform instances using an end-to-end encrypted cloud service called Spacebridge. Finally, get the latest on Spacebridge compliance and data privacy, since Spacebridge has now been certified to meet SOC2, Type 2 and ISO 27001 standards and is HIPAA and PCI-DSS compliant.

Splunk Cloud Monitoring Console on Mobile (in 60s)

The Cloud Monitoring Console (CMC) lets Splunk Cloud administrators view information about the status and performance of their Splunk Cloud deployment at a glance. On Splunk Mobile, you can access many of the same CMC dashboards as on Splunk Web. Whether you’re interested about your users, indexes, searches, or ingest volume, you can access this data on the go or at the comfort of your own couch.

Splunk On-Call prevents and cuts downtime episode length by half

Your Answer: Escalate the right alerts to the right on-call people for fast collaboration and issue resolution with Splunk On-Call. Reduce burn-out and make on-call suck less with a complete ChatOps experience that's integrated with your IT stack and incident reporting.

News Roundup, July 30, 2021: What's Happening in AIOps, ITOps, and IT Monitoring

Happy System Administrator Appreciation Day! This special day was created in the 1990s to acknowledge and celebrate the tech gurus who assure that our computers, printers, and servers are working and in good condition. So, after thanking your hard-working system admin team, check out the latest in AIOps, ITOps, and IT infrastructure monitoring.

Monitoring serverless applications with AWS CloudWatch alarms

Running any application in production assumes reliable monitoring to be in place and serverless applications are no exception. As modern cloud applications get more and more distributed and complex, the challenge of monitoring availability, performance, and cost get increasingly difficult. Unfortunately there isn’t much offered right out of the box from cloud providers.

DX NetOps Network Monitoring Software Helps Reduce Noise and Increase Efficiency with New Event Filters

DX NetOps 21.2 network monitoring software continues to innovate and improve the scale, speed, and simplicity of network operations with a focused set of high-value features and capabilities. The latest release of Broadcom’s DX NetOps 21.2 network monitoring software delivers expanded capabilities to monitor and assure your software-defined networking (SDN), and network functions virtualization (NFV) deployments.

How to Maximize the Performance of Your Kubernetes Deployment

With Kubernetes emerging as a strong choice for container orchestration for many organizations, monitoring in Kubernetes environments is essential to application performance. Poor application/infrastructure performance impact in the era of cloud computing, as-a-service delivery models is more significant than ever. How many of us today have more than two rideshare apps or more than three food delivery apps?

Announcing our $55M Series C Round Funding to further our storage-less data vision

It’s been an exciting year here at Coralogix. We welcomed our 2,000th customer (more than doubling our customer base) and almost tripled our revenue. We also announced our Series B Funding and started to scale our R&D teams and go-to-market strategy. Most exciting, though, was last September when we launched Streamaⓒ – our stateful streaming analytics pipeline. And the excitement continues!

Webinar: How to Survive in The Ever-Changing IT World

Today's IT world is changing extremely rapidly in terms of technologies used, hardware and software lifecycle management, trends and hypes. All companies within the industry strive to keep pace with these changes – ensure their software is using up to date technologies and finding the best talent experienced with modern technologies. You need to adapt pretty fast so that you can survive.

Logging and Monitoring: A Match Made in Software Heaven

All code and no logging makes your application a black box system. Similarly, all logging and no monitoring makes analyzing performance complicated and inconvenient. The goal is to achieve better visibility into the operations of your application, its status, performance, and overall health. Making this information easily accessible presents more context about the critical incidents and surfaces actionable insights for optimizing performance.

How we're working with the Elastic team to make the Elasticsearch data source for Grafana even more powerful

Back in March, we announced that Grafana Labs was partnering with Elastic to build an official Elasticsearch plugin for Grafana. As our CEO Raj Dutt wrote at the time, our “big tent” philosophy “means that we want to support data sources that our users are passionate about. Elasticsearch is one of the most popular data platforms that can be visualized in Grafana.”

5 Most Common API Errors and How to Fix Them

As software got more complex, more and more software projects rely on API integrations to run. Some of the most common API use cases involve pulling in external data that’s crucial to the function of your application. This includes weather data, financial data, or even syncing with another service your customer wants to share data with. However, the risk with API development lies in the interaction with code you didn’t write—and usually cannot see—that needs debugging.

Rollbar Tip of the Day: Linking to AWS CloudWatch logs from Rollbar

Learn how to link to log data in AWS CloudWatch from Rollbar to help you quickly understand the root cause of an error. Rollbar is the leading continuous code improvement platform that proactively discovers, predicts, and remediates errors with real-time AI-assisted workflows. With Rollbar, developers continually improve their code and constantly innovate rather than spending time monitoring, investigating, and debugging.

Tale of the Beagle (Or It Doesn't Scale-Except When It Does)

If there’s one thing folks working in internet services love saying, it’s: "Yeah, sure, but that won’t scale." It’s an easy complaint to make, but in this post, we’ll walk through building a service using an approach that doesn’t scale in order to learn more about the problem. (And in the process, discovering that it actually did scale much longer than one would expect.)

"Frodo, We Aren't in the Shire Anymore": The Importance of a Customer Journey & How to Avoid Wrecking It

“Frodo, We Aren’t in the Shire Anymore”: The Importance of a Customer Journey & How to Avoid Wrecking It Fans of Lord of the Rings — otherwise known as “Ringers” — never grow weary of reading or watching Frodo and his fellow Hobbits journey through Middle Earth on an epic quest to Mordor (where rumor has it there now exists a very stylish Starbucks at the base of Mount Doom). Well, customers who visit a website are on an important journey as well.

The Top 21 Grafana Dashboards & Visualisations

In our guide on the best Grafana dashboards examples, we wanted to show you some of the best ways you can use Grafana for a variety of different use cases across your organisation. Whether you are a software architect or a lead DevOps engineer, Grafana is used to make analysis and data visualisation far easier to conduct for busy engineering and technical teams throughout the world.

Queryless vs. Query-less. Faster Insights and Better Observer Experience with Span Analytics

In one of my previous blogs I explained how important it is for a modern observability platform to provide “the observers” full, flexible access to all raw telemetry. Observability’s promise to find unknown unknowns relied directly on the ability of fast, powerful and multidimensional high-cardinality analysis of raw data, to uncover previously unknown patterns that have not yet been visualized as a metric, dashboard panel or an alert or anomaly event.

How Log Analytics Powers Cloud Operations, Part II: Use Cases

Cloud computing shapes the ability of enterprises to transform themselves and compete in the 2020s. By renting elastic cloud resources, enterprises can support new customer platforms, distributed workforces, and back-office operations. The cross-functional discipline of CloudOps helps enterprises realize the promise of cloud computing by optimizing applications and infrastructure on cloud platforms.

Announcing the GA of the LogDNA Configuration API and LogDNA Terraform Provider

We’re excited to announce that our Configuration API and Terraform Provider are now generally available for all LogDNA customers. We received tremendous feedback from our public beta release and, based on that feedback, we are enabling several new features with the GA release that allow for more programmatic workflows with LogDNA. First, we are enabling Preset Alerts as a new resource that can be configured with the configuration API as well as within Terraform.

Boosting performance with network monitoring solutions

Technological advances and emerging networking concepts are constantly shaping our IT infrastructure. Networks are no longer limited to traditional networking constraints such as its static nature, but are continually evolving to improve efficiency by spanning across wired, wireless, virtual, and hybrid IT environments. This IT evolution drives organizations to advance digitally and support computational requirements to meet their business objectives.

Use Datadog Session Replay to view real-time user journeys

When developing large, customer-facing applications, it’s paramount to have visibility into real user behavior in order to optimize your UX. Without a direct view into what users are actually doing when navigating your app, it can be difficult to reproduce bugs and understand how aspects of your frontend design are causing user frustration and churn. With Datadog RUM’s Session Replay feature, currently available in beta, you can watch individual user sessions using a video-like interface.

NiCE Log File Monitor Management Pack 2.0 for Microsoft SCOM

The NiCE Log File Monitor Management Pack 2.0 is a FREE solution supporting the SCOM Community in next-level log file analysis. It helps IT performance and security data analysts identify errors causing transactions and queries to take too long or not run at all. Software-related bugs, security issues, or erroneous configurations that impact website or application performance are figured out quickly by employing improved templates for alert rules, performance rules, or monitors.

Logz.io Delivers Cloud Native Monitoring to the Azure Marketplace

Logz.io is proud to launch a new partnership with Microsoft that enables Azure customers to directly integrate with Logz.io’s platform from within the Azure Console. This integration importantly allows Azure developers to begin monitoring their workloads faster than ever before, using the open-source technologies that their teams love. Check out this video for a demonstration of how it works.

Integrating Logz.io with Azure

Azure users can now deploy the Logz.io platform directly from the Azure Console with the click of a button. The seamless integration between Azure and Logz.io delivers visibility and monitoring for enterprise organizations developing applications on Azure, providing the specific information needed to streamline code development and achieve business agility.

Grafana Labs joins the CNCF Governing Board as a Platinum member of the open source foundation

At Grafana Labs, we are proud to be one of the largest code contributors to Cloud Native Computing Foundation projects. We are currently the leading company contributor to Prometheus, and also make substantial contributions to Cortex, Thanos, Jaeger, and OpenTelemetry. Our own open source projects — Grafana, Grafana Loki, and Grafana Tempo — have also become fundamental parts of the cloud native ecosystem.

Introducing the New Rollbar Integration for GitHub Enterprise Server

We’re excited to launch our new integration with GitHub that supports GitHub Enterprise Server customers. This allows companies using GitHub Enterprise on their own domains to access key features in Rollbar that help developers fix errors faster. GitHub Enterprise offers a fully integrated development platform for organizations to accelerate software innovation and secure delivery. With Rollbar, GitHub Enterprise Server customers can now access.

How Cox Automotive's IT Operations Team Relies On Monitoring To Help Bring 27 Company Brands and Over 700 Applications Under One Roof

Cox Automotive is a global company with over 40,000 auto dealer clients across five continents. The company, which houses Kelly Blue Book, Autotrader, and 25 other brands, was built through acquisitions. Its IT Operations team is tasked with bringing them together under the Cox Automotive umbrella and ensuring “a good, consistent experience” for its customers worldwide.

Releasing Icinga Web v2.9.2

Today we’re announcing the general availability of Icinga Web v2.7.6, v2.8.4 and v2.9.2. All are standard bugfix releases and include fixes found by the community since the latest releases. You can find all issues related to this release on our Roadmap. Please make sure to also check the respective upgrading section in the documentation. This release is accompanied by the minor releases v2.7.6 and v2.8.4 which include the fix for the flattened custom variables.

Monitoring Kubernetes the Elastic way using Filebeat and Metricbeat

In my previous blog post, I demonstrated how to use Prometheus and Fluentd with the Elastic Stack to monitor Kubernetes. That’s a good option if you’re already using those open source-based monitoring tools in your organization. But, if you’re new to Kubernetes monitoring, or want to take full advantage of Elastic Observability, there is an easier and more comprehensive way. In this blog, we will explore how to monitor Kubernetes the Elastic way: using Filebeat and Metricbeat.

How to monitor Cassandra database clusters

Apache Cassandra is an open-source distributed NoSQL database management system that was released by Facebook almost 12 years ago. It’s designed to handle vast amounts of data, with high availability and no single point of failure. It is a wide-column store, meaning that it organizes related facts into columns. Columns are grouped into “column families.” The benefit is that you can manage data that just won’t fit on one computer.

Test internal applications with Datadog's testing tunnel and private locations

As part of your monitoring and testing strategy, you may run tests on different types of applications that are not publicly available—from local versions of production-level websites to internal applications that directly support your employees. Testing each one requires leveraging tools that allow you to verify functionality across a wide range of devices, browsers, and workflows while maintaining a secure environment.

Monitor your CI pipelines and tests with Datadog CI Visibility

Datadog CI Visibility, now available in beta, provides critical visibility into your organization’s CI/CD workflows. CI Visibility complements Datadog’s turn-key CI provider integrations and the integration of synthetic tests in CI pipelines to give you deep insight into key pipeline metrics and help you identify issues with your builds and testing.

Proactive VPN Monitoring for the Hybrid Workforce

A VPN, allows remote employees to create a secure traffic connection to the corporate network. These connections essentially tunnel from a computer or mobile device through a VPN server, often through the public Internet. VPN technology has been around since the mid-1990s, but its usage is now going mainstream due to Covid. As Covid accelerates, it means new monitoring challenges for IT amid a high VPN adoption.

Scout APM Announces Python Application Support for Error Monitoring Tool

Traditionally an APM tool, Scout has expanded its service offerings to now include error monitoring of Python web applications for more cohesive and actionable observability insights within a single platform. This new feature supports an overall better user experience by eliminating the need for multiple web-application monitoring services; Scout APM with Scout Error Monitoring offers performance and error insight and alerting within a single, integrated dashboard.

5 Ways to Get Valuable Insight From Your AWS Bill

Did you know that Virtana Optimize’s Bill Analysis tool shows you not just the services currently monitored by Virtana but all services to deliver an overall view of your AWS cost? And if you’ve set up and configured consolidated billing to link multiple AWS accounts, you can include data from all those accounts in that view. You can even add multiple billing orgs to the same Virtana Optimize account.

How to Monitor Microsoft OneDrive for Business

Exoprise supports Microsoft 365 OneDrive monitoring similar to SharePoint with OAuth credentials as well as full experience monitoring via a headless browser. The sensor emulates a real user signing into OneDrive to collect end-to-end performance metrics such as health score, server latency, login times, etc. across the infrastructure and measure optimal availability.

Learn how to use the Jira, ServiceNow, GitHub, and GitLab plugins for Grafana for better visibility into software development

GitHub, GitLab, Jira, and ServiceNow are some of the most popular software development tools out there, and Grafana has powerful integrations with each of them. Join us for a live webinar on July 29 at 9:30 PT / 12:30 ET / 16:30 UTC for a demo of these data source plugins and best practices for creating a single pane of glass for viewing your software operations metrics. You can register here.

Instrumenting Our Frontend Test Suite (...and fixing what we found)

Here at Sentry, we like to dogfood our product as much as possible. Sometimes, it results in unusual applications of our product and sometimes these unusual applications pay off in a meaningful way. In this blog post, we’ll examine one such case where we use the Sentry JavaScript SDK to instrument Jest (which runs our frontend test suite) and how we addressed the issues that we found.

Developer's Dilemma: When Is the Right Time to Invest in Log Management

Development cycles are complicated. If you’re on a development team, whether you’re building out a custom application, maintaining and iterating on a growing microservice, or breaking ground on a new platform for a startup, you have your hands full. Log management, though seldom celebrated outside hardcore DevOps and IT circles, is still a well-known instrument among seasoned developers. It is insight into the internal workings of your processes as they are used.

Server Performance Guide: Key Metrics and How to Optimize

Everybody hates it when they have to wait for an application to load—or when an application doesn’t load at all. And if this happens with your application, you’re not just losing business but also losing brand value. Most applications today are online. So servers play a crucial role in keeping applications up and running. Application performance is directly proportional to server performance. Hence, it’s very important to monitor and improve server performance.

Listening to the Hype: OpsRamp featured in eight Gartner Hype Cycles

July is Hype Cycle season, the time of year when Gartner livens up the summer doldrums by updating its eagerly awaited Hype Cycle series of reports. This year’s Hype Cycles demonstrated OpsRamp’s growing brand recognition as we were listed as a representative vendor in eight different Gartner Hype Cycles.

2 Steps V6 - New Features

Check out how 2 Steps can now match elements as well as visual recognition. Add custom Javascript and build synthetic transactions even faster than before. 2 Steps now supports “element matching” as an alternative to image matching in Chrome tests. This major new functionality allows 2 Steps to handle many previously difficult scenarios, for example when the target of a command is pushed off the bottom of the screen or hidden by a popup, or when a style update changes the appearance of a button.

2 Steps v6 Demo

Agentless Synthetic Monitoring. Purpose-built for Splunk. Create active monitoring tests in minutes for Web, Windows, Mobile, Citrix and more in minutes. Watch the latest features in the v6 release in action. 2 Steps now supports “element matching” as an alternative to image matching in Chrome tests. This major new functionality allows 2 Steps to handle many previously difficult scenarios, for example when the target of a command is pushed off the bottom of the screen or hidden by a popup, or when a style update changes the appearance of a button.

JavaScript Logging Basic Tips

In the past few years, JavaScript has evolved in several ways and has come a long way. With the evolving technology, machines are becoming more powerful, and browsers are getting more robust and compatible. In addition, Node.js’s recent development for JavaScript’s execution on servers, JavaScript has been getting more and more popular than ever before.

How to Ensure Patch Compliance

Patch compliance indicates the number of compliant devices in your network. This means the number of computers that have been patched or remediated against security threats effectively. The distribution and deployment of patches accomplish nothing if your devices are not compliant. So to establish a good patch management strategy, it is important to pay attention to the effectiveness and reach of your patch deployment activities.

Getting over on-call anxiety

You've joined a company, or worked there a little while, and you've just now realised that you'll have to do on-call. You feel like you don't know much about how everything fits together, how are you supposed to fix it at 2am when you get paged? So you're a little nervous. Understandable. Here are a few tips to help you become less nervous.

Get comprehensive monitoring for your Apache Kafka ecosystem instances quickly with Grafana Cloud

We are happy to announce that the Kafka integration is available for Grafana Cloud, our composable observability platform bringing together metrics, logs, and traces with Grafana. Apache Kafka is an open source distributed event streaming platform that provides high-performance data pipelines, streaming analytics, data integration, and mission-critical applications.

5 Key Considerations When Choosing a Log Management Solution

Purchase decisions often begin with a price check. Log management is no different. Evaluate your budget and narrow down the options that fit to choose the tool that gives you the most for what you pay. As always, cheaper is better as long as the platform doesn’t cut any corners. But with log management, there is a catch – not all tools are transparent with their pricing model.

Back to the (Monitoring) Basics | An IT Journey to Monitoring Glory: Session 1

Let’s start by going back to the basics of monitoring. Whether you’re new to monitoring or looking for a refresher, there’ll be something for everyone. The presenters will bring their experience monitoring small, to large, to hybrid, and beyond environments. Join the live chat to ask questions of the presenters and offer other attendees your own tips for ramping up on monitoring.

How to Monitor Microsoft Azure Active Directory (Azure AD)

Monitor Microsoft 365 Azure Active Directory (AAD) with Exoprise CloudReady. AAD is an enterprise multi-tenant cloud directory and identity management service. In your business, employees who work from home remotely or the office rely on Azure AD to log in to multiple Office 365 services and access them through a single set of cloud credentials.

How To - Push Device Configuration Changes

Fastest time-to-value and lowest TCO (total cost of ownership) are among the top 10 reasons that customers choose, love and continue using Netreo. Turning time-consuming administrative projects into simple tasks is one way Netreo consistently delivers superior value. But like all software solutions in use today, many Netreo features go unused or misunderstood by too many customers and would-be users.

10x development speed with local serverless debugging

In this article you’ll find out how to 10x your development speed with local serverless debugging. Questions such as “what happens when you scale your application into millions of requests?”, “what to expect when going serverless?”, “how does it look like?”, or “how is it to build applications on serverless and work locally?” will be addressed.

How Much Does a Digital Experience Leader Make in IT?

Have you ever tried to search for a leadership position in IT that’s dedicated exclusively to employee experience, sometimes listed as end user experience or Digital Employee Experience (DEX)? I’m not talking about a CXO (Chief Experience Officer) role outside of IT—that position is usually advertised for customer experience or employee communications and human resources. I’m talking strictly enterprise IT.

The Benefits of Centralized Log Management and Analysis

Log centralization is kind of like brushing your teeth: everyone tells you to do it. But until you step back and think about it, you might not appreciate why doing it is so important. If you’ve ever wondered why, exactly, teams benefit from centralized logging and analysis, keep reading. This article walks through five key advantages of log centralization for IT teams and the businesses they support.

How to Reduce Alert Fatigue: Preventing Noisy Alerts and Error Messages

Monitoring solutions are a vital component in managing an application’s environment. From the systems layer all the way up to the end user’s connection to the app, you want to find out how the platform is performing. Indicators like CPU, memory, the number of connections, and overall health help teams make informed decisions for guaranteeing uptime. Teams monitor metrics (short-term information) and logs (long-term information) mainly from a reactive perspective.

How to Notify Your Team of Errors: Email vs. Slack vs. PagerDuty

Site Reliability Engineering (SRE) and Operations (Ops) teams heavily rely on notifications. We use them to know what’s going on with application workloads and how applications are performing. Notifications are critical to ensuring SREs and Ops teams can resolve errors and reduce downtime. They’re also crucial when monitoring environments — not only when running in production but also during the dev-test or staging phase.

Cleaning House - How One IT Team Saved $1.8M on SaaS Licensing

I recently spoke to the IT Director and Head of End User Computing at a leading healthcare company who implemented Salesforce globally across their entire employee user base 9 months ago (before later becoming a Nexthink customer). She told me their Salesforce licensing model was similar to others you’ll see in market: a set of base licenses and then selected add-ons based on employee roles – with some at no charge and others priced ala carte. Her problem? License metering.

Accelerating Code Quality with DORA Metrics

What do Google’s DevOps Research and Assessment (DORA) and Rollbar have to do with each other? DORA identified four key metrics to measure DevOps performance and identified four levels of DevOps performance from Low to Elite. One way for a team to become an Elite DevOps performer is by focusing on Continuous Code Improvement.

How Grafana helps organizations manage SLOs across multiple monitoring data sources

“SLO is a favorite word of SREs,” Grafana Labs Principal Software Engineer Björn “Beorn” Rabenstein said during his talk at KubeCon + CloudNativeCon NA 2019. “Of course, it’s also great for design decisions, to set the right goals, and to set alerting in the right way. It’s everything that is good.” So what happens when things go bad?

With Splunk Synthetic Monitoring, proactively find and fix your user experience issues

Trend, visualize, and improve performance of all your page resources and third party dependencies. Detect and resolve issues faster across your critical user flows, business transactions and API endpoints using Splunk Synthetic Monitoring.

How to Troubleshoot Network Routing and Connectivity in Your AWS Environment

Your public cloud can seem like a “black box.” And when there’s a cloud networking problem, it can be tough to identify and fix it fast. Join Kentik Cloud expert, Dan Rohan, as he demonstrates how Kentik Cloud helps you proactively see and troubleshoot AWS network routing and connectivity issues quickly. What You'll Learn -- Kentik product manager Dan Rohan discusses: During in-product demonstrations, Dan shows.

SAN Performance Monitoring

A Storage Area Network (SAN) is a specialized, high-speed network that provides block-level network access to storage. SANs are typically composed of hosts, switches, storage elements, and storage devices that are interconnected using a variety of technologies, topologies, and protocols. Each computer on the network can access storage on the SAN as if they are local disks connected directly to the computer.

Comparison N-Able vs Kaseya vs Pandora FMS: Fight !!!

Lemons, oranges, grapefruits, limes… We know that they are not the same, but if necessary, you can make juice with all of them. And yes, we can and we will. We are in summer and it makes you want to make a good cocktail, doesn’t it? Today, in PFMS blog, we are going to analyze the commonalities of N-Able (Solarwinds MSP), Kaseya and Pandora FMS. Also their -remarkable- differences of course.

Analyzing Office 365 GCC Data With Sumo Logic

Many of our customers today leverage Office 365 GCC High, including organizations looking to meet evolving requirements for working with the United States Department of Defense. Sumo Logic enables customers to leverage our out-of-the-box monitoring and analytics capabilities to analyze Office 365 GCC High data to offer security engineers and security analysts stronger situational awareness of internal employee data.

Top 5 Web Application Monitoring Tools You Should Know

Web application monitoring tools can keep your business afloat. Period.  Imagine this. You’re about to run a crucial end-of-season sale on your website. You’ve sent your emails, run social media campaigns, paid for advertisements, and stocked up your inventory; you are all set to let the cash register ring.  However, on D-day, your website goes down. It’s unable to handle the incoming traffic or is simply down because of technical glitches.

A Step By Step Guide to Tomcat Performance Monitoring

Application server monitoring metrics and runtime characteristics are essential for the applications running on each server. Additionally, monitoring prevents or resolves potential issues in a timely manner. As far as Java applications go, Apache Tomcat is one of the most commonly used servers. Tomcat performance monitoring can be done with JMX beans or a monitoring tool such as MoSKito or JavaMelody.

Troubleshoot faster with process-level app and network data

When responding to an incident, you need to quickly find the scope of the issue so you know which teams to notify and which parts of your system to investigate next—before your end users are affected. But as multiple processes use resources on each of your hosts, and interact in unexpected ways, it can be difficult to know exactly what is causing an issue—especially if those processes are running off-the-shelf software.

eG Enterprise, the virtual assistant that every Citrix Admin needs

eG Enterprise is the virtual assistant, who’ll make your life a whole lot easier. Just like Siri and Alexa, eG will proactively monitor your IT & applications. Wouldn’t you want to know what these extra sets of hands can deliver? Watch this short video to know how automatic root-cause diagnosis tech, Citrix service topology views, synthetic & real user monitoring capabilities, and machine learning and auto-baselining tech enable you to be the IT hero among your peers, colleagues, and the management.

Introduction to Custom Metrics in Python with the Logz.io RemoteWrite SDK

We just announced the creation of a new RemoteWrite SDK to support custom metrics from applications using several different languages. This tutorial will give a quick rundown of how to use the Python SDK. Using these integrations, Prometheus users can send metrics directly to Logz.io using the RemoteWrite protocol without sending them to Prometheus first. Each SDK, while for a separate language, is each capable of working with frameworks like Thanos, Cortex, and of course M3DB.

Announcing the RemoteWrite SDK for Custom Metrics in Python, Go & More

We’re proud to announce the creation of a new RemoteWrite SDK to support custom metrics from applications using Golang (Go), Python, and Java, with many more on the way. Each SDK will have automatic, continuous deployment of updates. Using these integrations, Prometheus users can send metrics directly to Logz.io using the RemoteWrite protocol without sending them to Prometheus first.

Grafana Labs welcomes the Pace.dev team, experts in building tools with great developer experience

As we look to the future of Grafana Labs and our products, we are keen to expand the ways in which we can help engineering teams build, maintain, and operate great software. We believe we can only achieve this by paying careful attention to the developer experience and the challenges faced in the real world of engineering.

PD Summit21: Sentry: Alert with Precision and Context Using Sentry + PagerDuty

Phillip Jones (Product Manager, Sentry) and Michael Aravopoulos (Solutions Consultant, PagerDuty) discover and triage their way through production errors using the new PagerDuty + Sentry integration. In this session, we will implement the PagerDuty integration and investigate low & high urgency error alerts.

PD Summit21: Sumo Logic: Streamline Incident Management to Drive Application Modernization

As application modernization drives an increase in complexity, managing the signals they generate becomes increasingly important in order to manage alert fatigue, mantain reliability, and accelerate innovation. Sumo Logic provides a unique, two-way integration with PagerDuty that collects incident messages from PagerDuty and populates pre-configured dashboards to provide a complete view of their alerts by displaying top incidents, escalations, teams and urgency, as well as providing the capability for users to send notifications to PagerDuty when critical conditions in their applications or infrastructure are detected in Sumo Logic.

Prioritize and resolve performance defects with Splunk Web Optimization

Find, fix and prevent web performance issues with an intelligent optimization engine. From Google's Lighthouse scores to core web vitals and 50+ modern performance metrics, learn to benchmark and improve page performance and user-experience with Splunk Web Optimization. Get a free trial as part of Splunk Synthetic Monitoring today.

Detect any issue with Splunk APM before it turns into a customer problem

With 100% of spans and traces captured, Splunk APM meets any necessary business KPI’s and SLO metrics while investigating and troubleshooting transaction errors related to a backend application. Easily construct error budgets that measure performance of services today - learn how with this free trial Splunk Observability Cloud.

Trending: A Seismic Shift in the Way We Present your Data

Eagle-eyed RapidSpike users will have noticed a big update to the app went live recently, with a major improvement to our Page Overview dashboard . Going back to September 2020, when we launched “RapidSpike Version 2” , we had great plans for the Page Overview – but they never quite materialised. Team efforts were focussed elsewhere and we did little to improve the old Page Overview or the data we displayed.

Contextual Information: The Missing Piece in The AIOps Puzzle and How to Fix It

AIOps as a function is steadily gaining popularity, even climbing the Gartner Hype Cycle. Today’s observability tools go beyond merely monitoring to perform proactive remediation of events and incidents. However, what many of them lack is context. For instance, consider a regular AIOps solution that identifies an anomaly in system behavior. It will raise an alarm and a remediation workflow will do its job.

Citrix Tips for Troubleshooting

I recently saw a user asking on EUC Slack “is there a Domain controller response time in ?”. Unfortunately for him, his choice of monitoring product doesn’t include such metrics. However, it did make me wonder if Citrix admins are aware of the importance of getting metrics about Domain Controllers, simply because many EUC monitoring tools fail to monitor them.

How Vanguard used Observability to Accelerate and De-risk their Cloud Migration

Rich Anakor, chief solutions architect at Vanguard, is on a small team with a big goal: Give Vanguard customers a better experience by enabling internal engineering teams to better understand their massively complex production environment—and to do that quickly across the entire organization, in the notoriously slow-moving financial services industry. They also had a big problem: The production environment itself.

Monitoring and Alerting 101: Monitoring Best Practices

An effective monitoring system is paramount to smooth business operations. As the need for a fast, responsive software experience gains momentum, monitoring becomes an indispensable driving force. Monitoring systems enable IT teams to proactively observe the health and responsiveness of critical environments and applications. Without monitoring, organizations must depend on customers or internal departments to receive notice of system issues.

Optimize Value of Cloudtrail Logs With Infrequent Tier

A common scenario for log analytics is that many log events are high value for real time analytics, but there are also events that are low value for analytics, but account for a very large percentage of overall log volume. Often these same low value logs are used only for ad-hoc investigations from time to time or need to be retained for audit purposes.

Understanding IIS Log Files: Operating Instructions

Commonly, your website or app functions perfectly until you release it. During testing, you might seem to have control over everything. But, sooner or later, you will face some challenges. In fact, it is totally normal when something goes wrong. The most important thing is how you settle these problems. In most cases, issues with availability alerts and users’ complaints can be addressed by the means of IIS logs. IIS logging will provide you with the necessary data to deal with a breakdown.

Introducing multi-factor authentication in Datadog Synthetic tests

Multi-factor authentication (MFA) is an increasingly popular method for securing user accounts that requires users to provide two or more pieces of identifying information when logging into an application. This information can consist of unique verification links or codes sent to the user’s phone or email address, as well as time-based one-time passwords (TOTPs) generated by authenticator applications or hardware.

Sponsored Post

Webinar featuring IDC's Mark Leary: Make your IT operations future-proof with the Branch of One architecture

At the start of the pandemic, IT organizations had to undergo radical changes to support remote work. Given the urgency to shift to remote operations, IT admins opted for band-aid solutions to retain business continuity and stay connected to the core of their networks from remote locations. But now, many organizations are moving toward hybrid workforce options with employees choosing to work from both their home and office locations.

Apache Monitoring: Best Tools and Key Metrics to Track Web Server Performance

The Apache HTTP Server (httpd) is a widely used, open-source web server application. Because you can easily customize it through modules, it has become the go-to choice of both individuals powering their personal blogs and enterprises running high-traffic websites and web apps. It’s a well-known fact that with high traffic, the performance of Apache web servers can take a hit, experiencing bottlenecks as your traffic scales up, which will lead to delayed responses.

What's the Difference between Observability and Monitoring?

Wondering what the difference is between observability and monitoring? In this post, we explain how they are related, why they are important, and some suggested tools that can help. The difference between observability and monitoring is that observability is the ability to understand a system’s state from its outputs, often referred to as understanding the “unknown unknowns”.

A Complete Guide to Understand HTTP Status Codes

whenever we go to a website, whether it's an online store to buy clothes or to check the status of our bank account, we need to type the URL into the browser. When you click on the relevant page, a request is sent to the server, and the server always responds with the HTTP three-digit code. This HTTP status code tells us if our request was successfully completed or whether there was an error that prevented the server from serving the content that users or visitors were trying to access.

Dissecting DevOps - Code-to-Cloud Visibility: The Framework for DevOps Success

Recording from the DevOps.com webinar Code-To-Cloud Visibility where Splunker Chris Riley covers the key concepts to maintain visibility from the point a feature is defined to the point that feature runs in production. Learn about the practices of DevSecOps, Pipeline Analytics, and Observability. And why a Code-To-Cloud strategy is necessary to support and accelerate Cloud and DevOps transformation.

Assessing the Quality of Service from ISPs

Before you can achieve access to any cloud service a connection to the internet is required. Sounds simple enough, however, the challenge lies not only with the internet connection itself, but the provider of the service as well. Not all internet service providers (ISPs) and pathways to the internet are created equally which makes assessing and understanding the quality of the service you’re on a critical step toward maintaining business productivity.

Five Problems Your Current Network Monitoring Can't Solve but Network Observability Can

Public and hybrid cloud has led to a new era of agility, scale and performance, particularly for the networking that underlies enterprise applications. Yet, more than 80% say their network monitoring hasn’t kept up with major problems that need to be solved. A new approach is required – it’s network observability. Join Kentik co-founder and CEO Avi Freedman as he discusses how to reduce networking issues and risks while continuing to allow your organization to innovate at the speed of cloud.

Why You Should Stop Hoarding Metrics

Serverless lets you deploy applications far away in a data center of a cloud provider. This relieves you of the lion’s share of operational burdens. The more you buy into your cloud provider’s ecosystem, the less you have to do yourself: no more OS updates or database bugfix installations. But you still need to do some operation-related work on your own. For instance, monitoring your application to know what’s going on in that far away data center.

How to Instrument a Java App Running in Amazon EKS

As we start to see big moves from monolith deployments to microservices, the adoption of Kubernetes has become top of mind for many SREs. Organizations can leverage the open-source system to automate deployments, scale, and manage containers, making Kubernetes one of the primary solutions for delivering workloads. However, maintaining the system can be difficult and, in some cases, overwhelming.

Latest Cisco AppDynamics App Attention Index Reveals Brands Have Only One Shot to Win Over Customers

Cisco AppDynamics today released the latest report in its App Attention Index research series, revealing consumer reliance on applications and digital services has soared since the start of the COVID-19 pandemic.

Web Experience Monitoring for End-Users

Exploring the Internet and accessing SaaS applications via a web browser such as Google Chrome, Firefox, or Microsoft Edge is commonplace today. At times, end-users visiting apps through multiple channels face performance issues of slow Wi-Fi (Network) speed, increased page response times (TTFB), and long page load times resulting in end-user dissatisfaction and frustration.

How to mitigate DevOps tool sprawl in enterprise organizations

There’s an insidious disease increasingly afflicting DevOps teams. It begins innocuously. A team member suggests adding a new logging tool. The senior dev decides to upgrade the tooling. Then it bites. You’re spending more time navigating between windows than writing code. You’re scared to make an upgrade because it might break the toolchain. The disease is tool sprawl.

How Pernod Ricard uses Grafana and Loki to scale and monitor its global e-commerce business

Pernod Ricard is the toast of the wine and spirits industry, with a comprehensive portfolio that includes brands such as Jameson, Absolut Vodka, and Havana Club. While the $53 billion company has thrived on traditional distribution channels such as restaurants, clubs, stores, and duty-free shops, Pernod Ricard has recently focused on growing its direct-to-consumer (D2C) e-commerce business.

Observability for Retail: Top 3 Challenges and How Monitoring Can Help

The pandemic has created a unique set of circumstances that have accelerated what was already a growing trend. The shift from brick and mortar retail to a hybrid online and in-person retail experience has meant that nearly every retailer must also be an e-tailer and deliver a flawless digital shopping experience for its customers.

Dissecting DevOps - Measuring quality in a SaaS world: SLA, SLI, SLO

Now that software is delivered over the web and not in a box, how developers guarantee quality to their users has radically changed. Users do not care about version numbers or floppy disks. They just want access to a service that just works. In the microservices world, the quality of your service both to your internal users and external is measured by SLAs, SLIs, and SLOs. And how you decide what those metrics are is a key strategy.

The Ops Agent is now GA and it leverages OpenTelemetry

Running and troubleshooting production services requires deep visibility into your applications and infrastructure. While basic logs and metrics are available out of the box with Google Cloud Compute Engine (GCE), capturing advanced data used to require the installation of both a metrics agent and a logging agent.

Finding Unexpected Development Solutions Through Log Management

This is a personal story from before I worked at observIQ. I am not a technical person in any professional sense. I have no direct training and my coding experience is limited to front-end web design and some indie game development. Before observIQ, all I knew about log management was that it has something to do with tracking computer performance and behavior, and I associated it mostly with DevOps and the cloud. I never imagined it would play any valuable role in my professional endeavors.

Django SDK Setup

Configure your Django project with Rollbar easily! Rollbar is the leading continuous code improvement platform that proactively discovers, predicts, and remediates errors with real-time AI-assisted workflows. With Rollbar, developers continually improve their code and constantly innovate rather than spending time monitoring, investigating, and debugging.

Continue to monitor your Citrix NetScalers after December 2021 with SCOM

As you might know, all Citrix Application Delivery Controller (ADC/NetScaler) 11.x versions will be End of Life after 31-Dec-2021. Make sure you have these business critical systems upgraded to at least 12.1 before this date, to be able to get the latest updates and keep protected from exploits and hacks making use of any vulnerabilities.

The Secret to a Successful Hybrid Application Migration

Planning a hybrid application migration? There’s plenty to deal with already, and now your manager wants to know—how are you going to make sure that the migration is a success? The secret is to take a subjective judgment and turn it into an objective one. As you probably know, there is no way that you can guarantee a problem-free migration. Don’t leave it up solely to how your boss or anyone else feels about the migration.

Best Practices for Infrastructure Management and Monitoring

A well-functioning IT infrastructure and application fleet is one of the core elements to powering a successful modern business. But how can we ensure it’s indeed well-functioning? Continuous monitoring is one of the methods to ensure an infrastructure setup is managed successfully.

The Secret to a Successful Hybrid Application Migration

Planning a hybrid application migration? There’s plenty to deal with already, and now your manager wants to know—how are you going to make sure that the migration is a success? The secret is to take a subjective judgment and turn it into an objective one. As you probably know, there is no way that you can guarantee a problem-free migration. Don’t leave it up solely to how your boss or anyone else feels about the migration.

What Is Network Management? A Comprehensive Introduction

Network management is the process that helps you know the working state of your network. It also enables you to fix various discovered or undiscovered network problems. In today’s networks, it’s a complicated exercise to monitor and maintain how well your network is functioning. Network management involves so many different components that you need the right people, technologies, and tools to do it well.

Taking Inventory of Your Google Cloud

Splunk Cloud Architect Paul Davies recently authored and released the GCP Application Template, a blueprint of visualizations, reports, and searches focused on Google Cloud use cases. Many of the reports included in his application require Google Cloud asset inventory data to be periodically generated and sent into Splunk. But HOW exactly do you craft that inventory generation pipeline so you can "light-up" Paul's application dashboards and reports?

Introducing InfluxData Support

When learning a new technology stack or language, access to good documentation, tutorials, and support is critical to lower the barrier to adoption and enable users to take advantage of the tools themselves. At InfluxData, we support our users by providing the following resources. Searching through all of these resources and more, like GitHub issues, can be time-consuming and difficult. In response, the support team at InfluxData has recently created InfluxData Support.

Glossary of IT Monitoring and Management Terms

Due to innovations in technology and automation, technology keeps changing and transforming with time. IT monitoring and management is an important aspect of all organizations regardless of their size, location, or workload. When it comes to IT processes, issues and protocols, all concepts are universal and face similar issues everywhere. This IT management terms or IT monitoring terms glossary brings together numerous IT components, issues, protocols and processes.

VMware: ESXi Metrics You Should Monitor

Virtualization environments of today are mostly driven by VMware due to its stability, scalability, and power. Aside from the configuration and architecture design, one must also consider the performance of the physical layer, hosted applications, and virtual machines. VMware provides tools that help monitor your virtual environment and find out the source of existing and potential issues.

Error Management in Node.js Applications

No one is perfect in this world including machines. None of our days pass without having errors faced in our professional life. Whenever we are facing any issues/errors while working rather than worrying, let us all fix our mind like we are going to learn something new. This will make your tasks easier. One of our friend Error Handling will help us in fighting with these errors. These reduce our pressure by finding the errors and guide us to achieve the desired output.

A Guide to Monitoring AWS Lambda Metrics with Prometheus & Logz.io

In this post we will discuss some key considerations and strategies to monitor your AWS Lambda functions. This will include: which Lambda metrics you’ll want to monitor, how to collect AWS Lambda metrics with Prometheus and Logz.io, how to create a monitoring dashboard with alerts, and how to search and visualize your metrics.

Dashboarding Enterprise IT Tools with PowerShell

SquaredUp’s PowerShell visualizations provide limitless extensibility when it comes to visualizing your data. You can connect, manipulate, correlate, calculate, and visualize any data set from any tool into compelling metrics; but did you know you can also load third party PowerShell modules, compare metrics from SCOM and other data sources on the fly, visualize log files, connect to any database, and much more?

IoT at your home, work, or data center with Prometheus metrics and Grafana Cloud

We recently had a hackathon at Grafana Labs. Anyone who wanted could get several work days without normal responsibilities to do whatever they found meaningful in the wider Grafana community and/or Grafana Labs commercial offerings. This allowed me to invest some time into Kraken, a project designed for reading out different sensors, and to update it for modern hardware and libraries.

Why Open Source Histograms Are The Future of Telemetry Monitoring

Latency measurements have become an important part of IT infrastructure and application monitoring. The latencies of a wide variety of events like requests, function calls, garbage collection, disk IO, system-call, CPU scheduling, etc. are of great interest to engineers operating and developing IT systems. But there are a number of technical challenges associated with managing and analyzing latency data.

Monitoring Could Prove to Be a Lifesaver for the Public Sector

One of the business consequences from the pandemic—increased remote working—is causing technology challenges across most industries, including the public sector. The pandemic interrupted “business as usual” and caused a spike in the need to work remotely. As a result, applications organizations once took for granted consequently became mission critical.

Graylog Illuminate: Getting Started with Sysmon

The Windows System Monitor (Sysmon) is one of the chattiest tools. With all the information coming in, it can be difficult and expensive to use it efficiently. However, the Graylog Illuminate package gives you a way to fine-tune it so that you can get better data and manage your ingestion rate better. Sysmon gives you awareness of what’s going on in your endpoints.

Best Website Monitoring Tools to Use in 2021 (Free and Paid)

A website is an essential part of your organization’s online presence, and it’s crucial to attract, engage, and convert visitors into customers. Accordingly, the imperative is to maintain a reliable website capable of loading quickly and offering a seamless experience to its visitors. Otherwise, a suboptimally maintained website can badly affect user engagement, deteriorate reputation, and lead to revenue loss.

3 reasons to use network diagram software

Due to the evolution of IT systems, the recent shift to a hybrid workforce, changing client requirements, and other reasons, network monitoring has become much more complex. IT admins need to visualize the entire network infrastructure effortlessly. Gaining visibility into the network makes it easy to spot patterns, proactively troubleshoot faults, ensure the availability of critical devices 24/7, and more.

Top 7 API Monitoring Tools for Your Business in 2021

As APIs are so important for connecting modern cloud applications, keeping an eye on their availability and speed is essential if you want to give a great user experience. A good API monitoring tool can assist you in developing dependable APIs by detecting and fixing issues before they reach your users. If you're looking for a solution like this, look no further. In this article, we looked at some of the top API monitoring tools available today.

How to visualize your business performance with cohort tables using Grafana and BigQuery

Grafana presents some of the most versatile tools for visualizing and understanding the real-time performance and reliability of systems, regardless of where your data lives. But one question our customers frequently ask is, “Can I use Grafana to understand the health and performance of my business?” More often than not, our answer is yes.

Monitoring Outliers vs. Unbalanced Services

LogicMonitor currently provides a solution for monitoring groups of nodes with the same functionality, which we call services. With companies moving towards more auto-scalable and transient architecture, LogicMonitor is able to continually monitor these services, which are always changing. We also needed a way of determining if these nodes are being used effectively. It can become an unnecessary cost if there are multiple underutilized nodes.

Central Maine Healthcare Drastically Reduces Citrix & Cerner Clinician Time to Remediation

“I’ve received so many tickets where I would spend hours troubleshooting four or more applications to try and find what was causing the latency when it was connection speed all along,” shares Aaron Hilton, a system administrator at Central Maine Healthcare system. Aaron is one of the main points of contact for resolving Citrix tickets, and the lack of visibility into the Citrix delivery infrastructure caused him to be reactive instead of proactive.

Calico eBPF Data Plane Deep-Dive

Sometimes the best way to understand something is to take it apart and see how it works. This blog post will help you take the lid off your Calico eBPF data plane based Kubernetes cluster and see how the forwarding is actually happening. The bonus is, unlike home repairs, you don’t even have to try to figure out how to put it back together again! The target audience for this post is users who are already running a cluster with the eBPF data plane, either as a proof-of-concept or in production.

How To Efficiently Monitor Your Web Application

On one hand, organizations are increasingly relying on web applications to engage customers and deliver value across multiple touchpoints. On the other hand, the complexity of web application environments has intensified significantly due to the prevalence of microservices architecture, content delivery networks (CDNs), and load balancing, among others. At the same time, end users expect a web application to be highly responsive, available around the clock, and accessible from anywhere on any device.

Integration Spotlight: Catchpoint and Slack, More Than A Collaboration Tool

Slack is one of the most popular tools for communication and collaboration used by large enterprises as well as small organizations. One of the amazing features of Slack is its ability to work with other tools to provide additional functionality that would not be readily available otherwise. Catchpoint integrates with Slack to provide our customers with enhanced performance monitoring and incident management. In this blog post, we look at the recent updates in the Catchpoint-Slack integration.

SaaS Plus, a new way of monitoring your Infrastructure with Pandora FMS

With Pandora FMS SaaS monitoring you can start operating almost instantly, using our Enterprise technology, thanks to any of our certified partners who offer this service. This allows you to focus exclusively on the operational aspects, control costs and growth from the very first minute, without having to invest in training, licenses, management, updates, initial implementation, etc. Let’s cut to the chase.

API 2.0: TruSTAR Operationalizes Data Orchestration and Normalization for a New Era in Intelligence Management

Today we released API 2.0, the latest version of TruSTAR’s API-First Intelligence Management Platform. This new version continues our commitment to simplify and streamline intelligence for automation in enterprise security intelligence management, and breaks through long-standing industry limitations around operationalizing data orchestration and normalization.

Using the New Flux Usage API to Calculate Pricing for InfluxDB Cloud

InfluxDB Cloud offers a transparent usage-based pricing model that only charges users on the work performed, with no minimums or long-term commitments. This puts YOU in charge of what you spend. However, with four separate pricing vectors, it’s not always easy to see exactly where that cost is going, or how to estimate your potential spend based on your data usage.

Say hello to a better, more flexible licensing model - OpManager Plus

Managing IT operations is becoming increasingly complex due to the evolution of IT systems, the recent shift to a hybrid workforce, changing client requirements, and many other reasons. This is why IT admins like you need a solution that allows you to deal with these complex ongoing problems effortlessly.

Visualize live dependencies with the Request Flow Map

Modern applications are often composed of countless distributed services, which makes it difficult to understand dependencies, isolate bottlenecks, and remediate errors. Datadog APM helps you tackle this complexity by allowing you to search and analyze 100 percent of your traces in real time. But without a dynamic view of your architecture, it can still be challenging to contextualize a specific request without getting lost in the details.

Observability with Zero Code Instrumentation? Meet eBPF

Current observability practice is largely based on manual instrumentation, which requires adding code in relevant points in the user’s business logic code to generate telemetry data. This can become quite burdensome and create a barrier to entry for many wishing to implement observability in their environment. This is especially true in Kubernetes environments and microservices architecture.

Root out the odd operation with Operations Breakdown

Transactions are sent when your service receives a request and sends a response, like an API call or a page load. Within each transaction is a series of operations. We built Operations Breakdown to help you, the developer, quickly see how much time was spent in each operation within a transaction. Why? Simple, so you can address the operations with the longest duration and likely causing annoying performance issues for your customer.

Create alerts from your logs, available now in Preview

Being alerted to an issue with your application before your customers experience undue interruption is a goal of every development and operations team. While methods for identifying problems exist in many forms, including uptime checks and application tracing, alerts on logs is a prominent method for issue detection. Previously, Cloud Logging only supported alerts on error logs and log-based metrics, but that was not robust enough for most application teams.

How to set up synthetic monitoring at scale with Grafana Cloud

While unit testing and integration testing can give you insight into the individual functionalities of an application, “at times you need some sort of monitoring or testing mechanism which also simulates a user’s behavior to test how the application would work or look to an actual user in the world,” says Grofers Software Development Engineer Yashvardhan Kukreja. That’s where synthetic monitoring comes in.

Managing Microsoft 365? See What You're Missing

If a customer has an issue with any part of Microsoft 365, MSPs just don’t have the native visibility to identify the root cause, let alone respond to and remediate the problem. Most of the time, it’s little more than checking Microsoft’s Service Health status to see if Microsoft knows it’s having a problem.

What is Website Monitoring?

Website Monitoring is a broad phrase used to describe the way web teams measure website reliability, performance and security. In today’s increasingly fast-paced world, website monitoring is becoming much more than that. Businesses have been driven online by socio-economic issues like reductions in retail footfall and, most recently, the Covid-19 pandemic. Websites are critical.

Overcoming SQL Server Blocking and Locking Challenges

One of the most common performance problems with SQL Server databases in production is the blocking of queries, which happens because database resources are locked. Understanding why locking happens is just half the battle. Being able to resolve locking, which will resolve blocking issues as well, is the second half.

Improving Our Typography to Optimize the Honeycomb User Experience

This is the second post in our series about Lattice, Honeycomb’s new design system and how we’re applying a user-centric design philosophy to our product. Lattice begin! At Honeycomb, we understand that our users are often under a great deal of pressure when troubleshooting complicated issues in their applications.

Managing Updates to the Splunk Cloud Vetting Process

Before apps can be installed in a customer’s Splunk Cloud deployments, these apps have to go through Splunk’s cloud vetting process. Cloud vetting helps ensure that apps are safe and performant for our mutual customers to use in Splunk Cloud. It’s important for us to make regular updates to our cloud vetting requirements in order to ensure apps running on Splunk Cloud are “up to snuff”.

Monitoring Apache Kafka Clusters with Sumo Logic

Apache Kafka® is one of the most popular streaming and messaging platforms, commonly used in a pub-sub (publish-subscribe) model, where consumer software applications send data via messages that producer software applications can consume. Teams use Kafka for a variety of use cases, including monitoring user activity, sending notifications, and concurrently processing streams of incoming data such as financial transactions.

The Business Case for Switching from the ELK Stack

Last year we published a popular paper on how to calculate the true cost of an Elasticsearch, or ELK (for Elasticsearch, Logstash, Kibana) stack environment. The paper helps readers calculate their overall annual cost of ownership for their ELK environment, and reveals how the cost burden of ELK is much higher than anticipated for most customers. That paper clearly hit a nerve — it’s been, by far, our most downloaded piece of content.

Accountable but Not Informed - Bring Clarity to Your Desktop Virtualization Environments

Why is it that when IT has to manage a virtual desktop environment, their job becomes infinitely harder? If you were to poll every major enterprise IT department, there’s always one team (or person) that’s ultimately held accountable for the organization’s Digital Employee Experience.

Google's Core Web Vitals: LCP, FID & CLS explained

You may or may not have heard of Google Core Web Vitals, but the importance of getting them right for your website is like Everest for website owners right now. So what are the Core Web Vitals and what should you do to make sure my website meets them? Google Core Web Vitals consist of 3 components that relate to page responsiveness, speed, stability, and how they affect the user experience. Already scrambling to Google what these mean? Don’t worry, all 3 will be explained in detail below.

Intro to AIOps: Leveraging AI and Machine Learning in DevOps

AIOps is a DevOps strategy that brings the power of machine learning to bear on observability and system management. It’s not surprising that an increasing number of companies are now adopting this approach. AIOps first came onto the scene in 2015 (coincidentally the same year as Coralogix) and has been gaining momentum for the past half-decade. In this post, we’ll talk about what AIOps is, and why a business might want to use it for their log analytics.

New 451 Research Says Monitoring Tool Consolidation Has Become a Top Priority

Industry analyst firm 451 Research recently published a Business Impact Brief on how monitoring tool sprawl, which has long been a pervasive problem for large enterprises and government institutions, is creating even more challenges in modern IT environments.

Rollbar Academy: Notifications and Issue tracking

Understanding and utilizing notification rules helps keep the right people informed about Rollbar issues, and they also play an important role in automated issue tracking too. You'll learn how these features work in tandem to help improve your developer experience, and how you can implement them to work effectively for your team and its needs.

Monitoring and Improving Employee Experience In Virtual Desktop (DaaS/VDI) Environments (Part 2)

In our last blog post on monitoring employee experience, we discussed the challenges most organizations face when trying to ensure optimal end user experience in Daas/VDI environments. We also discussed how the Catchpoint platform is uniquely positioned to help our customers monitor employee experience efficiently - In the second part of the series, we discuss a real customer use case.

Testing strategies for Step Functions

AWS Step Functions is a powerful orchestration service that lets you model even the most complex business workflows. It packs a great visualization tool (which you can also use to design your workflows visually now!) and can integrate with many AWS services directly, including Lambda, DynamoDB, and API Gateway. It’s one of my favorite AWS services and I often use it to model complex or business-critical workflows.

Real User Monitoring: Past, Present and Future

Most front-end developers and practitioners are familiar with real user monitoring (RUM) tools as a means to understand how end-users are perceiving the performance of applications. Few people, however, are aware of the history of the RUM market, going back more than two decades. Over the years, as the internet has evolved with new technologies, RUM tools have evolved in lock-step to cater to the ever changing needs and use cases of engineering teams.

HCL Technologies - Key Takeways with Nexthink

Employees in today’s corporations are dependent on properly functioning technology in order to get their work done and realize their business objectives. User experience can affect outcomes positively or negatively. The IT team at HCL Technologies turned to Nexthink to grant them insight into their client’s user experience and facilitate proactive responses to issues affecting users.

Website Monitoring to Optimize Your Page Speed

Chaos theory tells us that disruption strongly relates to time; and that the interval between chaos events either increases or decreases based on the amount of action. It sounds like a complex concept but the internet has managed to prove this theory and make it viral – not Rick Roll viral, more like DogeCoin viral – where profits are instantly influenced by volatile popularity. Inside the internet, speed equals profit so it makes sense to monitor it…but what does that mean?

What to Look for in a Network Traffic Visibility Solution

As company infrastructures now sprawl across several different environments, additional tools need to be added to the portfolio. But adhering to the traditional approach of focusing on individual devices, their health, performance, and availability, only aggravates its downsides; i.e. visibility blind spots, tool disparity, and therewith connected “swivel-chair” management. The problem calls for increased network traffic visibility that does not come at the cost of extra work.

The NetOps Expert - Episode 1: The Release of DX NetOp 21.2

In this episode of The NetOps Expert, Broadcom’s Nagesh Jaiswal and Jeremy Rossbach discuss why the latest release of DX NetOps 21.2 network observability software comes at the perfect time when the pandemic has created enormous demands on today’s networks and network operations teams.

That's A Data Problem - Accelerating Cloud Transformation | Splunk's James Hodge & Daniel Newman

With a massive shift to cloud infrastructure, organizations are now wrestling with operational complexity. Leadership must look to data solutions that support their cloud strategies, empower their people to make decisions and reach their business outcomes. Tech Analyst Daniel Newman and Global Chief Technical Advisor at Splunk, James Hodge, take a deep dive into accelerating cloud-driven transformation and discuss the benefits and best practices for achieving desired business outcomes.

How astronomers use Grafana dashboards to read the stars (and their data) on the SOFIA airborne observatory

There’s stargazing, and then there’s SOFIA. The SOFIA airborne astronomical observatory is a joint NASA and German Aerospace Center endeavor consisting of a modified Boeing 747SP aircraft with a 2.7-meter reflecting telescope and a team of astronomers onboard.

The Role of GroundWork Monitor in Security Monitoring

The GroundWork team has reviewed industry analysis of the recent Kaseya VSA incident, and while details are still being revealed, there are some useful take-aways we want to share. In particular, certain aspects of preparedness and indicators of active compromise can be monitored. We also want to talk a little bit about where GroundWork Monitor fits into security monitoring as a whole.

Partner Speak: Why Atos chose eG Innovations to proactively monitor its customers' virtual workspaces

Atos needed deep insights into the entire chain of components necessary for a virtual workplace to do its job properly, with a particular emphasis on user experience. This is exactly the kind of requirement that eG Enterprise is built for, which is what prompted Atos to start using the product five years ago. Sietze Vrind, a business manager at Atos says they’ve “never regretted it for a moment.”

Hybrid Cloud Monitoring in Depth

Nowadays, monitoring is very important. Why is that? Because applications become more and more complicated. But not only applications—infrastructure becomes complicated too. Some companies are moving to the cloud; others are building hybrid infrastructure. And if some pieces of infrastructure are in the cloud while others are on-premises, this creates even more unclarity on how to get an overview of the infrastructure as a whole.

What's New In DX NetOps Spectrum Network Monitoring Software

DX NetOps 21.2 network monitoring software continues to innovate and improve the scale, speed, and simplicity of network operations with a focused set of high-value features and capabilities. Exciting new enhancements include increased monitoring scale, telemetry support, expanded SDN and cloud technology coverage, and usability and security updates.

Monitoring IT Just Got Easier: Introducing the New Splunk App for Content Packs

We’re thrilled to announce the release of the Splunk App for Content Packs, an app that acts as a one-stop shop for prepackaged content and out-of-the-box searches and dashboards for common IT infrastructure monitoring sources, making it easy to get up and running with Splunk for IT use cases. In the past, you may have had to install and manage individual apps like Splunk App for VMWare and Splunk App for Windows Infrastructure.

Dealing with Rogue DHCP Servers

You’ve probably happened across this little conundrum at least once or twice—troubleshooting a network issue where users are connecting to the network, but they aren’t able to access any resources or the internet. You start going through your troubleshooting workflow: check physical layer, data link layer, network layer… and there’s the problem. The device has an IP address, but it’s not an IP address you’d expect to see on your network.

The 7 Steps to Creating and Refining a Cloud Migration Strategy

For a successful cloud migration, creating (and later refining), a cloud migration strategy tailored to your organization’s goals, available resources, workloads, and priorities is an absolute necessity. So here, we’ll take a look at a simple list of the areas you’ll need to quantify and understand to build that strategy and then improve it as you move forward through the cloud migration process.

Accelerating Dev Workflows: Terminal-driven Debugging

The pursuit of Digital Transformation and DevOps practices has led to several benefits such as increased deployment rates and better collaboration across teams. However, it has also led to endless abstraction, an increase in responsibilities, and many new tools (Kubernetes, hybrid-clouds and all their services, etc.). This increase in complexity has turned observability into an essential component of all ecosystems.

Introducing Datadog Cloud Security Posture Management

Governance, risk, and compliance (GRC) are major inhibitors for organizations moving to the cloud—and for good reason. Cloud environments are complex, and even a single misconfigured security group can result in a serious data breach. In fact, misconfigurations were the leading cause of cloud security breaches in 2020. This puts a lot of pressure on developer and operations teams to properly secure their services and maintain regulatory compliance.

My Website is Down! Ten Steps to Take During a Downtime Event

Oh no. Your website is down. And regardless of what time it is we guarantee it’s not a convenient time for your website to crash. An outage can cause a panicked fight-or-flight response when teams are unprepared for the consequences. One of the worst ways to deal with downtime is to try and wait it out thinking it’ll just magically resolve itself.

What is Network Monitoring | Obkio

What is Network Monitoring? We talk a lot about monitoring Network Performance, but what exactly does that mean? Let’s quickly go over the vocabulary surrounding network monitoring. When we talk about traditional network monitoring, we often refer to Fault Monitoring or Device Monitoring. Network monitoring covers a vast range of techniques. Network Performance Monitoring differs from traditional monitoring because performance is monitored.

Mitigating Alarm Fatigue with GroundWork Messenger

GroundWork Monitor Enterprise version 8.2.0 offers enhancements that build on the capabilities we have mentioned in past blogs. While all the dependencies, parent-child, and service and host dependencies are present as before, we have gone through our notification system and revamped it with an eye to making it easier to get the right alerts to the right people, with the right methods.

OpenSearch Is Now Generally Available!

I’m thrilled to say that OpenSearch has reached general availability (GA) with the release of version 1.0. This release represents a significant milestone and noteworthy accomplishment for a new open source initiative that was only launched a few months ago. I vividly remember that moment at the beginning of the year when we all woke up to Elastic’s announcement that it would take Elasticsearch and Kibana off the Apache 2.0 OSS license.

The State of Observability 2021: Mature Teams Ship Better Code Faster and You Can Too

The 2021 Observability Maturity Community Research report is the first year-over-year look at the observability landscape and how practices are evolving. And they are 3X more likely to deliver high customer satisfaction. Which practices make all the difference when it comes to advancing the impact of your observability practice? Honeycomb's VP of Engineering, Emily Nakashima leads a discussion with Redmonk Co-founder James Governor, Honeycomb CTO and Co-founder Charity Majors, and Eaze's Sr. Software Engineer, Joe Thackery.

Releasing Icinga Web v2.9.0

Today we’re announcing the general availability of Icinga Web v2.7.5, v2.8.3 and v2.9.0. Besides the compatibility with IcingaDB, the v2.9.0 release includes major enhancements to access control, support for PHP 8, the possibility to stay logged in during browser restarts and a full-fledged date-time picker in all browsers. You can find all issues related to the v2.9.0 release on our Roadmap. Please make sure to also check the respective upgrading section in the documentation.

The Digital Experience Trap: Are Companies Going Pro With Amateur Tools?

Recently, I’ve been thinking a lot about the relationship between world-class athletes and world-class IT systems. At first glance, it seems like there’d be little to compare, but there’s an interesting relationship between preparation and performance both these worlds share. During the Olympics, we see people cover 100 metres in under 10 seconds, cut through a pool in a minute, and stick landings with precision.

Why Are You Following Yesterday's IT Methods?

For years, IT experts and institutions have promoted the likes of Agile, ITSM, DevOps and other popular methods as a way for technology professionals to boost their own careers and to help departments break down complex modern work problems. And IT leaders have used these methods to communicate value (albeit reactively) to business executives to help explain the work they do between IT and non-IT people.

What's new in Grafana Enterprise Metrics 1.4: Cross-cluster query federation and self-monitoring

We introduced Grafana Enterprise Metrics (GEM) last September to give centralized observability teams the ability to provide a multi-tenanted, horizontally scalable Prometheus-as-a-Service experience for their end users. Since then, we’ve continued to make improvements and introduce new functionality. In this blog, I wanted to take a deeper dive into two of the exciting new features released with GEM 1.4.

How Martello Helps You Measure & Share SLAs/OLAs with your Customers & Lines of Business

The ability to maintain successful operations in business requires specific agreements that are critical to helping justify service delivery, understand the service performance, and get a budget for any potential infrastructure projects. Service Level Agreements (SLAs) are made between partners and customers and focus on the commitment of the partner to uphold an agreed-to level of service.

Understanding and Debugging Applications Using the Service Map

Elastic APM is an application performance monitoring system built on the Elastic Stack. Elastic APM makes it easy to pinpoint and fix performance problems quickly. In this video, you will learn what distributed tracing is, how it can be used to better understand your environment, and how service maps give you a quick overview of your architecture.

Football's Coming Home, but will England's Google Lighthouse Scores?

Football may be coming home, but will England’s Google Lighthouse Scores? Where were you in ’96? Euro 2020 is here, and so are our hopes that the Three Lions’ long wait for a European Championship could soon be over. England has had one of, if not the best set of, national football matches for decades. Winning 6 games in a row with only 1 goal conceded, how can Italy beat us?

Webinar Recap - How to Design an Employee Experience Monitoring Strategy

Measuring digital employee experience is currently the focus of most corporate IT teams. IT teams are now responsible for ensuring employees can collaborate and get work done irrespective of where their workspace is located - remote, in-office, and/or hybrid work locations. As the remote and hybrid workspace strategy evolved and became the norm over the last year, digital employee experience monitoring tools are in the spotlight.

The Ultimate Guide to Monitoring Serverless Applications

Serverless applications, more often than not, have logic distributed over multiple functions and services, which with growth and agents and wrappers attached, can get more complex and costly. This is where Serverless monitoring comes in to help. But what is Serverless monitoring? Serverless monitoring allows developers to gain important insight on what happens during each execution and event, errors become more easily visible, and measuring resource consumption for each invocation is possible.

Web Performance Monitoring: A How to Guide for Developers

As developers, we would rather be writing code all day than doing anything else. Especially meetings or fighting production problems. Unfortunately, both are part of the job. All developers need to understand the basics of web performance monitoring. It won’t help you get out of meetings, but it will help prevent production fires and put them out faster. Although, I guess it might also help you avoid meetings about production problems.

Monitor containerized ASP.NET Core applications with Datadog APM

ASP.NET Core is an open source web development framework that enables you to develop .NET applications on macOS, Linux, and Windows machines. The introduction of .NET Core in 2016 dramatically increased the number of ways to build and deploy .NET applications. This means that you need the ability to easily monitor application performance across a wide variety of platforms, such as Docker containers.

PostgreSQL Monitoring: The Best Tools and Key Metrics to Help Improve Database Performance

PostgreSQL is a popular open-source, object-relational database. As with any other data storage solution, capturing metrics is crucial for making sure your database is reliable, available, and performing optimally. This will help you dig deeper into database performance problems, do performance tuning, optimize queries and indexes, and make partitioning decisions. But that’s not all. You’ll also be able to set up alerts and plan for failures or upgrades.

What is Prometheus? The Essential Guide

DevOps is an essential part of software development in the modern IT world. However, as the application becomes more and more complex, managing infrastructure can become challenging. One of the essential aspects of driving such infrastructure is metrics collection and performance monitoring. There are plenty of tools available for monitoring a system or an infrastructure, but we are going to focus on, analyze, and look at the architecture of Prometheus.

5 Reasons To Use DynamoDB In Serverless Applications

In this webinar, AWS Data Hero Alex Debrie and Uri Parush System Architect at Lumigo will introduce DynamoDB by understanding its unique properties and why it's so popular in serverless applications. They will walk through some tips for using DynamoDB correctly, including identifying and fixing common issues using Lumigo.

An Introduction to OpenTelemetry

The growth of technology has led to more efficient and relevant digital experiences, and customers continue to expect more out of those interactions. That’s true no matter their location and no matter which device they choose to use. Companies that cannot provide these kinds of personalized interactions for their customers find themselves falling behind the competition as technology continues to advance.

Three Common Challenges to Monitoring StatsD and How to Tackle Them

StatsD is a key unifying protocol and set of tools for collecting application metrics and gaining visibility into the performance of applications. StatsD as a protocol was created by Etsy in 2011 for emitting application metrics. Soon after, the StatsD Server was developed as a tool for receiving StatsD line protocol metrics and subsequently aggregating them. While there are no official backends as part of the StatsD ecosystem, Graphite became the most commonly used.

Monitoring and Improving Employee Experience In Virtual Desktop (DaaS/VDI) Environments (Part 1)

A common pain point we repeatedly hear from our customers that use Desktop as a Service (DaaS)/Virtual Desktop Infrastructure (VDI) environments is, “We have monitoring in place for physical hosts and infrastructure, but our employees still complain a lot.” If DaaS or VDI is part of your IT environment and you lack visibility into such environments to ensure effective employee experience, read on.

How Slack Transformed Their CI With Tracing

Slack experienced meteoric growth between 2017 and 2020—but that level of growth came with growing pains. In his talk at the 2021 o11ycon+hnycon, Frank Chen (LinkedIn), a Slack Senior Staff Engineer, detailed one of Slack’s biggest pain points in that period: flaky tests. A flaky test returns both a passing and failing result despite no changes in the code. At one point, between 2017 and 2020, Slack’s flaky test rate reached as high as 50%.

Practical CPU time performance tuning for security software: Part 2

In a previous blog, we discussed how to monitor, troubleshoot, and fix high %CPU issues. We also revealed a system API that could have an unexpected impact on CPU consumption. In this episode, we’ll discuss another time-related performance aspect that is unique to security software: application startup time. You don’t need to be a developer to benefit from this article.

Debugging with Dashbird: AWS Lambda Process Exited Before Completing Request

Another generic error message from our favorite FaaS provider AWS Lambda. And again, there are multiple reasons why this issue could arise. Let’s first look at the basics of AWS Lambda to get a better intuition for when things go wrong later. Lambda is an asynchronous event-based service at heart.

Why Serverless Apps Fail and How to Design Resilient Architectures?

We’ve been monitoring 100,000’s of serverless backend components for 3+ years at Dashbird. In our experience, Serverless infrastructure failures boil down to: These isolated faults become causes of failure due to dependencies in our cloud architectures (ref. Difference of Fault vs. Failure). If a serverless Lambda function relies on a database that is under stress, the entire API may start returning 5XX errors.

How to Move Kubernetes Logs to S3 with Logstash

Sometimes, the data you want to analyze lives in AWS S3 buckets by default. If that’s the case for the data you need to work with, good on you: You can easily ingest it into an analytics tool that integrates with S3. But what if you have a data source — such as logs generated by applications running in a Kubernetes cluster — that isn’t stored natively in S3? Can you manage and analyze that data in a cost-efficient, scalable way? The answer is yes, you can.

TL;DR InfluxDB Tech Tips - Optimizing Flux Performance in InfluxDB Cloud

So you’re using InfluxDB Cloud and you’re taking full advantage of Flux to create custom data processing tasks, checks, and notifications. However, you notice that some of your Flux scripts aren’t executing as quickly as you expect. In this post, we’ll learn about best practices and tools for optimizing Flux performance.

Pros and Cons of Free Web Hosting

Selecting a web hosting service is essential for making your site go live. But if you are starting up or have a limited budget, it is usually challenging to buy a hosting service costing as much as $100 per year. Most of the paid plans don't offer a free trial. If you just want to try a blogging idea, practice designing a website, or have limited to no earnings, you can get started with free web hosting.

Achieving Multi Cloud Integration With SD WAN

The adoption of a multi-cloud approach is inevitable. Yet many struggle with the transition to multi-cloud due to legacy MPLS VPN networks, which weren’t designed for the Cloud. In this video, we explain how we’ve helped customers to solve this problem utilizing SD-WAN to eliminate complexity and deliver a cloud-first architecture.

Surprising ways page loading time affects your bottom line

Avid kite flyer, publisher, and postmaster Benjamin Franklin is believed to have coined the catchphrase, “time is money”. If only he had known just how relevant the phrase would become hundreds of years later, especially when it comes to the relationship between customer expectations of your website’s page load times and lost revenue. Page load time is the time it takes your browser to retrieve a page, with all content, and display it in full.

Cherwell Monitoring in Production

I have been working on a couple of monitoring ideas for Cherwell. I didn’t see anything with a quick online search, and I enjoy authoring MPs to monitor applications, it is the closest I’ll get to 007. I’ve hit a major hurdle and I need to ask for a hand from the community. We have a lab environment that’s worked great while developing the Cherwell integration for Connection Center, however, it is not a good simulation for an actual deployment.

Monitoring UV sensors on the International Space Station with Grafana

In space, there’s no atmosphere to protect against the sun’s ultraviolet radiation. Astronauts in orbit are exposed to the equivalent of eight X-rays a day, and the space stations and suits that protect them degrade over time due to radiation and other factors. Scientists working on the International Space Station (ISS) want to know more about ultraviolet (UV) radiation in orbit so they can design better materials.

How to Monitor Logs Guide With Recommended Automated Tools

Log monitoring is a practice used by IT administrators to organize, analyze, and understand a network’s performance. All network devices, including applications and hardware, create logs as they perform operations. Logs are like a device’s diary—they record every event and its critical information like user IP address, date and time, request time, and more.

DX NetOps 21.2 Network Monitoring Software Continues to Improve Visibility with Expanded SD-WAN, SDDC, and SD-WiFi Coverage

DX NetOps 21.2 network monitoring software continues to innovate and improve the scale, speed, and simplicity of network operations with a focused set of high-value features and capabilities. The solution collects data (network faults, performance, events, and alarms) from SDN and WiFi controllers and orchestrators to deliver deep visibility into the health and performance of your modern network deployments. Additionally, the solution correlates data from different network streams.

OpManager: Network visualization tool that turns data into insights

Information is one of an organization’s most important assets. In the global wide area network (GWAN), operations of all sizes store, change, and exchange their business data. Similar to how the meaning of digital data sharing has evolved, aspects like data availability and security have taken on important new meanings as well. Today’s IT administrators need to ensure the network is stable.

Monitor Microsoft 365 Client Apps in Real-Time

Microsoft 365 client applications such as Outlook, OneDrive, and Teams are standalone programs that perform the bulk of the resource and workload processing on a user’s computer. Data retrieval and verification for these applications happen on the client-side, and communication with the server is not continuous. Exoprise customers worldwide use the Office 365 client apps to manage their daily routine and work productively from home, HQ, or branch offices.

Monitor Vercel Serverless Functions with Datadog

Vercel is a deployment and collaboration platform that enables frontend developers to build high-performance Jamstack websites and applications. Vercel is also the creator of Next.js, a React framework developed in collaboration with engineers at Google and Facebook in 2016. Vercel users can leverage a built-in deployment tool that manages the build and rendering process, as well as a proprietary Edge Network that caches their sites for fast retrieval.

3 Incredibly Useful Metrics For Monitoring the Microsoft 365 Teams Desktop App

You use Microsoft Teams, correct? Microsoft 365 Teams Desktop app is a standalone program that performs the bulk of the resource and workload processing on a user’s computer. Data retrieval and verification for these applications happen on the client-side, and communication with the server are not continuous.

Upgrade Alert: Test Your Internal Infrastructure with Enhanced Private Location Monitoring

External servers need to be monitored but it’s your backend infrastructure that supports them. Looking for a reliable way to monitor your internal networks? You’re in luck! Uptime.com Private Location monitoring is just the tool for you.

Top 10 Java Linters

If you want to ensure code maintainability over the long term, you should follow best coding practices and style guide rules. One of the best ways to achieve this, while also potentially finding bugs and other issues with your code, is to use a linter. Linters are best described as static code analyzers because they check your code before it even runs. They can work inside your IDE, run as part of your build process, or be inserted into your workflow anywhere in between.

How to Perform HTTP Requests with Axios - A Complete Guide

One of the most typical things a developer does is make an HTTP call to an API. An API request can be sent in a variety of ways. We can use a command-line tool like cURL, the browser's native Fetch API, or a package like Axios to accomplish this. Sending HTTP requests to your API with Axios is a fantastic tool. Axios is supported by all major browsers. The package can be used for your backend server, loaded via a CDN, or required in your frontend application.

Beginner's Guide To Learn SCSS

Back in the day, frontend development was all about writing CSS, HTML, and JavaScript. However, it is no more the case. Now it has become much more complex and interesting than earlier. In addition, the e-commerce industry is evolving continuously, making frontend developers stay at par with the latest frontend technologies to create and build efficient and highly optimized websites for their businesses. In today’s article, we will see a definitive guide to SCSS, what it means and how to use it.

What's new in Grafana Cloud for July 2021: Traces, live streaming, Kubernetes and Docker integrations, and more

If you’re not already familiar with it, Grafana Cloud is the easiest way to get started observing metrics (Prometheus and Graphite), logs (Grafana Loki), traces (Grafana Tempo), and dashboards. Here are the latest features you should know about!

OpenSearch Tutorial: Getting Started with Install and Configuration

OpenSearch is a community response to the recent relicensing of Elasticsearch as a non-Open Source platform. AWS, Logz.io, and a number of partners have been working for months not only to make this merely compatible with Elasticsearch as a functional replacement, but also seeking to create an independent project roadmap.

Connection Center for Webhooks Intro

Cookdown Connection Center can integrate SCOM with anything, anywhere…! We simply use Webhooks to convert critical SCOM alerts into actionable notifications in real-time. So, now you can push alerts from SCOM to any application supporting Webhooks, which means your team can view alerts in their favorite tools. Find out how Connection Center can get your stakeholders more engaged and better connected!

Migrating Between Monitoring Systems

This question comes up all the time: How do you migrate between monitoring systems? The answer is both simple and complicated. In order to understand this better, rather than just rely on my own knowledge, I reached out to a number of people to see how they accomplished this. I’m going to summarize their process for you here in order to help others who may find themselves in need of this information.

The Reviews Are In-SolarWinds AppOptics Is Top Rated From TrustRadius

SolarWinds® AppOptics™ has officially been announced as a 2021 Top Rated award winner from the customer review site TrustRadius. As one of only three products to win this award in the application performance management (APM) space, our team behind AppOptics would like to thank the customers who helped make this happen. Because unlike other awards, Top Rated is determined by the verified reviews of our users and their experiences with AppOptics.

Business Monitoring for Gaming: Catch More Profit Opportunities with AI

Anomalies don’t have to be a fear factor; they could even present an opportunity to make money. Imagine detecting positive spikes in in-app purchases, conversions, or gaming activity in real-time and then having your business monitoring system identify what caused them 10x faster than you can now – autonomously. With 95% accuracy in the root cause analysis you could replicate and capitalize on the deviation immediately.

Optimized: Using A JavaScript (JS) Profiler For Improved Performance

No matter what you’re coding, there’s always room to optimize your code and improve performance. This can be a painstaking process, and if you’re going over your code line by line you’d better cancel all your plans and forget about getting any sleep! Fortunately, there are better ways to examine and optimize your code. A JS profiler is an efficient tool to help you understand your code better – effectively finding, pinpointing and optimizing bottlenecks in your code.

9 common error codes: why am I seeing them and what do they mean?

We’ve all been there. when you visit a website and you get hit with a three-digit number SMACK in the face. For most, those 3 little numbers mean very little, but it’s definitely worth knowing the most common error codes so you can at least know if your favourite website is down forever, or will be returning in the next five minutes.

Out-Of-The-Box Zero Touch Network Monitoring

AI monitoring technologies have the potential to introduce significant cost savings for CSPs. Based on machine learning and fully autonomous, these monitoring solutions provide high ROI by dramatically reducing Time to Detection (TTR), Time to Resolution (TTR), the total number of alerts, and the number of false positives and negatives.

Sponsored Post

Real User Monitoring for Microsoft 365 and SaaS Performance Issues

Service Watch for Real User Monitoring (RUM) has come a long way. Our last product update announcement talked about new layouts for Service Watch Browser (SWB) and Service Watch Desktop (SWD). These new layouts and widgets provide IT with a holistic end-user experience score. If we try to use business-critical application services from home (or call it #WorkAnyWhere), the experience is often not the same as working from corporate headquarters. Service Watch closes this gap with its browser and desktop passive monitoring solution, enabling IT to collect 1000's of advanced metrics for accelerating troubleshooting.

Sponsored Post

10 best error monitoring tools to use in 2021 - A comparison report

Software has the power to make the world a better place - but the real hero's are the people behind the code along with the technology they use to ship better software, faster. Today we're going to be looking into the top 10 error monitoring tools on the market to help you find the best solution for you and your team. Fortunately, there are plenty of innovative companies providing more powerful tools than ever before, all designed to make your life easier.

New: Push notification alerts via Pushover

Just launched: Push notifications via Pushover. Get outage and recovery alerts on all your devices, wherever you are... It's already weekend. Which means time away from the keyboard, and hopefully less screen-time from our always-around electronic devices. You don't want to go to dinner wondering if your online services are up and running, and also you might want to tone down the number of times you check your email. That's why we added the missing link to our alerting system.

A Guide To PHP Performance Monitoring

Performance is not something you should compromise on, and it's important to have a healthy development process that improves as your application grows. If your PHP application is not super-fast, it will be much harder to scale and maintain. You need to identify errors in the early stage to fix them as soon as possible. And if you don’t know where your bottlenecks are, you can’t fix them.

How to quickly find unused metrics and get more value from Grafana Cloud

As the complexity of software systems explodes, so does the amount of data that gets generated by instrumenting these systems. This poses a problem for our users — especially those who are in charge of observability teams and observability platforms at large enterprises. They have to strike the right balance between cost management and giving teams the freedom to instrument whatever they want. Often observability leaders are supporting dozens of teams that are using hundreds of dashboards.

How Goliath Technologies is Complimentary to Cerner Lights On Network

While Healthcare IT leaders take great care in choosing the right Electronic Health Records system, some may overlook the critical role that a virtuali zed desktop delivery infrastructure like Citrix and VMwareHorizon plays in providing access to Cerner and other mission-critical applications.

Rollbar Tip of the Day: Filter by Date Range

Learn how you can filter your items and occurrences by date range in the UI. Rollbar is the leading continuous code improvement platform that proactively discovers, predicts, and remediates errors with real-time AI-assisted workflows. With Rollbar, developers continually improve their code and constantly innovate rather than spending time monitoring, investigating, and debugging.

Announcing WP Activity Log Integration

With over 40% of websites powered by WordPress, there’s a good chance you or someone in your company is using it to update content or manage websites. This is why we’re excited to announce an integration with WP Activity Log—a comprehensive WordPress activity log plug-in—and SolarWinds® Papertrail™.

End-to-End Monitoring of Citrix Infrastructures: FAQs

The webinar included a live demonstration of how our eG Enterprise solution provides an end-to-end view of the Citrix deployment including the Citrix ADCs, Delivery Controllers, License servers, Virtual App servers, Virtual Desktops, and other Citrix tiers including WEM, AppLayering, and others. Citrix Cloud is also supported.

Proactive IT 101: Learn How to Build a Proactive Service Desk

What’s the service desk ticket that finally broke the camel’s back? Andrew Cohen (Sr. Manager, Digital Workplace Services at Cox) never had to find out – because he transitioned to a proactive service desk. In other words: a service desk that isn’t weighed down by growing ticket counts, reoccurring issues, and non-responsive employees. In a recent BrightTALK-hosted webinar, Andrew shared some of his firsthand experiences with building a proactive IT team.

Building an IoT App with InfluxDB Cloud, Python and Flask (Part 3)

Last year I started an IoT project, Plant Buddy. This project entailed soldering some sensors to an Arduino, and teaching that device how to communicate directly with InfluxDB Cloud so that I could monitor those plants. Now I am taking that concept a step further and writing the app for plantbuddy.com. This app will allow users to visualize and create alerts from their uploaded Plant Buddy device data in a custom user experience.

Application Lifecycle Management: A Comprehensive Guide

Discipline is the key to success for all companies doing well in their field or reaching a trillion-dollar valuation. They manage the software and update it very frequently when it comes to providing services. So how are they able to manage it and keep their software updated every moment? The answer is ALM—Application Lifecycle Management. ALM includes the people, the software, the tools, and the processes included in software development, from planning to deploying it for end customers.

15 Best DevOps Tools to Use in 2021 and Beyond

As you stroll through history, what changes do you notice in the culture of the medieval period, early modern period, and today, as in the modern-day? That's a simple question to answer. Their clothing, eating habits, modes of communication, and vehicles have all evolved and continue to evolve in the current era. So, what benefits may a company's cultural shift bring? You guessed it correctly!!! New DevOps tools and technology have a significant impact on cultural change.

The More You Monitor: AIOps in the Future of Monitoring

You might be wondering what impact AIOps will have on infrastructure and application monitoring in the future. More than just algorithms and machine learning, AIOps takes a holistic AI approach that will allow IT organizations to work more proactively, perform more efficiently, and fix problems faster.

Using Grafana, academics created a next-level dashboard tracking the impact of Covid-19 in Romania

When Covid-19 hit Romania, it was difficult for ordinary citizens to get good information about the pandemic and its escalating impact on the country. The government, presiding over one of the least developed healthcare infrastructures in the European Union, was releasing bulletins via PDF and text that were neither timely nor all that accurate. Into the breach stepped a team of six volunteers—five economists and a data scientist—operating out of Babes-Bolyai University.

Dashboards on Cloud Monitoring made easier with samples

Setting up Cloud Monitoring dashboards for your team can be time consuming because every team's needs are different. Picking the right metrics, using the right visualizations to represent these metrics, deciding what metrics can go on the same chart, and determining the right pre-processing steps for metrics requires background and experience that may not yet exist among your development and operations teams.

Investigating the Scene of an Incident: Using a Time-Traveling Topology to Create Escalation Graphs

Yes, time travel is possible...through data. My ability to time travel began when I started coding at age 10. Back then, all of my code ran on my own little computer. Like many ten-year-olds, I coded to create and play games. I also coded cool graphics to accompany music to impress my friends and utilities for copying. I launched my first commercial website in 1996 and made 25 guilders, which was good money for a 15-year old. Life was so easy.

Ingesting threat data with the Threat Intel Filebeat module

The ability for security teams to integrate threat data into their operations substantially helps their organization identify potentially malicious endpoint and network events using indicators identified by other threat research teams. In this blog, we’ll cover how to ingest threat data with the Threat Intel Filebeat module. In future blog posts, we'll cover enriching threat data with the Threat ECS fieldset and operationalizing threat data with Elastic Security.

API Monitoring Best Practices

Though invisible to most users, APIs are the backbone of modern web applications. Developers love them because they facilitate complex integrations between systems and services. The business loves them because integrating disparate systems to create new products and services drives innovation and growth. The challenge with this transformative connectivity is the dependencies that exist between systems. API failure can result in performance degradation, data anomalies, or even system-wide outages.

How to Optimize Your Cloud Spend Using Observability

The rise of public cloud services has enabled businesses to innovate faster, scale effortlessly, and adopt more advanced technologies easier than ever before. However, there’s a dark side to using public cloud services: complexity and cost. Public cloud services can scale to handle almost any workload, but in doing so, they can quickly generate unpredictable costs for your business.

Distributed Tracing for Kafka Clients with OpenTelemetry and Splunk APM

This blog series is focused on observability into Kafka based applications. In the previous blogs, we discussed the key performance metrics to monitor different Kafka components in "Monitoring Kafka Performance with Splunk" and how to collect performance metrics using OpenTelemetry in "Collecting Kafka Performance Metrics with OpenTelemetry." In this blog, we'll cover how to enable distributed tracing for Kafka clients with OpenTelemetry and Splunk APM.

Monitoring as a Service: The MSP Opportunity

Reducing costs and accelerating digital transformation is why your IT Management leans on their MSP partners. And as an MSP, you want to differentiate yourself and be able to support your enterprise customers quickly and reliably to drive their business. ScienceLogic's Monitoring as a Service is an MSP-centric, multi-tenanted monitoring platform that enables MSPs to develop new service offerings that deal with a broad case of IT infrastructure elements-whether physical, virtual, or cloud-across networks, virtual and physical services, storage, and applications.

Your Guide to Getting Started with AIOps

When you read that something is the "next big thing in IT operations" you probably suspect there's a lot of buzz and hype to follow. And often you'd be right, but with some effort, you can find the truth. It's no different with the buzz around AIOps but knowing what's what and where to start can be quite the effort. But putting buzzwords aside, it looks like AIOps is going to be a permanent fixture. In fact, a recent study by Forrester states that "68% of companies surveyed are actively investing in AIOps-enabled monitoring solutions within the next 12 months."