Operations | Monitoring | ITSM | DevOps | Cloud
September 2023
3 Ways FinTechs Can Improve Cloud Observability at Scale
Financial technology (FinTech) companies today are shaping how consumers will save, spend, invest, and borrow in the economy of the future. But with that innovation comes a critical need for scalable cloud observability solutions that can support FinTech application performance, security, and compliance objectives through periods of exponential customer growth. In this blog, we explore why cloud observability is becoming increasingly vital for FinTech companies and three ways that FinTechs can improve cloud observability at scale.
How to Reduce Continuous Monitoring Costs
NiCE VMware Horizon Management Pack
VMware Horizon monitoring is a crucial aspect of managing virtual desktop infrastructure (VDI) environments. As an IT admin and expert in this field, it is essential to have a comprehensive understanding of the tools and techniques available for monitoring and analyzing the performance and health of your VMware Horizon deployment. One of the primary goals of VMware Horizon monitoring is to ensure that your VDI environment is running smoothly, delivering a seamless user experience.
How to Improve Your Operating Margin with a Modern ITOM Solution
Use SaaS-based tools to improve margins, get a "single pane of glass" view for more accurate IT management data. A version of this blog first appeared on Channel Futures A couple of decades ago I sat down with my manager to consider how to improve the project’s operating margins.
Small Business Cybersecurity: Uncovering the Vulnerabilities That Make Them Prime Targets
According to a 2021 report by Verizon, almost half of all cyberattacks target businesses with under 1,000 employees. This figure is steadily rising as small businesses seem to be an easy target for cybercriminals. 61% of SMBs (small and medium-sized businesses) were targeted in 2021. But why are small businesses highly vulnerable to cyberattacks? We are looking into where the vulnerabilities are and what small businesses can do to protect themselves.
Customize your data ingestion with Elastic input packages
Elastic® has enabled the collection, transformation, and analysis of data flowing between the external data sources and Elastic Observability Solution through integrations. Integration packages achieve this by encapsulating several components, including agent configuration, inputs for data collection, and assets like ingest pipelines, data streams, index templates, and visualizations. The breadth of these assets supported in the Elastic Stack increases day by day.
Lightrun's Product Updates - Q3 2023
Throughout the third quarter of this year, Lightrun continued its efforts to develop a multitude of solutions and improvements focused on enhancing developer productivity. Their primary objectives were to improve troubleshooting for distributed workload applications, reduce mean time to resolution (MTTR) for complex issues, and optimize costs in the realm of cloud computing. Read more below the main new features as well as the key product enhancements that were released in Q3 of 2023!
The Leading Release Management Tools
In today's ever-changing digital development landscape organizations face the challenge of delivering high-quality software quickly and efficiently. Developing and producing new products and updates is a compelling but fundamental part of any technology business. But ensuring the process runs smoothly to make certain that your release reaches your customers as expected can be challenging. This is where release management tools come in.
Monitor your Boomi integrations with Kitepipe's offering in the Datadog Marketplace
Boomi is a cloud-based integration platform that helps customers connect their applications, data sources, and other endpoints. But monitoring and troubleshooting Boomi Atoms—the runtime engines for Boomi integration processes—and the applications connected to them can be a challenge. Boomi automatically purges logs after 30 days, and users must frequently correlate data from various disconnected sources for visibility into their Boomi processes.
This Month in Datadog: Integrations for AI/LLM Tech Stacks, Serverless Monitoring Releases, and more
Why Statsig Chose Datadog's Platform to Monitor Their Product
Flutter Debugging: Top Tips and Tools You Need to Know
Modern applications are complex inter-connected collections of services and moving parts that all have the potential to fail or not work as expected. Flutter and the language it’s built upon, Dart, are designed for event-driven, concurrent, and, most crucially, performant apps. It’s important for any developer using them to have a decent selection of debug tools.
Checkly Named a Cool Vendor in the 2023 Gartner Cool Vendors in Monitoring and Observability Report
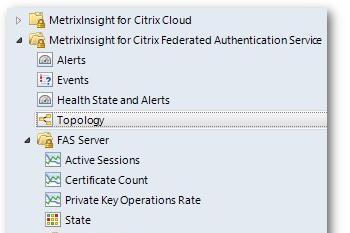
Elevating Citrix Monitoring with the SCOM MP for Citrix FAS in MetrixInsight for VAD/DaaS
We’re thrilled to spotlight a notable addition to our MetrixInsight for VAD/DaaS suite: the SCOM MP crafted specifically for Citrix Federated Authentication Service(FAS). The suite seamlessly integrates the entire Citrix® infrastructure into SCOM, encompassing Citrix Virtual Apps and Desktops, Citrix DaaS, Citrix License Server, Citrix Provisioning Services, Citrix StoreFront, NetScaler ADC and now Citrix FAS.
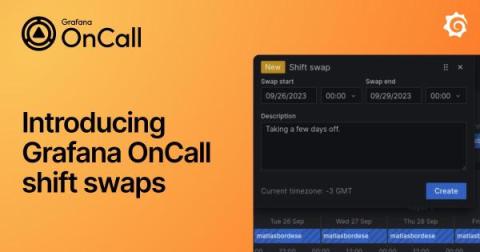
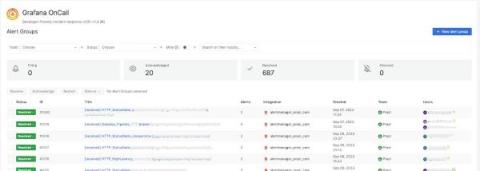
Introducing Grafana OnCall shift swaps: A simpler way to exchange on-call shifts with teammates
A family member’s birthday, that concert you’ve waited all year to see, an impromptu weekend getaway with friends — there are a lot of reasons software engineers might want to switch on-call shifts. And rather than have to frantically send Slack messages to your teammates, wouldn’t it be nice to automate the process and quickly find the coverage you need?
Customer Workshop 2023
This month, we were thrilled to welcome SquaredUp customers from all over the world to our in-person workshop in sunny Marlow, UK. It was a wonderful day of learning and sharing ideas, and a unique opportunity for SquaredUp users to meet the people behind the product (us!), network with like-minded customers, and get an exclusive look at the latest product updates. We were excited to showcase our Dashboard Server product roadmap and share our vision for the future of SquaredUp.
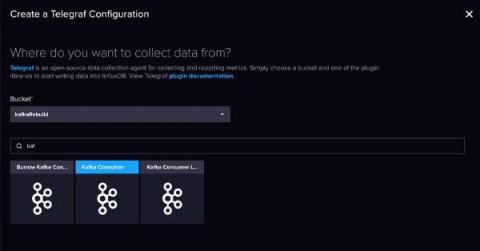
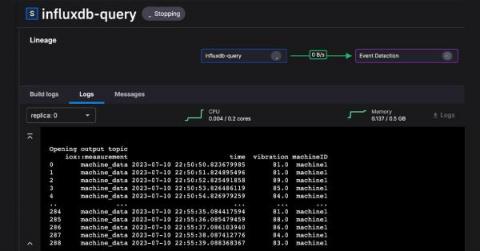
Build a Data Streaming Pipeline with Kafka and InfluxDB
InfluxDB and Kafka aren’t competitors – they’re complimentary. Streaming data, and more specifically time series data, travels in high volumes and velocities. Adding InfluxDB to your Kafka cluster provides specialized handling for your time series data. This specialized handling includes real-time queries and analytics, and integration with cutting edge machine learning and artificial intelligence technologies. Companies like as Hulu paired their InfluxDB instances with Kafka.
APM Today: Application Performance Monitoring Explained
Elastic SQL inputs: A generic solution for database metrics observability
Elastic® SQL inputs (metricbeat module and input package) allows the user to execute SQL queries against many supported databases in a flexible way and ingest the resulting metrics to Elasticsearch®. This blog dives into the functionality of generic SQL and provides various use cases for advanced users to ingest custom metrics to Elastic®, for database observability. The blog also introduces the fetch from all database new capability, released in 8.10.
Using Cribl Stream to Correct Misconfigured Data in Datadog
The challenge for every organization is gathering actionable observability information from all your systems, in a timely manner, without creating a substantial operational burden for the teams managing the collection tooling. While each observability solution has its unique benefits and challenges, the one common burden expressed by teams is the management of the metadata of the metrics, traces, and logs.
Releasing Icinga DB Web v1.1
Today we’re announcing the general availability of Icinga DB Web v1.1.0. You can find all issues related to this release on our Roadmap. Please make sure to also check the respective upgrading section in the documentation.
What Is a Feature Flag? Best Practices and Use Cases
Do you want to build software faster and release it more often without the risks of negatively impacting your user experience? Imagine a world where there is not only less fear around testing and releasing in production, but one where it becomes routine. That is the world of feature flags. A feature flag lets you deliver different functionality to different users without maintaining feature branches and running different binary artifacts.
What is Apache Tomcat server and how does it work?
Find slow database queries with Query Insights
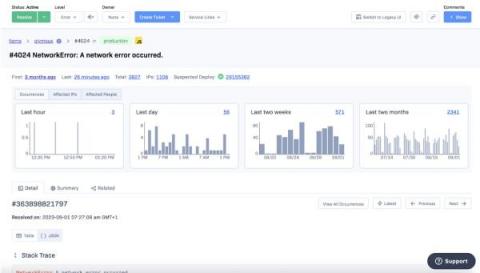
There’s only so much you can control when it comes to your app’s performance. But you control what is arguably most important - the code. Sentry Performance gets you the code-level insights you need to resolve performance bottlenecks.
How Uptime.com and Logz.io Can Streamline Website Monitoring
Maintaining the right combination of tools and integrations is essential in monitoring your online presence. To this end, Logz.io and Uptime.com — both highly-respected services in their own right — can be integrated to provide powerful analytics, uptime metrics monitoring, log management, and real-time incident alerts – all in one dashboard.
Post-Mortem: Microsoft Teams Monitoring Issue September 2023
At StatusGator, we understand the critical importance of providing reliable monitoring services to our valued customers. We sincerely apologize for the inconvenience caused by the recent issue affecting the monitoring of Microsoft Teams, which occurred from September 27, 2023, at 04:56 UTC to September 28, 2023, at 11:11 UTC. We deeply appreciate your patience and understanding as we addressed this incident and share our findings and actions taken to prevent future occurrences.
Create MySQL tasks easily
Monitoring Amazon SageMaker with Datadog
Amazon SageMaker is a fully managed service that enables data scientists and engineers to easily build, train, and deploy machine learning (ML) models. Whether you are integrating a personalized recommendation system into your video streaming application, creating a customer service chatbot, or building a predictive business analytics model, Amazon SageMaker’s robust feature set can simplify your ML workflows.
Defining Your Cloud Core Migration Strategy - Fail to Prepare, Prepare to Fail
The importance of Azure cost to DevOps
Syslog Tutorial: How It Works, Examples, Best Practices, and More
Syslog is a standard for sending and receiving notification messages–in a particular format–from various network devices. The messages include time stamps, event messages, severity, host IP addresses, diagnostics and more. In terms of its built-in severity level, it can communicate a range between level 0, an Emergency, level 5, a Warning, System Unstable, critical and level 6 and 7 which are Informational and Debugging. Moreover, Syslog is open-ended.
Alerts Config Manager and Netdata Assistant Chat! | Netdata Office Hours #7
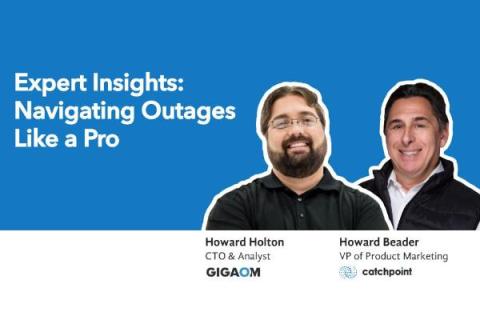
GigaOm Webinar Recap - Expert Insights: Navigating Outages Like a Pro
In the webinar, Expert Insights: Navigating Outages Like a Pro, Howard Beader, VP of Product Marketing at Catchpoint, interviewed Howard Holton, the CTO and Lead Analyst at GigaOm. The two Howards delved deep into the critical subject of Internet Resilience and its significance in today’s digital age. Here’s a recap of the key takeaways.
ChaosSearch named in Gartner's Cool Vendor Report
How to Install and Configure an OpenTelemetry Collector
Navigating the Cisco-Splunk Acquisition: A Lesson in Vendor Independence and Data Adaptability
In the ever-evolving landscape of technology and business, mergers and acquisitions have become a common occurrence. The latest buzz in the tech world revolves around the Cisco-Splunk acquisition, in which the former acquires the latter for a staggering $28 billion! This marks the fifth major acquisition in the AIOps and Observability space this year alone, following SumoLogic, OpsRamp, Moogsoft, and New Relic.
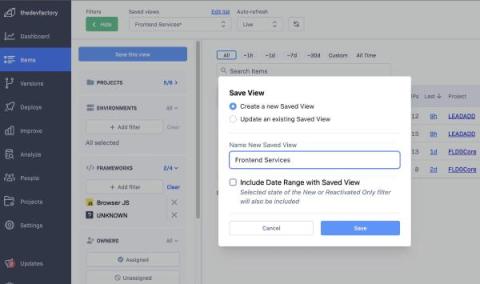
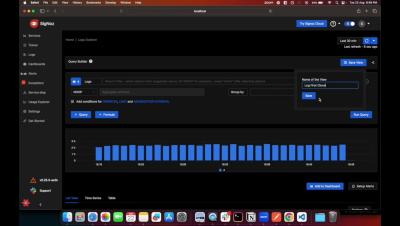
Saved Views
On the new item list page, for Advanced and Enterprise customers we are introducing the ability to store a collection of applied filters as a named Saved View, so that users can quickly switch between different configured views of their items. For users with a large number of projects, switching between the different views of the data they are interested in can be a time-consuming manual process.
Datadog Cloud Cost Management: Actionable Cost Data
RapidSpike win European eCommerce Software of the Year
This blog was first seen as an article in Bdaily, if you missed it you can catch it below: RapidSpike, an industry leader in business-critical website monitoring, is delighted to announce its latest achievement: being named European eCommerce Software of the Year. This esteemed award celebrates RapidSpike’s unwavering commitment to excellence in a fiercely competitive digital ecosystem.
How to Achieve High Website Availability
For many site managers, a website’s availability is crucial to your online presence. Whether you’re running an e-commerce store, a blog, or a corporate website, keeping it accessible to users around the clock is essential for success. You might have heard the term High Availability before (or HA); this is the holy grail for websites. It refers to your website’s ability to remain operational and accessible even when faced with disruptions or failures.
What's New in OpenTelemetry?
OpenTelemetry (OTEL) is an observability platform designed to generate and collect telemetry data across various observability pillars, and its popularity has grown as organizations look to take advantage of it. It’s the most active Cloud Native Computing Foundation project after Kubernetes, and it’s progressing at an immense pace on many fronts. The core project is expanding beyond the “three pillars” into new signals, such as continuous profiling.
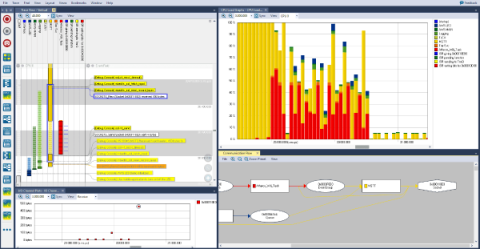
Introducing Tracealyzer SDK for Custom Integrations
Percepio Tracealyzer is available for many popular real-time operating systems (RTOS), including FreeRTOS, Zephyr, and Azure RTOS ThreadX, and also for Linux. But what if you want to use it for another RTOS, one that Percepio doesn’t provide an integration for? Then you’ve been out of luck—until now.
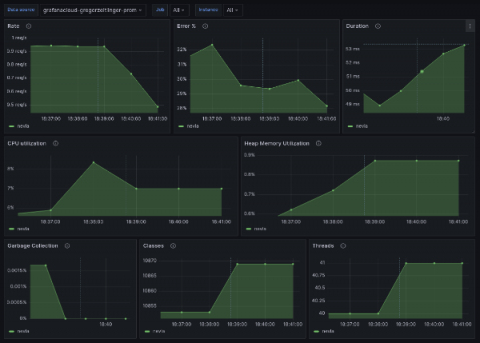
Introducing the Prometheus Java client 1.0.0
PromCon, the annual Prometheus community conference, is around the corner, and this year I’ll have exciting news to share from the Prometheus Java community: The highly anticipated 1.0.0 version of the Prometheus Java client library is here! At Grafana Labs, we’re big proponents of Prometheus. And as a maintainer of the Prometheus Java client library, I highly appreciate the support, as it helps us to drive innovation in the Prometheus community.
Observability at Scale Needs Summary
The shift from traditional monitoring to observability is widespread, and necessary. It's the way we make sense of increasingly complex and distributed systems. But when we capture all this data at scale... what do we do with it all? If this data itself had inherent value, we’d all be rich. But in the real world data does not provide us value until we can act on what it tells us.
Sumo Logic Customer Brown Bag - Observability - Metrics - September 26th, 2023
The Evolution of Data Center Networking for AI Workloads
Traditional data center networking can’t meet the needs of today’s AI workload communication. We need a different networking paradigm to meet these new challenges. In this blog post, learn about the technical changes happening in data center networking from the silicon to the hardware to the cables in between.
Sumo Logic ahead of the pack in a consolidating market
Pick 3 for Your Data Management: Speed, Choice, and Flexibility
Data growth has significantly out-pacing budgets; the products we use, have to do more. This is where optimization comes into play. Generally, optimization is associated with reduction which may be intimidating…what if something important is reduced? How can you identify what should be reduced? Reduction isn’t about removing context, but about removing repetitive data, meaningless fields, or even flattening JSON.
Understanding Mobile User Journeys
Icinga Accessibility with GrahamTheDev
Introducing the Datadog Open Source Hub
At Datadog, we have always been deeply involved with open source software—producing it, using it, and contributing to it. Our Agent, tracers, SDKs, and libraries have been open source from the beginning, giving our customers the flexibility to extend our tools for their own needs. The transparency of our open source components also allows them to fully audit the Datadog software that is running on their systems. But our commitment to open source only starts there.
Monitoring Machine Learning
I used to think my job as a developer was done once I trained and deployed the machine learning model. Little did I know that deployment is only the first step! Making sure my tech baby is doing fine in the real world is equally important. Fortunately, this can be done with machine learning monitoring. In this article, we’ll discuss what can go wrong with our machine-learning model after deployment and how to keep it in check.
What are web checks and ping checks? Why are they important?
An Overview on Azure API Center
Convergence of Observability and Security: A New Era
Observability and security are converging, benefiting dev and security teams. Runtime observability is the missing component to this important endeavor, providing much-needed data and insights to DevSecOps and AppSec teams.
What is IIS?
In this post, we’re going to take a close look at IIS (Internet Information Services). We’ll look at what it does and how it works. You’ll learn how to enable it on Windows. And after we’ve established a baseline with managing IIS using the GUI, you’ll see how to work with it using the CLI. Let’s get started!
The Power of SNMP Polling: Monitoring Your Network Like a Pro
How to update Rollbar Access Tokens
OpenTelemetry Webinars: Logging in OpenTelemetry
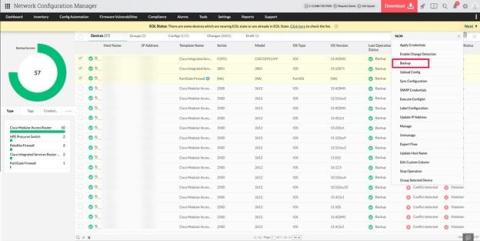
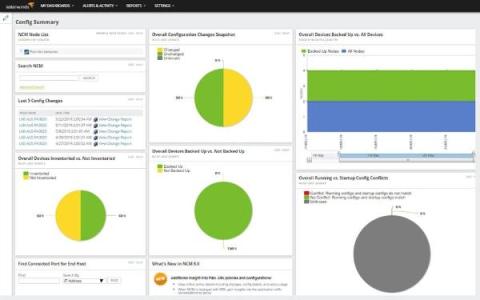
Streamlining network efficiency: Unveiling the power of ManageEngine Network Configuration Manager
Using SAP automation to maximise ROI: A Managecore case study
Managecore is a managed service provider (MSP) offering solutions ranging from data center transformation and public cloud services to virtualization and IT managed services. The company wanted to ensure operational transparency for its clients. In doing so, Managecore planned to improve customer service by making it easier for clients to monitor their SAP environments and get real time alerts. Avantra, an automation platform for SAP and non SAP environments, stepped in with its AIOps platform to offer a multitenancy solution to Managecore. Besides automation, Avantra provided a real time SAP monitoring solution.
Coralogix vs Google Cloud Operations: Support, Pricing and Features
Google Cloud Operations, formerly known as Stackdriver, is relatively new to the observability space. That being said, its position in the GCP ecosystem makes the platform a serious contender. Let’s explore some of the key ways in which Google Cloud Operations differs from Coralogix, a strong full-stack observability platform and leader in providing in-stream log analysis for logs, metrics, tracing and security data.
What is DataOps? Process, Benefits & Best Practices Today
Infrastructure Monitoring Today: How It Works & What It Does
Know Your Customer Again Revisited
Netdata, Prometheus, Grafana Stack
In this blog, we will walk you through the basics of getting Netdata, Prometheus and Grafana all working together and monitoring your application servers. This article will be using docker on your local workstation. We will be working with docker in an ad-hoc way, launching containers that run /bin/bash and attaching a TTY to them. We use docker here in a purely academic fashion and do not condone running Netdata in a container.
Netdata Processes monitoring and its comparison with other console based tools
Netdata reads /proc/
Netdata QoS Classes monitoring
Netdata monitors tc QoS classes for all interfaces. If you also use FireQOS it will collect interface and class names. There is a shell helper for this (all parsing is done by the plugin in C code - this shell script is just a configuration for the command to run to get tc output). The source of the tc plugin is here. It is somewhat complex, because a state machine was needed to keep track of all the tc classes, including the pseudo classes tc dynamically creates. You can see a live demo here.
Navigating Data Overload with Cribl
So many businesses today are playing “Hungry, Hungry, (Data) Hippo,” devouring every marble of information they can get their hands on. While it seems like every company has a robust data aggregation system, what most companies don’t have is an efficient way to control what data they store and where that data goes. We all want to make data-driven business decisions, but sorting through tons of data to find useful business insights can be like finding a needle in a whole farm.
5 reasons to switch to the OpsLogix VMware Management Pack
OpenTelemetry metrics: A guide to Delta vs. Cumulative temporality trade-offs
In OpenTelemetry metrics, there are two temporalities, Delta and Cumulative and the OpenTelemetry community has a good guide on the different trade-offs of each. However, the guide tackles the problem from the SDK end. It does not cover the complexity that arises from the collection pipeline. This post takes that into account and covers the architecture and considerations that are involved end-to-end for picking the temporality.
Rootless Containers - A Comprehensive Guide
Containers have gained significant popularity due to their ability to isolate applications from the diverse computing environments they operate in. They offer developers a streamlined approach, enabling them to concentrate on the core application logic and its associated dependencies, all encapsulated within a unified unit.
Auto-Instrumenting OpenTelemetry for Kafka
Apache Kafka, born at LinkedIn in 2010, has revolutionized real-time data streaming and has become a staple in many enterprise architectures. As it facilitates seamless processing of vast data volumes in distributed ecosystems, the importance of visibility into its operations has risen substantially. In this blog, we’re setting our sights on the step-by-step deployment of a containerized Kafka cluster, accompanied by a Python application to validate its functionality. The cherry on top?
State of the Internet: Monitoring SaaS Application Performance
15 Ways to Use UptimeRobot to Track Changes & Improve Your Web Prowess
In this blog you will learn: Keyword monitoring, or simply put, the practice of checking if a specific word is still present on a website, has many uses beyond just monitoring your uptime and errors. Keyword monitoring allows you to receive alerts about updates to content, or checking the content of a JSON file based on the words or phrases you’re interested in.
Run Azure Functions locally in Visual Studio 2022
Azure Event Grid dead letter monitoring
September 7, 2023 Sentry x Fast API Fireside Chat
How to monitor your scheduled server actions with Heartbeat checks
Quick Tip: Virtual Monitoring in WhatsUp Gold
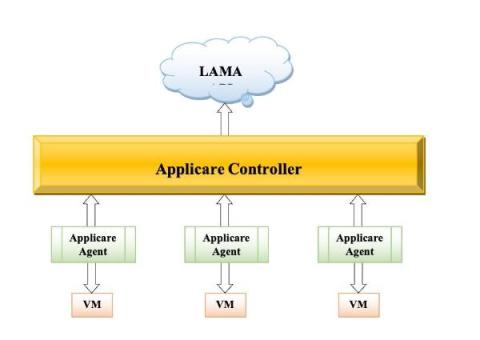
LAMA: The Brokerage Firm's Framework for Staying Ahead of the Curve
Brokerage firms are constantly under pressure to stay ahead of the competition. They need to make sure that they are using the latest technology and techniques to provide their clients with the best possible service. With constant advancements of technologies and integrations used by these brokerage systems, technical issues do arise.
Monitor multiple Azure subscriptions in a single dashboard
The Power of Network Uptime Monitoring: Proactive vs. Reactive
[Webinar] Unified container visibility: Managing multi-cluster Kubernetes environments
Unlocking seamless API management: Introducing AWS API Gateway integration with Elastic
AWS API Gateway is a powerful service that redefines API management. It serves as a gateway for creating, deploying, and managing APIs, enabling businesses to establish seamless connections between different applications and services. With features like authentication, authorization, and traffic control, API Gateway ensures the security and reliability of API interactions.
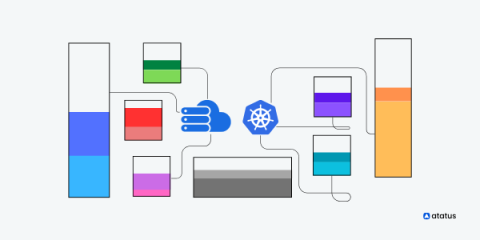
Optimizing Workloads in Kubernetes: Understanding Requests and Limits
Kubernetes has emerged as a cornerstone of modern infrastructure orchestration in the ever-evolving landscape of containerized applications and dynamic workloads. One of the critical challenges Kubernetes addresses is efficient resource management – ensuring that applications receive the right amount of compute resources while preventing resource contention that can degrade performance and stability.
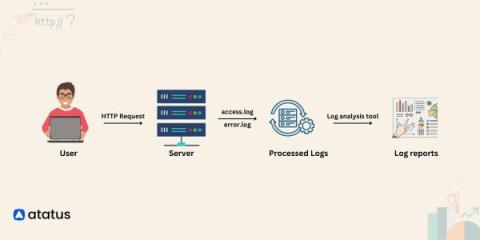
Apache Logs - Turning Data into Insights!
In the vast digital landscape of the internet, where websites and web applications serve countless users daily, there exists a silent but powerful guardian of information – Apache logs. Imagine Apache logs as the diary of your web server, diligently recording every visitor, every request, and every response. At its core, Apache logs capture a variety of critical information. They record the IP addresses of visitors, revealing their geographic locations and potentially malicious activities.
Prometheus Architecture Scalability: Challenges and Tools for Enhanced Solutions
After successfully deploying and implementing a software system, the subsequent task for an IT enterprise revolves around the crucial aspects of system monitoring and maintenance. An array of monitoring tools has been developed in alignment with the software system's evolution and requirements. Monitoring tools for software systems provide the essential insights that IT teams require to comprehend the real-time and historical performance of their systems.
Rescue Struggling Pods from Scratch
Containers are an amazing technology. They provide huge benefits and create useful constraints for distributing software. Golang-based software doesn’t need a container in the same way Ruby or Python would bundle the runtime and dependencies. For a statically compiled Go application, the container doesn’t need much beyond the binary.
New DX UIM Release: Start Monitoring New Linux Distributions on Day 1
From DX UIM 20.4 CU4 onward (that is, releases that have robot version 9.36 or above), robots automatically support Linux versions with newer GNU C Library (commonly known as “glibc”) versions. Prior to CU4, DX UIM robots needed certification and a release to provide support or compatibility with newer Linux operating systems that have a higher glibc version.
LogicMonitor Secures Multiple Leader Badges in G2's Fall 2023 Log Analysis and Monitoring Reports
How to monitor SLOs with Grafana, Grafana Loki, Prometheus, and Pyrra: Inside the Daimler Truck observability stack
In order for fleet managers at Daimler Truck to manage the day-to-day operations of their vast connected vehicles service, they use tb.lx, a digital product studio that delivers near real-time data along with valuable insights for their networks of trucks and buses around the world. Each connected vehicle utilizes the cTP, an installed piece of technology that generates a small mountain of telemetry data, including speed, GPS position, acceleration values, braking force and more.
Better anomaly detection in system observability and performance testing with Grafana k6
Grzegorz Piechnik is a performance engineer who runs his own blog, creates YouTube videos, and develops open source tools. He is also a k6 Champion. You can follow him here. From the beginning of my career in IT, I was taught to automate every repeatable aspect of my work. When it came to performance testing and system observability, there was always one thing that bothered me: the lack of automation. When I entered projects, I encountered either technological barriers or budgetary constraints.
What is Shadow IT? Will AI make this more challenging?
Shadow IT is a term used to describe IT systems, applications, or services that are used within an organization without the explicit approval, knowledge, or oversight of the IT department or the organization’s management. It typically arises when employees or departments adopt and use software, hardware, or cloud services for their specific needs without going through the official IT procurement or security processes.
Loki Log Context Query Editor in Grafana 10
OpenTelemetry Webinar: What is the OpenTelemetry API
SolarWinds Day September 2023 Database Session
Heroku Monitoring: What To Look For In Your Addons
Heroku is a cloud-based platform that supports multiple programming languages. It functions as a Platform as a Service (PaaS), allowing developers to effortlessly create, deploy, and administer cloud-based applications. With its compatibility with languages like Java, Node.js, Scala, Clojure, Python, PHP, and Go, Heroku has become the preferred choice for developers who desire powerful and adaptable cloud capabilities.
Circonus Passport: Automatically adapt your observability data collection strategy on the fly
Your Secret Weapon Against Cyber Threats: Enhancing Cyber Resiliency With Cribl
In a previous webinar, we discussed the importance of ensuring that your enterprise is cyber resilient and the politics around establishing a thriving cybersecurity practice within your organization. This week’s discussion covers specific tactics and solutions you can implement when you begin this initiative — watch the full webinar replay to learn more about how Cribl supports your cyber resiliency efforts.
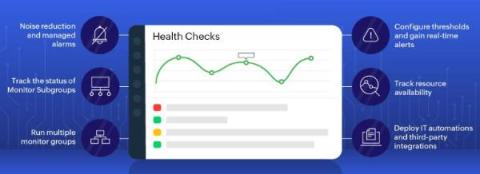
6 ways to isolate performance issues in your monitors with Site24x7 Health Checks
Is it only us, or have you also felt that you cannot do much with just Monitor Group (MG)? If the feeling is mutual, we are on the same page. Your ops engineer might have felt that MG restricts the ability to perform IT automation. For an ops engineer, how easy it is to handle incidents depends on how frequently MG status alarms are received. Enter Site24x7 Health Checks.
Azure SQL Database monitoring
Enhancing Network Reliability: How to Measure, Test & Improve It
OpenTelemetry vs. OpenTracing
OpenTelemetry vs. OpenTracing - differences, evolution, and ways to migrate to OpenTelemetry.
Augmenting behavior-based network detection with signature-based methods
Network detection tools utilize one of two prominent approaches for threat detection: AI-driven behavior-based methods capable of identifying early indicators of compromise, and signature-based ones, which flag known attacks and common CVEs. While these systems operate on distinct principles, their combination forms more robust defense mechanism, helps to consolidate tools, provides richer threat context and improves compliance.
How to enable signature-based detection in Flowmon Probe and Flowmon ADS
In this article, we explained the benefits of combining signature-based detection by Suricata IDS with behavior-based detection by Flowmon ADS. Now, let’s talk about how to enable this feature using Flowmon Probe and Flowmon ADS.
Coralogix Deep Dive - Custom Dashboards
Putting Developers First: The Core Pillars of Dynamic Observability
Organizations today must embrace a modern observability approach to develop user-centric and reliable software. This isn’t just about tools; it’s about processes, mentality, and having developers actively involved throughout the software development lifecycle up to production release. In recent years, the concept of observability has gained prominence in the world of software development and operations.
Making design decisions for ClickHouse as a core storage backend in Jaeger
ClickHouse database has been used as a remote storage server for Jaeger traces for quite some time, thanks to a gRPC storage plugin built by the community. Lately, we have decided to make ClickHouse one of the core storage backends for Jaeger, besides Cassandra and Elasticsearch. The first step for this integration was figuring out an optimal schema design. Also, since ClickHouse is designed for batch inserts, we also needed to consider how to support that in Jaeger.
The Microscope for Embedded Code: How Tracealyzer Revealed Our Bug
Tracealyzer. You can’t stay in the wonderful world of debugging and profiling code without hearing the name. If you look at Percepio’s website, it is compared to the oscilloscopes of embedded code. Use it to peek deep inside your code and see what it does. Of course, the code receives an interrupt and checks a CRC before sending the data through SPI, but how does it do it? And how long does it take?
Can you have a career in Node without knowing Observability?
Acing server performance: Don't overlook these crucial 11 monitoring metrics
A server, undeniably, is one of the most crucial components in a network. Every critical activity in a hybrid network architecture is somehow related to server operations. Servers don’t just serve as the spine of modern computing operations—they are also pivotal for network communications. From sending emails to accessing databases and hosting applications, a server’s reliability and performance have a direct impact on the organization’s growth.
Adding a CDN to a load balancer (for a much faster website)
SQL Performance Tuning: 7 Practical Tips for Developers
Being able to execute SQL performance tuning is a vital skill for software teams that rely on relational databases. Vital isn’t the only adjective that we can apply to it, though. Rare also comes to mind, unfortunately. Many software professionals think that they can just leave all the RDBMS settings as they came by default. They’re wrong. Often, the default settings your RDBMS comes configured with are far from being the optimal ones.
Why You Need An Application Performance Monitoring Tool
As organisations strive to deliver seamless user experiences, maximise operational efficiency, and maintain a competitive edge, the need for comprehensive Application Performance Monitoring (APM) tools becomes increasingly evident. APM tools offer invaluable insights into the performance and behaviour of applications in real-time. They go further than the conventional monitoring approach by providing a holistic view of the entire stack, encompassing servers, databases and user interactions.
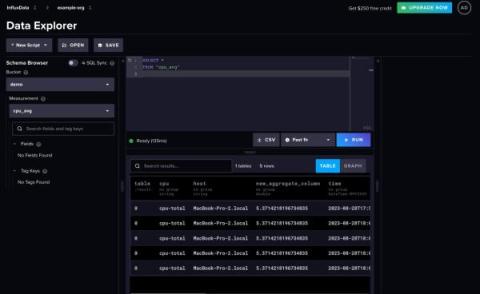
Mage.ai for Tasks with InfluxDB
Any existing InfluxDB user will notice that InfluxDB underwent a transformation with the release of InfluxDB 3.0. InfluxDB v3 provides 45x better write throughput and has 5-25x faster queries compared to previous versions of InfluxDB (see this post for more performance benchmarks). We also deprioritized several features that existed in 2.x to focus on interoperability with existing tools. One of the deprioritized features that existed in InfluxDB v2 is the task engine.
Learning in public: How to speed up your learning and benefit the OSS community, too
Technical folks in OSS communities often find themselves in permanent learning mode. Technology changes constantly, which means learning new things — whether it’s a new feature in the latest OSS release or an emerging industry best practice — is, for many of us, simply a natural part of our jobs. This is why it’s important to think about how we learn, and improve the skill of learning itself.
How universities preserve and protect digital assets with Grafana dashboards
Anthony Leroy has been a software engineer at the Libraries of the Université libre de Bruxelles (Belgium) since 2011. He is in charge of the digitization infrastructure and the digital preservation program of the University Libraries. He coordinates the activities of the SAFE distributed preservation network, an international LOCKSS network operated by seven partner universities.
Releasing Icinga Web v2.12
Today we’re announcing the general availability of Icinga Web v2.12.0. You can find all issues related to this release on our Roadmap. Please make sure to also check the respective upgrading section in the documentation.
Efficiently Tracing Zephyr Syscalls
Using Tracealyzer to view applications running on Zephyr RTOS comes with a special challenge: unlike some other microcontroller-oriented real-time operating systems, Zephyr exposes its kernel services via a syscall layer. A syscall is essentially a way to programmatically communicate with the operating system kernel from user level code.
Custom Management Packs - for your needs
Continuous Improvement and Pure Excellence: Advantages of RCA in Troubleshooting
Monitor your mobile tests with Sofy's offering in the Datadog Marketplace
As your apps scale, testing can become repetitive, manual, and time-consuming, leading to slower release cycles and lower-quality code. Sofy is a SaaS platform that enables you to create and run automated tests on your mobile apps without writing any code. Sofy will automatically test your mobile apps on real iOS and Android devices, so you can optimize their performance and debug end-user experiences without setting up or maintaining your own test infrastructure.
The importance of SDT and how to successfully schedule planned downtime
Grafana 10.1: Introducing the geomap network layer
Improved time series, trend, and state timeline visualizations in Grafana 10.1
Grafana 10.1: How to build dashboards with visualizations and widgets
From LCP to CLS: Improve your Core Web Vitals with Image Loading Best Practices
If you’re a front end developer, there’s a high probability you’ve built (or will build) an image-heavy page. And you’ll need to make it look great by serving high-quality image files. But you’ll also need to prioritize building a high-quality user experience by making sure your Core Web Vitals such as Cumulative Layout Shift and Largest Contentful Paint aren’t negatively affected, which also help with your search engine rankings.
Bill Kennedy: The mistake boot, building ACs, Black boxes & AI in software - The Reliability Podcast
5 AWS Logging Tips and Best Practices
Top tips: 5 steps to take while implementing a predictive maintenance strategy
Top tips is a weekly column where we highlight what’s trending in the tech world today and list out ways to explore these trends. This week we’re looking at five steps should follow when devising an effective predictive maintenance strategy for your organization. Have you ever wondered what it would feel like to be able to look into the future? Well, thanks to predictive maintenance, you can do just that!
ICMP Required for Traceroute and Network Diagnostics
As previously detailed on the Exoprise blog, the ICMP (Internet Control Message Protocol) is crucial for troubleshooting, monitoring, and optimizing network performance in today’s Internet-connected world. Despite historical security concerns, disabling ICMP is unnecessary and hampers network troubleshooting efforts. Modern firewalls can effectively manage the security risks associated with ICMP.
How to Rescue Exceptions in Ruby
Exceptions are a commonly used feature in the Ruby programming language. The Ruby standard library defines about 30 different subclasses of exceptions, some of which have their own subclasses. The exception mechanism in Ruby is very powerful but often misused. This article will discuss the use of exceptions and show some examples of how to deal with them.
Python Garbage Collection: What It Is and How It Works
Python is one of the most popular programming languages and its usage continues to grow. It ranked first in the TIOBE language of the year in 2022 and 2023 due to its growth rate. Python’s ease of use and large community have made it a popular fit for data analysis, web applications, and task automation. In this post, we’ll cover: We’ll take a practical look at how you should think about garbage collection when writing your Python applications.
Circonus Launches Open Beta for Passport, Ushering in a New Era of Flexible Observability
Sky-high observability costs or visibility gaps? This is the unfortunate trade-off many organizations have to make when it comes to determining how much telemetry data they should collect and send to their observability tools. Teams either collect more data than they need and pay the price, or they collect less and suffer visibility gaps. Today, this all changes.
The Evolution of IT Monitoring
Cloud Cost Optimization Best Practices
Businesses are rapidly transitioning to the cloud, making effective cloud cost management vital. This article discusses best practices that you can use to help reduce cloud costs.
The Plan for InfluxDB 3.0 Open Source
The commercial version of InfluxDB 3.0 is a distributed, scalable time series database built for real-time analytic workloads. It supports infinite cardinality, SQL and InfluxQL as native query languages, and manages data efficiently in object storage as Apache Parquet files. It delivers significant gains in ingest efficiency, scalability, data compression, storage costs, and query performance on higher cardinality data.
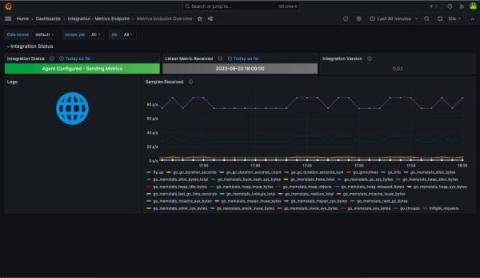
Introducing agentless monitoring for Prometheus in Grafana Cloud
We’re excited to announce the Metrics Endpoint integration, our agentless solution for bringing your Prometheus metrics into Grafana Cloud from any compatible endpoint on the internet. Grafana Cloud solutions provide a seamless observability experience for your infrastructure. Engineers get out-of-the-box dashboards, rules, and alerts they can use to visualize what is important and get notified when things need attention.
Auto-Instrumenting Node.js with OpenTelemetry & Jaeger
Six months ago I attempted to get OpenTelemetry (OTEL) metrics working in JavaScript, and after a couple of days of getting absolutely no-where, I gave up. But here I am, back for more punishment... but this time I found success! In this article I demonstrate how to instrument a Node.js application for traces using OpenTelemetry and to export the resulting spans to Jaeger. For simplicity, I'm going to export directly to Jaeger (not via the OpenTelemetry Collector).
Auto-Creating Defects from BugSplat in Your Defect Tracker
At BugSplat, we're always looking for ways to seamlessly integrate critical crash data into the support workflow. Another step in that quest has just been launched - the ability to automatically create defects from BugSplat databases in attached third-party trackers like Jira, Github Issues, Azure DevOps and more. This isn't just a new feature - it's a game-changer. Here's why.
Four ways full-stack observability drives organizational success
Learn how full-stack observability can benefit your organization with real-time visibility into all layers of your IT infrastructure. With digital environments growing more complex, customer expectations are at an all-time high — and IT teams are being asked to manage more with fewer resources while also being “more strategic.” Impossible, right? Well, it can be without full-stack observability.
Terraform is No Longer Open Source. Is OpenTofu (ex OpenTF) the Successor?
Terraform, a powerful Infrastructure as Code (IAC) tool, has long been the backbone of choice for DevOps professionals and developers seeking to manage their cloud infrastructure efficiently. However, recent shifts in its licensing have sent ripples of concern throughout the tech community. HashiCorp, the company behind Terraform, made a pivotal decision last month to move away from its longstanding open-source licensing, opting instead for the Business Source License (BSL) 1.1.
Understanding OpenTelemetry Spans in Detail
Ten reasons not to add observability
Getting Started: InfluxDB 3.0 Javascript Client Library
Automate Agent installation with the Datadog Ansible collection
Ansible is a configuration management tool that helps you automatically deploy, manage, and configure software on your hosts. By turning manual workflows into automated processes, you can quicken your deployment lifecycle and ensure that all hosts are equipped with the proper configurations and tools. The Datadog collection is now available in both Ansible Galaxy and Ansible Automation Hub.
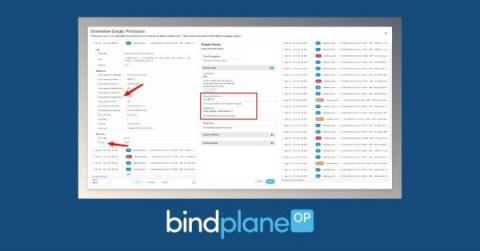
Gateways and BindPlane
How to create an alert rule in Grafana 10.1
Find Trending Problems Faster with Escalating Issues
Knowing what issues to hit the snooze button on, or drop everything and push a hotfix for is a common developer dilemma. Similarly to what was discussed in Sleep More; Triage Faster with Sentry, we’ve been collecting and iterating on customer feedback for ways to reduce issue noise and surface high-priority issues faster.
New flame graph features for continuous profiling data in Grafana 10.1
How to to filter trace spans in Grafana 10.1
Grafana 10.1: TraceQL query results streaming
Take Your Service Management Beyond IT
Frontend Performance Monitoring 101
Machine Learning for Fast and Accurate Root Cause Analysis
Machine Learning (ML) for Root Cause Analysis (RCA) is the state-of-the-art application of algorithms and statistical models to identify the underlying reasons for issues within a system or process. Rather than relying solely on human intervention or time-consuming manual investigations, ML automates and enhances the process of identifying the root cause.
Building a Distributed Security Team
In this live stream, Cjapi’s James Curtis joins me to discuss the challenges of building a distributed global security team. Watch the full video or read on to learn about some hard-won examples of how to be successful with remote team building and management. Talent is hard to find, and companies are hiring from all over the world to build the best teams possible, but this trend has a price.
How AI is Changing Modern Networking
Observability Architecture: Components, Stakeholders, and Tools Explained
SolarWinds Continues Ongoing Business Evolution With New and Upgraded Service Management and Database Observability Solutions
What is Graphite Monitoring?
Today we are going to touch up on the topic of why Graphite monitoring is essential. In today’s current climate of extreme competition, service reliability is crucial to the success of a business. Any downtime or degraded user experience is simply not an option as dissatisfied customers will jump ship in an instant. Operations teams must be able to monitor their systems organically, paying particular attention to Service Level Indicators (SLIs) pertaining to the availability of the system.
Application Dependency Maps: The Secret Weapon for Troubleshooting Kubernetes
Picture this: You're knee-deep in the intricacies of a complex Kubernetes deployment, dealing with a web of services and resources that seem like a tangled ball of string. Visualization feels like an impossible dream, and understanding the interactions between resources? Well, that's another story. Meanwhile, your inbox is overflowing with alert emails, your Slack is buzzing with queries from the business side, and all you really want to do is figure out where the glitch is. Stressful? You bet!
Best Practises For Application Performance Monitoring
Application performance monitoring (APM) tools have become a fundamental part of many organisations that wish to track and observe the optimal functioning of their web-based applications. These tools serve to greatly simplify the process through automation and allow teams to effectively collaborate to maximize efficiency, enabling you to reach the root cause of an issue before it reaches your customers.
What's Going on in There? What is Server Monitoring?
X-ray machines are one of the most sophisticated tools in the medical field. Capable of creating images of someone’s fractured arm, x-rays enable medical professionals to see what is going on in a patient’s most vital areas. In the IT world, server monitoring has a similar function.
Setting the Standard for Essential Observability: Logz.io Earns 20+ Fall G2 Badges
Logz.io is thrilled to have earned over 20 Fall 2023 G2 Badges for our Logz.io Open 360™ essential observability platform! G2 Research is a tech marketplace where people can discover, review, and manage the software they need to reach their potential. We’ve earned the following Fall 2023 G2 Badges for Application Performance Monitoring (APM) and Log Analysis.
Seamlessly correlate DBM and APM telemetry to understand end-to-end query performance
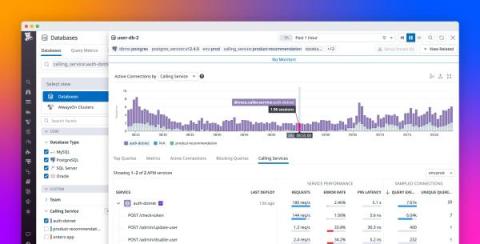
When the services in your distributed application interact with a database, you need telemetry that gives you end-to-end visibility into query performance to troubleshoot application issues. But often there are obstacles: application developers don’t have visibility into the database or its infrastructure, and database administrators (DBAs) can’t attribute the database load to specific services.
LLMs Demand Observability-Driven Development
Our industry is in the early days of an explosion in software using LLMs, as well as (separately, but relatedly) a revolution in how engineers write and run code, thanks to generative AI. Many software engineers are encountering LLMs for the very first time, while many ML engineers are being exposed directly to production systems for the very first time.
Using data collectors to compare a new feature
Revolutionize Data Ingestion: Introducing Terraform Support for Splunk Cloud Platform
LogicMonitor Excels in G2 Fall 2023 Network Monitoring Report
Set up Kafka and InfluxDB 3.0
Graphite vs Prometheus
Graphite and Prometheus are both great tools for monitoring networks, servers, other infrastructure, and applications. Both Graphite and Prometheus are what we call time-series monitoring systems, meaning they both focus on monitoring metrics that record data points over time. At MetricFire we offer a hosted version of Graphite, so our users can try it out on our free trial and see which works better in their case.
Monitoring Kubernetes tutorial: Using Grafana and Prometheus
Behind the trends of cloud-native architectures and microservices lies a technical complexity, a paradigm shift, and a rugged learning curve. This complexity manifests itself in the design, deployment, and security, as well as everything that concerns the monitoring and observability of applications running in distributed systems like Kubernetes. Fortunately, there are tools to help developers overcome these obstacles.
How to Troubleshoot Internet Connectivity Issues for IT Pros
Best Practices for TDM Masking with Docker
How Mobile Apps for Website Monitoring Can Improve User Experience
Imagine being on a relaxing vacation, the waves lapping at your feet, a drink in hand, and then you hear a gentle ping from your phone. Uh oh… what now? This alert is not an annoying email or a distracting message, but a digital fire alarm informing you that your website is down. Vacation time is over—time to find your laptop and some Wi-Fi.
Infinite Visibility in the Coralogix Custom Dashboard Solution
The Importance of System Monitoring for Business Operations
System monitoring has become a fundamental driver behind successful business operations in the digital age. The mostly invisible strand of intelligence is quietly working in the background, ensuring business continuity while supporting security and productivity. This post will delve into what system monitoring is, its primary areas of focus, and the irreplaceable value it brings to a business.
LAMA: Log analytics and monitoring application
The Securities and Exchange Board of India (SEBI) recently introduced a groundbreaking API-based logging and monitoring mechanism (LAMA) framework to address the increasing concerns surrounding technical glitches in stockbrokers’ digital trading systems.
Virtual Machine Manager and NiCE VMware Management Pack for SCOM
System Center Virtual Machine Manager (SCVMM) and the NiCE VMware Management Pack for System Center Operations Manager (SCOM) are both valuable tools for managing virtualized environments. However, they serve different purposes and offer distinct features. This comparison will explore the key differences and similarities between SCVMM and the NiCE VMware Management Pack for SCOM.
New Release: Galileo SMARTboards
Microsoft SCOM ITSM Ticketing System Connectors
SCOM (System Center Operations Manager) is a powerful tool that allows experts to monitor and manage their IT environment. However, to make the most out of SCOM, choosing a suitable ITSM connector that integrates with your existing ticketing systems is essential. In this blog post, we will explore different SCOM connectors available in the market and compare their features to help you make an informed decision.
Unleashing MVP Success with the FinOps Approach
Want to hear a sad but true fact? 70% of companies overshoot their cloud budgets. Why is that? Although the cloud is a mighty tool for speed, scalability, and innovation, the inability to see costs can lead companies to limit cloud usage, which hampers innovation and puts them at a disadvantage against the competition. Rather than limiting cloud usage, adopting the FinOps approach provides the insights you need to feel confident about your cloud costs.
Peak Periods, Peak Performance: Catchpoint Launches Internet Resilience Program
In our latest announcement, we are thrilled to launch our Internet Resilience Program, previously known as Black Friday Assurance. This program provides on-demand access to a team of expert engineers to help ensure the performance and resilience of websites and applications during crucial events. While it’s evident why eCommerce companies find this program indispensable during peak holiday seasons, shopping events are not the only occasion when IT teams are stretched to the limit.
Troubleshoot failed performance tests faster with Distributed Tracing in Grafana Cloud k6
Performance testing plays a critical role in application reliability. It enables developers and engineering teams to catch issues before they reach production or impact the end-user experience. Understanding performance test results and acting on them, however, has always been a challenge. This is due to the visibility gap between the black-box data from performance testing and the internal white-box data of the system being tested.
Top 10 Mistakes People Make When Building Observability Dashboards
Observability dashboards are powerful tools that enable teams to visualize and monitor the performance, health, and behavior of their applications and infrastructure. However, building observability dashboards is not a straightforward task, and many organizations make common mistakes hindering their ability to gain meaningful insights and respond to issues effectively.
The power of effective log management in software development and operations
The rapid software development process that exists today requires an expanding and complex infrastructure and application components, and the job of operations and development teams is ever growing and multifaceted. Observability, which helps manage and analyze telemetry data, is the key to ensuring the performance and reliability of your applications and infrastructure.
Is Bun the Next Big Thing for AWS Lambda? A Thorough Investigation
It’s been only a few days since the Bun 1.0 announcement and it’s taken social media by storm! And rightly so. Bun promises better performance, and Node.js compatibility and comes with batteries included. It comes with a transpiler, bundler, package manager and testing library. You no longer have to install 15 packages before writing a single code line. It creates a standardised set of tools and addresses the fractured nature of the Node.js ecosystem.
IT Pro Day Plays of the Week
The Synthetic Monitoring Beginner's Guide
Modeling and Unifying DevOps Data Part 2: Code
How to correlate performance testing and distributed tracing in Grafana Cloud k6
Introducing Teneo
Cloud monitoring vs. On-premises - Prometheus and Grafana
Prometheus and Grafana are the two most groundbreaking open-source monitoring and analysis tools in the past decade. Ever since developers started combining these two, there's been nothing else that they've needed. There are many different ways a Prometheus and Grafana stack can be set up.
Harnessing the power of artificial intelligence in log analytics
Native OpenTelemetry support in Elastic Observability
OpenTelemetry is more than just becoming the open ingestion standard for observability. As one of the major Cloud Native Computing Foundation (CNCF) projects, with as many commits as Kubernetes, it is gaining support from major ISVs and cloud providers delivering support for the framework. Many global companies from finance, insurance, tech, and other industries are starting to standardize on OpenTelemetry.
Creating HTTP triggers in Azure Functions
The hidden impact of cache locality on application performance
What Is Infrastructure as Code? How It Works, Best Practices, Tutorials
In the past, managing IT infrastructure was a hard job. System administrators had to manually manage and configure all of the hardware and software that was needed for the applications to run. However, in recent years, things have changed dramatically. Trends like cloud computing revolutionized—and improved—the way organizations design, develop, and maintain their IT infrastructure.
The Psychological Impact of Website Downtime on User Trust and Brand Perception
Website downtime refers to the period when a website is inaccessible or experiences disruptions, resulting in users being unable to access its content or services. In today's digital landscape, websites are crucial to business success and user engagement. The reliability of a website is paramount as it directly affects user experience and brand perception. User trust is the foundation of any successful online interaction.
Experiments in Daily Work
TL;DR: Sometimes I get hung up in the scientific definition of "experiment." In daily work, take inspiration from it. Mostly, remember to look at the results.
Network Observability Across the Enterprise
Container Network Observability
Data-driven Network Observability
Is your cloud provider executing network maintenance? Yes, yes they are.
What's New at Kentik in 2023
Using Synthetic Testing for Better Network Observability with Kentik
Time Series Is out of This World: Data in the Space Sector
While time series data is critical for space industries, managing that data is not always straightforward. While humans have yet to develop light-speed travel, teleportation or lots of the other cool things we see in movies or read in books, that doesn’t mean we aren’t making progress. Advances in technology are starting, ever so slowly, to blur the lines between science fiction and reality when it comes to outer space.
A better Grafana OnCall: Delivering on features for users at scale
Enterprise IT is just a different animal. Whether it’s operating at scale, undertaking massive migrations, working across scores of teams, or addressing tight security requirements, engineers at these organizations can face different obstacles than their counterparts at smaller organizations and startups.
Embedding DX Dashboards in APM and DX Operational Intelligence
As connected as the world is today, it can feel quite disconnected, especially in IT. Individual teams use various tools, each with specialized interfaces and dedicated dashboards, to present or interpret data each the specific functional team needs.
Microservices on Kubernetes: 12 Expert Tips for Success
In recent years, microservices have emerged as a popular architectural pattern. Although these self-contained services offer greater flexibility, scalability, and maintainability compared to monolithic applications, they can be difficult to manage without dedicated tools. Kubernetes, a scalable platform for orchestrating containerized applications, can help navigate your microservices.
See How Kubernetes Traffic Routes Through Data Center, Cloud, and Internet with Kentik Kube
Solving Faster in the Cloud Hybrid Infrastructure Observability with Kentik
BindPlane OP Overview
Heroku Monitoring: Visualization and Understanding Data
Data visualization is a way to make sense of the vast amount of information generated in the digital world. By converting raw data into a more understandable format, such as charts, graphs, and maps, it enables humans to see patterns, trends, and insights more quickly and easily. This helps in better decision making, strategic planning, and problem-solving. Visualization and understanding data are critical in platform-as-a-service (PaaS) offerings like Heroku.
Cribl Reference Architecture Series: Scaling Effectively for a High Volume of Agents
In this livestream, Cribl’s Ahmed Kira and I explore the challenges of scaling your Cribl Stream architecture to accommodate a large number of agents, providing valuable insights on what you need to consider when expanding your Cribl Stream deployment. Managing data flows from a high volume of agents presents a unique set of challenges that need to be addressed.
3 Ways to Drive Sustainable IT with Nexthink Employee Engagement
If you’re an IT / EUC professional looking to accelerate sustainable IT practices, it’s imperative to put employees at the center of your strategy. Driving sustainable practices and carbon reduction is a collective and long-term effort that requires behavioral change and impacts individual digital workspaces, so engaging employees is key.
September 7, 2023: Sentry x FastAPI Berlin Meetup
A complete guide on Azure Service Bus connection string
OpenSearch Services and Tools | Sematext
Passport Configurations - Assign a Configuration
Passport Configurations - Create a Configuration With the Flow Builder.
Passport Configuration Rules - Creating Time Bounded Rules
Passport Configurations - Importing a Configuration File
Passport Agent Manager - Installation on Ubuntu Linux
Out of Control: Managing log data costs in an economic downturn
Scaling AWS Lambda and Postgres to thousands of simultaneous uptime checks
Class is in Session with The Observability Professor!
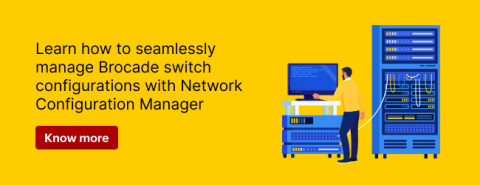
Brocade switch configuration management with Network Configuration Manager
Brocade network switches encompass a variety of switch models that cater to diverse networking needs. In today’s intricate networking landscape, manually handling these switches with varying configurations and commands within a large network infrastructure can be a daunting task. This complexity often leads to human errors such as misconfigurations. How can you optimize your network environment effectively when utilizing a variety of Brocade switches and eliminate the need for manual management?
Revolutionize your network performance with OpManager's versatile network management tool
As networks become more highly dynamic, managing an entire network efficiently is not an easy task. When it comes to network monitoring, all you need to figure out is the type of network devices and the specific metrics you need to monitor. But when it comes to network management, there’s more to be taken into account, from network security, bandwidth hogs, change management, and policy management to performance optimization.
What's New in Microsoft System Center Orchestrator 2022 UR1
Automation is at the heart of modern IT operations, and Microsoft System Center Orchestrator (SCO) has long been a vital tool in the arsenal of IT professionals. With each new release, Microsoft takes a step forward in refining and expanding the capabilities of SCO. This blog post will explore the exciting features and enhancements introduced in Microsoft System Center Orchestrator 2022 Update Rollup 1 (UR1).
Running OpenSearch on Kubernetes With Its Operator
If you’re thinking of running OpenSearch on Kubernetes, you have to check out the OpenSearch Kubernetes Operator. It’s by far the easiest way to get going, you can configure pretty much everything and it has nice functionality, such as rolling upgrades and draining nodes before shutting them down. Let’s get going 🙂
10 Best New Relic Alternatives & Competitors [2023 Comparison]
New Relic is a huge name in the website observability and analytics industry. They’ve carved out a space for themselves in a highly competitive monitoring space, and have garnered thousands of users and hundreds of millions in revenue. New Relic is known for its Infrastructure Monitoring capabilities, but it also has a number of other tools that are just as popular. But, New Relic is not so popular with everyone.
Monitoring virtual machines with Prometheus and Graphite
Virtual machines give you a flexible and convenient environment where people can access different operating systems, networks, and storage while still using the same computer. This prevents them from purchasing extra machines, switching to other devices, and maintaining them. This helps companies to save costs and increase task efficiency. Although using VMs for everyday tasks may be enjoyable, ensuring consistent performance and performing maintenance can be daunting.
Network Monitoring 101: How To Monitor Networks Effectively
Introduction to Apache Arrow
A look at what Arrow is, its advantages and how some companies and projects use it. Over the past few decades, using big data sets required businesses to perform increasingly complex analyses. Advancements in query performance, analytics and data storage are largely a result of greater access to memory. Demand, manufacturing process improvements and technological advances all contributed to cheaper memory.
How to resubmit & delete messages in Azure Service Bus dead letter queue?
LogicMonitor Maintains G2 Leader Badges: Fall 2023 Cloud Infrastructure Monitoring Report
Monitoring Kubernetes with Graphite
In this article, we will be covering how to monitor Kubernetes using Graphite, and we’ll do the visualization with Grafana. The focus will be on monitoring and plotting essential metrics for monitoring Kubernetes clusters. We will download, implement and monitor custom dashboards for Kubernetes that can be downloaded from the Grafana dashboard resources. These dashboards have variables to allow drilling down into the data at a granular level.
How to monitor Python Applications with Prometheus
Prometheus is becoming a popular tool for monitoring Python applications despite the fact that it was originally designed for single-process multi-threaded applications, rather than multi-process. Prometheus was developed in the Soundcloud environment and was inspired by Google’s Borgmon. In its original environment, Borgmon relies on straightforward methods of service discovery - where Borg can easily find all jobs running on a cluster.
Grafana vs. Datadog
Before we jump into the specifics of Grafana and Datadog, let's look at the main comparison points. Grafana is a great dashboard that allows you to plug in essentially any data source in the world. Grafana is most commonly paired with Prometheus, Graphite, and Elasticsearch to provide a full APM, time-series, and logs monitoring stack.
Inside Prezi's cost-saving switch to Grafana Alerting, Grafana OnCall, and Grafana Incident from PagerDuty
Alexander is Senior SRE at Prezi, a video and visual communications software company. As a team, the Prezi SREs provide multiple services within the company. One of those is the observability stack where Prezi heavily relies on Grafana. Companies are always evolving to run more smoothly, serve their customers better, and operate in a way that is cost-effective.
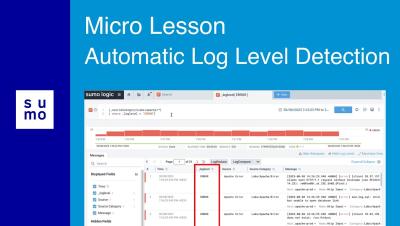
Micro Lesson: Automatic Log Level Detection
How to Create a SaaS Spend Management Strategy
Checkly Expands Monitoring Capabilities with Introduction of Heartbeat Checks
Ivanti and Catchpoint Partner to Proactively Address Remote Connectivity Issues and Enhance Workforce Productivity
IT Trends Report 2023: Observability advances automation and empowers innovation, yet adoption still in early stages
Top tips: 5 ways to enhance your knowledge in AI
Top tips is a weekly column where we highlight what’s trending in the tech world today and list out ways to explore these trends. This week we’re looking at five ways ways you can build upon the basics and start incorporating AI in your everyday. AI technology is now utilized in some form by almost 77% of devices. Nearly every industry has incorporated, or is trying to incorporate, AI in some way or another.
10 Key Benefits of DevOps
DevOps is a practice that combines software development and IT operations to improve the speed, quality, and efficiency of software delivery. By breaking down traditional silos between development and operations teams and promoting a culture of continuous improvement, DevOps helps organizations achieve their goals and remain competitive in today’s fast-paced digital landscape. To better understand how we asked engineers what key DevOps benefits they noticed since working with this approach.
Graphite Monitoring Tool Tutorial
In this post, we will go through the process of configuring and installing Graphite on an Ubuntu machine. What is Graphite Monitoring? In short; Graphite stores, collects, and visualizes time-series data in real time. It provides operations teams with instrumentation, allowing for visibility on varying levels of granularity concerning the behavior and mannerisms of the system. This leads to error detection, resolution, and continuous improvement. Graphite is composed of the following components.
What is Synthetic Testing?
Synthetic testing, also referred to as continuous monitoring or synthetic monitoring, is a technique for identifying performance problems with critical user journeys and application endpoints before they impair the user experience. Businesses may use synthetic testing to assess the uptime of their services, application response times, and the efficiency of consumer transactions on a proactive basis.
Top 11 Loki alternatives in 2023
Looking back at 15 Years of Catchpoint and Internet Performance History
Fifteen years ago, the Internet was a very different place. It operated on a very different scale, had different market leaders and it faced different technical challenges. What has not changed, however, is the need for the best – indeed ever higher - performance and resilience. We founded Catchpoint in September 2008 (amid terrible economic conditions) with the desire to make the Internet better. Not exactly the greatest year to launch a startup.
Discover Promox plugin
Mastering LAN Monitoring: How to Improve LAN Network Performance
Rapid Performance Analysis using Developer Tools
In the world of performance testing there is a heavy focus on the practice of load testing. This requires building complex automated test suites which simulate load on our services. But load testing is one of the most expensive, complicated, and time consuming activities you can do. It also generates substantial technical debt. Load testing has its time and place, but it's not the only way to measure performance.
Auto Filter Messages into Subscriptions in Azure Service Bus Topic
Icinga enables scientific research at Leibniz Supercomputing Centre
We are proud of our many customers and users around the globe that trust Icinga for critical IT infrastructure monitoring. That´s why we´re now showcasing some of these enterprises with their Success stories. It´s stories from companies or organizations just like yours, of any size and different kinds of industries. Some of them are our long-standing customers, others have just recently profited from migrating from another solution to Icinga.
Too Many Alarms? Take Advantage of Custom Situations
As IT infrastructures become increasingly complex to monitor and manage –with new compelling technologies such as virtual machines, software-defined networks and containers overlaid onto existing technology stacks– IT operations teams face the additional challenge of nearly unmanageable ticket volumes. Ticket prioritization, correlation, redundancies and sheer speed of ticket generation become problems in and of themselves.
Heartbeat Monitoring With Checkly
Today’s a big day at Checkly; we’re thrilled to announce that next to Browser and API checks we released a brand new check type to monitor your apps — say “Hello” to Heartbeat checks! In the realm of software, ensuring uninterrupted functionality is critical. While synthetic monitoring helps you discover user-facing problems early, keeping a close eye on the signals coming from your backend can be just as vital.
Universal Profiling Demo
Elastic AI Assistant for Observability
Announcing Sift: automated system checks for faster incident response times in Grafana Cloud
When faced with an incident, there are two areas that demand your immediate attention: the incident investigation, and the cross-functional coordination needed to resolve the issue. Grafana Incident helps with the collaboration by providing a central hub for communication across teams that seamlessly integrates with the tools you are already using, such as Slack or Microsoft Teams. But how can you best use your telemetry data to debug your application and bring your systems back online?
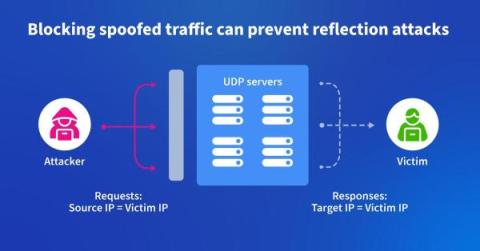
Using Kentik to Fight DDoS at the Source
In this blog post, we describe how one backbone service provider uses Kentik to identify and root out spoofed traffic used to launch DDoS attacks. It’s a “moral responsibility,” says their chief architect.
Best practices for instrumenting OpenTelemetry
OpenTelemetry (OTel) is steadily gaining broad industry adoption. As one of the major Cloud Native Computing Foundation (CNCF) projects, with as many commits as Kubernetes, it is gaining support from major ISVs and cloud providers delivering support for the framework. Many global companies from finance, insurance, tech, and other industries are starting to standardize on OpenTelemetry.
How to Fix Source Map Upload Errors
A stack trace lacking your source code with all the variables and function names, is like putting together a jigsaw puzzle without a picture for reference. You have all these randomly shaped pieces but no way to know how they fit together. Unless you are fluent in computer, making sense of a JavaScript stack trace with minified code is going to make debugging very difficult. Thankfully, by uploading source maps to Sentry, you can map back to the original source code to make sense of what went wrong.
AWS KMS Use Cases, Features and Alternatives
A Key Management Service (KMS) is used to create and manage cryptographic keys and control their usage across various platforms and applications. If you are an AWS user, you must have heard of or used its managed Key Management Service called AWS KMS. This service allows users to manage keys across AWS services and hosted applications in a secure way.
Kubernetes Logging with Filebeat and Elasticsearch Part 1
This is the first post of a 2 part series where we will set up production-grade Kubernetes logging for applications deployed in the cluster and the cluster itself. We will be using Elasticsearch as the logging backend for this. The Elasticsearch setup will be extremely scalable and fault-tolerant.
Kubernetes Logging with Filebeat and Elasticsearch Part 2
In this tutorial, we will learn about configuring Filebeat to run as a DaemonSet in our Kubernetes cluster in order to ship logs to the Elasticsearch backend. We are using Filebeat instead of FluentD or FluentBit because it is an extremely lightweight utility and has a first-class support for Kubernetes. It is best for production-level setups. This blog post is the second in a two-part series. The first post runs through the deployment architecture for the nodes and deploying Kibana and ES-HQ.
Comparing Datadog and New Relic's support for OpenTelemetry data
Mobile APP teaser and eBPF functions! | Netdata Office Hours #6
What's New in Microsoft System Center Operations Manager 2022 UR1
Microsoft System Center Operations Manager (SCOM) has been a cornerstone for IT professionals and system administrators for years. It provides essential tools for monitoring and managing an organization’s IT infrastructure health, performance, and security. With each new release, Microsoft introduces enhancements and updates to make SCOM even more powerful and user-friendly.
Apache Tomcat monitoring made easy with Applications Manager
Tomcat has been a trusted platform for managing your Java based web applications, Java Server Pages (JSPs) and Java Servlets. But who is the one reliable soldier watching Tomcat’s back while you are boosting the efficiency of your organization? We have the answer: your monitoring tool. Complete visibility into the infrastructure and comprehensive insights ensure IT administrator can properly manage their organization’s IT infrastructure.
VPN Split Tunneling: A Guide for IT Pros
Cloud Monitoring: What It Is & How Monitoring the Cloud Works
Splunk Achieves AWS Retail Competency Status
Correlation Does Not Equal Causation - Especially When It Comes to Observability [Part 1]
Top 5 Server Monitoring Tools
The need to monitor the health of servers and networks is unanimous. You don't want to be a blind pilot who is headed for an inevitable disaster. Fortunately, there are many open source and commercial tools to help you do the monitoring. As always, good and expensive are not as attractive as good and cheap. So, we've put together the most valuable cloud and windows monitoring tools to get you started.
Introducing query rules in Elasticsearch 8.10
We’re excited to announce query rules in Elasticsearch 8.10! Query rules allow you to change a query based on the query terms they are searching for, or based on context information provided as part of the search query.
Amazon RDS: managed database vs. database self-management
Amazon RDS or Relational Database Service is a collection of managed services offered by Amazon Web Services that simplify the processing of setting up, operating, and scaling relational databases on the AWS cloud. It is a fully managed service that provides highly scalable, cost-effective, and efficient database deployment.
Effective Logging in Threaded or Multiprocessing Python Applications
Monitoring TLS Network Traffic for Non-FIPS Compliant Cipher Suites
FIPS compliant cipher suites hold the U.S. government's seal of approval, guaranteeing their suitability for federal systems. On the other hand, non-FIPS compliant cipher suites may present security vulnerabilities due to outdated cryptographic algorithms and potential lack of perfect forward secrecy. As a result, it becomes paramount to monitor TLS network traffic for non-FIPS compliant cipher suites.
How to Monitor SaaS Environments with Synthetic Monitoring
What even is DevRel?
DevRel is short for Developer Relations. Developer Relations is exactly what it means, a marketing policy that prioritizes relationships with developers. In general society, there is a word known as PR (Public Relations); you could say DevRel is the developer version of this. Its definition is very simple. People who do DevRel often have a technical background, having worked in the industry before switching to their role, but that is not a requirement.
Take Your Pick! The Best Server Monitoring Tools on the Market
IT professionals are always presented with myriad solutions when seeking additional software for their network infrastructure. When it comes to server monitoring solutions, there are multiple options available. After all, every organization has its own needs, individual infrastructure and software requirements. With that in mind, the following list is a guide to help IT professionals select what they believe may be the best possible server monitoring solution for their organization.
One-Click Insights with Board Templates
Whether you’re a new Honeycomb user or a seasoned expert looking to uncover fresh insights, chances are you’ve sent tremendous amounts of data into Honeycomb already. The question is, now what? We have the answer: Board templates. Teams can now create Boards based on pre-built templates that generate visualizations with a single click.
Identifying memory leaks with automatic leak detection
Introducing Grafana Beyla: open source ebpf auto-instrumentation for application observability
Do you want to try Grafana for application observability but don’t have time to adapt your application for it? Often, to properly instrument an app, you have to add a language agent to the deployment or package. And, in languages like Go, proper instrumentation means manually adding tracepoints. Either way, you have to redeploy to your staging or production environment once you’ve added the instrumentation.
Monitor the health of your Temporal Server with Datadog
Temporal is an open source programming model that enables users to write and run scalable and reliable cloud applications. The Temporal Platform consists of a Temporal Cluster and Worker Processes, which together create a runtime for reentrant processes called Workflow Executions. Temporal’s workflows are resilient programs that execute tasks and react to external events, including timers and signals.
Our first ML based anomaly alert
Over the last few years we have slowly and methodically been building out the ML based capabilities of the Netdata agent, dogfooding and iterating as we go. To date, these features have mostly been somewhat reactive and tools to aid once you are already troubleshooting. Now we feel we are ready to take a first gentle step into some more proactive use cases, starting with a simple node level anomaly rate alert. note You can read a bit more about our ML journey in our ML related blog posts.
ScienceLogic Earns TRUE Certification from TrustRadius: A Testament to Transparency, Responsiveness, Unbiasedness, and Ethical Practices
Receiving the TRUE certification is a significant milestone for ScienceLogic, but it's just one step in our ongoing journey.
Unlocking IT: Considerations for a Powerful Observability Strategy
In today's cloud-native landscapes, observability is more than a buzzword; it's a critical element for software development teams looking to master the complexities of modern environments like Kubernetes. There’s a multi-faceted nature to observability with all its various levels and dimensions — from basic metrics to comprehensive business insights. It’s complex and can continue indefinitely…if you let it.
Box and Kentik: A Google Cloud Migration Success Story
Tools and partners can make or break the cloud migration process. Read how Box used Kentik to make their Google Cloud migration successful.
Expert Insights: Navigating Outages Like A Pro
Improve request latency for Go applications with Datadog APM & Continuous Profiler
How to Centralize and Automate Your Network Device Configuration Management
Sumo Logic Customer Brown Bag - Logging - Dashboards - September 12th, 2023
Getting started with PromQL
This article will focus on the popular monitoring tool Prometheus, and how to use PromQL. Prometheus uses Golang and allows simultaneous monitoring of many services and systems. In order to enable better monitoring of these multi-component systems, Prometheus has strong built-in data storage and tagging functionalities. To use PromQL to query these metrics you need to understand the architecture of data storage in Prometheus, and how the metric naming and tagging works.
Modernizing government documents with Govable and Grafana (Grafana Office Hours #12)
OpenTelemetry Webinar: What *is* the OpenTelemetry API?
Cisco Secure Application Delivers Business Risk Observability for Cloud Native Applications
The Importance of ICMP in Today's Digital Landscape
In today’s interconnected world, where network performance is crucial for business operations, understanding the significance of ICMP (Internet Control Message Protocol) becomes paramount. Today’s post sheds some light on the critical role of ICMP and why it should not be disabled despite legacy security concerns. By implementing proper security measures, businesses can leverage the benefits of ICMP while mitigating potential risks.
Visualize user behavior with Datadog Clickmaps
While understanding user behavior is key to effectively optimizing your application, it can be difficult to grasp how problems in individual sessions fit into larger trends. You could look at each relevant user session one by one to gauge how many users are experiencing an issue and to what degree. However, clicking through hundreds (or even thousands) of sessions is time-consuming and can overwhelm you with data that’s hard to analyze.
Next.js vs. React Performance
In the early days of the web, the idea of performance was relatively straightforward. Pages were static, and the most dynamic thing you might encounter was a blinking banner ad. But as the web evolved, so did our ambitions. Today it's not just about building web pages anymore; it's about crafting experiences. Load speed time and search engine optimization (SEO) matter just as much as the content on the page. Thus, the choice between React and Next.js is an important one, with real-world implications.
Monitoring EKS in AWS Cloudwatch
As Kubernetes adoption surges across the industry, AWS EKS stands out as a robust solution that eases the journey from initial setup to efficient scaling. This fully managed Kubernetes service is revolutionizing how businesses handle containerized applications, offering agility, scalability, and resilience.
Fly.io with Sentry
When developers build and deploy their apps, understanding what’s slow or broken in production is more a necessity than a convenience. With Sentry, developers are able to quickly pinpoint and fix issues that impact their end users or business, and we want every developer to have the best error monitoring in place from the moment they deploy code to production. So we’re partnering with Fly.io to do just that.
Getting started with OpenTelemetry instrumentation with a sample application
Application performance management (APM) has moved beyond traditional monitoring to become an essential tool for developers, offering deep insights into applications at the code level. With APM, teams can not only detect issues but also understand their root causes, optimizing software performance and end-user experiences. The modern landscape presents a wide range of APM tools and companies offering different solutions. Additionally, OpenTelemetry is becoming the open ingestion standard for APM.
Protect cloud native application environments faster - based on business risk with Cisco Secure Application
Now available: Cisco Secure Application delivers business risk observability for cloud environments.
5 Best Network Vulnerability Scanners
How to monitor SaaS Environments with a Google Chrome Plugin
Grafana Scenes is generally available: start building highly interactive apps today
Grafana Scenes is a frontend library that allows you to effortlessly extend Grafana, enabling capabilities that were once deemed unattainable, or exceedingly challenging, for Grafana app plugin developers. We first introduced Grafana Scenes with the launch of Grafana 10 at GrafanaCON 2023. Now, after 3 months in private preview, we are excited to announce that we are graduating Grafana Scenes to general availability.
Anatomy of an OTT Traffic Surge: NFL Kickoff on Peacock
Football is officially back, and Doug Madory is here to show you exactly how well the NFL’s streaming traffic was delivered.
LogicMonitor Leads the Pack in G2's Fall 2023 Enterprise Monitoring Reports
VPN vs. SD-WAN tunnels
Logging in Docker Containers and Live Monitoring with Papertrail
Pandora FMS announces brand unification with Pandora ITSM and Pandora RC
Cloud data control: Introducing the OpenTelemetry Arrow Project
In collaboration with F5, ServiceNow® Cloud Observability is pleased to announce the availability of the OpenTelemetry Arrow Project. This co-donated and co-developed project gives organizations greater control over the data extracted from their cloud applications—as well as a path forward to improve the return on investment (ROI) of that data.
Using a possibility tree for fast string parsing
How to provision a notification policy in Grafana Alerting - and keep it editable in the UI
Provisioning Grafana Alerting resources, such as notification policies, can help you deploy resources faster and streamline the alerting and notification process. Before getting started, it’s important to understand the different options for provisioning notification policies, how they work, and the challenges they can present. In Grafana Alerting, notification policies use alert labels to determine how alerts are routed to different contact points or receivers.
How to Improve Core Web Vitals
Gaps in website performance optimization have a devastating effect, and you will surely get strict penalties for making them happen. Websites failing to pass the Google Core Web Vitals assessment can expect their traffic, conversions, and business revenue to go south. And they can only make up the leeway with fast intervention and ingenious strategic planning.
Create browser tests directly from Datadog RUM Session Replay
Testing is a key part of application development and helps you maintain a reliable experience for your users. But the process can be difficult to scale and is often siloed to a single team or individual that does not have broad knowledge of your application’s UI. This can lead to organizations investing in sizable test suites that do not accurately represent real user behavior.
Bringing speedups to top-k queries with many and/or high-frequency terms
Disjunctive queries (term_1 OR term_2 OR... OR term_n) are extremely commonly used, thus they are getting a lot of attention when it comes to improving query evaluation efficiency. Apache Lucene has two main optimizations for evaluating disjunctive queries: BS1 on the one hand for exhaustive evaluation, and MAXSCORE and WAND on the other hand to compute top hits.
StatusGator Becomes Climate Neutral Certified: Commitment to Sustainability
We are thrilled to announce that StatusGator is now officially Climate Neutral Certified. This achievement marks a significant milestone in our journey towards a more sustainable and environmentally-conscious future.
OpenTelemetry Gotchas: Phantom Spans
This guest post is written by Ian Duncan, Staff Engineer - Stability Team at Mercury. To view the original post, go to Ian's website. At work, we use OpenTelemetry extensively to trace execution of our Haskell codebase. We struggled for several months with a mysterious tracing issue in our production environment wherein unrelated web requests were being linked together in the same trace, but we could never see the root trace span.
A detailed guide on Azure architecture diagram
Observability for the Public Sector: Greater Visibility for a More Resilient Digital Future
Choosing the Right Metric: A Guide to Percentiles and Averages
Not sure which performance metric to use to measure your application performance? Don’t worry – you’re not alone. With a wide variety of options, the task of choosing the right metric can be daunting. This post will help you decide which metric is right for your monitoring needs by discussing the strengths and limitations of each metric.
How InfluxData and Dremio Leverage the Apache Ecosystem
InfluxData and Dremio have always been at the forefront of embracing open source solutions to enhance their product offerings. This post discusses how both companies currently leverage the Apache Ecosystem and describes the downstream impact these powerful technologies have on their offerings. InfluxData created and maintains InfluxDB, a time series platform.
Getting Started: InfluxDB 3.0 Go Client Library
Integrating MetricFire and Heroku for Web Hosting
Today's fast-paced digital landscape demands efficient and reliable web hosting solutions. As websites and applications become increasingly complex, businesses are constantly seeking ways to optimize their performance and ensure seamless user experiences. One crucial aspect of this optimization process is the effective monitoring and tracking of vital metrics.
How to Integrate CloudWatch and Sentry with MetricFire
CloudWatch and Sentry are two powerful tools that play crucial roles in monitoring and error tracking, making them essential for any organization that wants to ensure the smooth operation of its applications and systems. CloudWatch, developed by Amazon Web Services (AWS), offers comprehensive monitoring capabilities for AWS resources and applications, providing real-time insights into system performance and resource utilization.
Reference Architecture Series: Scaling Syslog
In this livestream, Cribl’s Ahmed Kira and I go into more detail about the Cribl Stream Reference Architecture, with a focus on scaling syslog. They share a few use cases, some guidelines for handling high-volume UDP and TCP syslog traffic, and talk about the pros and cons of some of the different approaches to tackling this challenge. It’s also available on our podcast feed if you want to listen on the go.
Grafana Loki hits 20K GitHub stars: 20 fun facts about the open source logging project
The Grafana Loki GitHub repository just hit 20K stars! You can’t exchange GitHub stars for coffee at Starbucks or pay rent with it, but this is a big milestone that is a testament to the enormous momentum of this open source project. Thank you to the Grafana Loki community — this couldn’t have been possible without you! To celebrate this 20K benchmark, here are 20 completely random, but fun facts and tips about Grafana Loki: Interested in learning more about logging?
What is Network Response Time & How to Monitor It
Webinar: Internals of How we tame High Cardinality
Webinar: Uncovering High Cardinality with Piyush Verma
Testing, Observing, and Debugging RabbitMQ
RabbitMQ is a popular open-source message broker that facilitates communication between different components of a distributed system. Monitoring a RabbitMQ instance is crucial to ensure its health, performance, and reliability. Monitoring allows you to identify and address potential issues before they escalate, ensuring smooth communication between various parts of your application.
Mezmo Logging vs Coralogix Logging: Features, Pricing and Support
Mezmo, formerly known as LogDNA, offers log analytics without any native capabilities around metrics and tracing data. While Coralogix’s full-stack observability supports logs, metrics, tracing and security data, for the purpose of this comparison with Mezmo, we will focus primarily on logs.
Helios Joins the AWS Marketplace!
We are thrilled to announce that Helios, the applied observability platform for developers, is now available on the AWS Marketplace! This marks a significant milestone in providing visibility and runtime insights for easy troubleshooting and reduced MTTR. This further cements our commitment to providing top-tier services to our customers and to AWS users. By bringing Helios directly to the AWS Marketplace, it is easier than ever to access and onboard our platform.
Grafana k6 for WebSockets and infrastructure testing (Grafana Office Hours #11)
Celebrating 100 episodes of k6 Office Hours (k6 Office Hours #100)
The Ultimate Guide to ELK Log Analysis
Five worthy reads: Can process transformation solve DataOps challenges?
Five worthy reads is a regular column on five noteworthy items we’ve discovered while researching trending and timeless topics. This week, we explore whether digital transformation can solve DataOps challenges. Data is the new oil in the modern digital economy, and businesses today are producing more data than ever before. Without any proper process in place, firms globally are finding it overwhelming to navigate through the pool of data.
10 Best Splunk Alternatives [2023 Comparison]
In the website monitoring and observability space, there are few names that hold as much weight as Splunk. Established in 2003, Splunk is highly focused on log data visualization and analysis but offers a wide range of tools to help you monitor your applications. All of that being said, just because it’s been around a while doesn’t mean that it’s right for everyone.
A Journey to Observability: Following Your Data From Generation to Analysis
I’m launching a new Observability Series called the Observability Professor, and it is designed to cover some common topics and terms in a vendor agnostic way. That’s right, no marketing! So what’s special, what’s new, what’s it going to cover that everyone else in the industry missed? Background: There are endless amounts of blogs, papers, and books on Observability; what it is and what it offers.
The Latest Product Highlights in Goliath Performance Monitor 12.1
Monitoring your enterprise end-user computing infrastructure is critical to ensuring systems are online and for proactive troubleshooting.
Azure SQL database cost optimization to maximize savings
How to Develop a Modern Monitoring & Observability Strategy for Businesses of Any Size
In the dynamic world of IT, the way we monitor systems has seen a remarkable evolution. Gone are the days when monitoring was limited to basic server checks or infrastructure health. With the rise of cloud-native applications, serverless architectures, and container orchestration platforms like Kubernetes, the digital landscape has become a multi-dimensional maze.
Condoms, Cauldrons and Content: 5 years in Tech Marketing
My name is Georgina and I’m the Marketing Manager at RapidSpike, you may know me from hit budget Christmas adverts such as ‘Twas the Night Before Magecart’ and ‘Christmas Parties’. This week marks 5 years working at RapidSpike and in the general marketing tech space. It’s been a jam-packed 5 years. I’ve had the privilege of expanding my marketing knowledge, trying new things, and working with some of the best people I know.
The BSL is a short-term fix: Why we choose open source
On August 13 2023, users of HashiCorp’s Terraform forked the software under the name OpenTF. This was a strong and rapid community reaction to HashiCorp switching the license on their products merely three days before. The list of companies and individuals pledging their support to the new fork has been overwhelming. The new license that HashiCorp has chosen for its products, the Business Source License (BSL), is no longer open source, but instead source-available.
Replaying Backend Errors using Sentry's Session Replay
With Session Replay tools, you can more easily see what user actions lead to an error. For example, Sentry’s Session Replay is a first class integration with frontend errors that handles this case beautifully. Session Replay records the web browser, which will only show issues if they happen on the user’s webpage browsing session. As a backend developer, I thought it was a great feature, although I didn’t get to use it much.
LBBC Technologies Creates a Custom Predictive Maintenance Program with InfluxDB, AWS, and MQTT
LBBC Technologies is almost 150 years old and dedicates time and resources to pushing the boundaries of pressure vessel and autoclave design through precision engineering, advanced technologies, and electronic intelligence. They prioritize investments in research and development to advance their vision for the future.
Why "good reply game" matters in open source communities
Communities of all sorts, including open source communities, boil down to the daily interactions we have with one another. What we call “the community” emerges from a series of utterances and responses, which gives rise to relationships and networks. This makes “good reply game” essential to create, sustain, and grow an open source community.
Exploring Kubernetes 1.28 Sidecar Containers
Kubernetes v1.28 comes with multiple new enhancements this year and we’ve already covered an overview of those in our previous blog, Do check this out before diving into sidecar containers. We’re going to completely focus on the new sidecar feature for this post, which enables restartable init containers and is available in alpha in Kubernetes 1.28.
When Depth and Breadth Meets Technology Innovation
The combination of Hewlett Packard Enterprise and OpsRamp is helping organizations to manage and transform their multi-vendor and multi-cloud IT estates with AI-driven operations, improving the performance and reliability of those environments while reducing complexity and technical debt.
Getting Started with BindPlane OP and Google Cloud Operations
What is VMware NSX?
Install the BindPlane Agent on Windows
Avantra Cloud Edition for RISE with SAP
Nagios vs. MetricFire
The world of IT monitoring has evolved significantly in recent years, with businesses relying more than ever on robust and efficient tools to keep their systems running smoothly. In this fast-paced digital landscape, it's crucial to have a monitoring solution that can provide real-time insights into the health and performance of your infrastructure. In this blog post, we will explore the advantages of using MetricFire over Nagios as your go-to monitoring tool.
Web API Showcase - Buzzsprout Podcast Analytics
How to Troubleshoot Slow Web Applications With Sematext
Maintaining a smooth operation of your web application is crucial for the success of your business. When customers encounter performance issues while using your application, it will likely affect your business reliability and customer satisfaction. This can lead to churn rate increase which will cause a loss of revenue. As a Site Reliability Engineer (SRE) or DevOps professional, you would want to keep your product reliable for end users.
How to Extract Numerical Values from API Responses
Extracting numerical values from public or private JSON API responses can help you track and analyze data, easily spot trends, and alert on data that is important to your business. If you can passively have this information periodically come to you and if you can receive alert notifications when certain conditions are met, you can avoid checking each metric manually and – obviously – save a ton of time. Synthetic monitoring tools let you do these things automatically.
How to Periodically Extract Webpage Performance Metrics from Browser API
To ensure a good end user experience, smart businesses periodically gather performance data from their websites. They measure the responsiveness and speed of their services to ensure fast and reliable websites. Having a responsive and fast website improves companies’ conversion rates, keeps their reputation intact, and helps increase traffic and revenue. Website monitoring applications help determine whether the website achieves the desired response times and uptimes.
How to Track Your Company's Rating on a Website
Websites provide advisory services, research, and user reviews on SaaS companies to help users find the right product for their needs. Information and reviews shared by genuine users of your product or service is the strongest recommendation that can be received by your potential customers. This is why online user reviews are important for eCommerce and SaaS companies.
Top tips: Five ways you can reduce unplanned network downtime
Top tips is a weekly column where we highlight what’s trending in the tech world today and list out ways to explore these trends. This week we’re looking at five ways your business can minimize unplanned network downtime. Network downtime is the bane of the IT service provider. It disrupts not only internal operations, but can greatly inconvenience your customer who relies on the uninterrupted access to and the full functioning of your product or service.
Why are organizations increasing their IT spending despite a recession?
Soaring inflation, rising interest rates, supply chain disruption, spikes in chip costs, war, and other market crises have collectively crippled the global economy. As a result, businesses across industries and sizes have started tightening their belt, looking for any way to optimize their spending. With businesses running on a digital layer, optimizing spending on technology holds prominence. CIOs and CTOs now feel more accountable for every penny that goes into IT.
How to Extract Numerical Data from a Web Page for Dashboarding and Alerting
Over the years working as a software engineer and now a product manager, I’ve encountered multiple situations where I needed to extract numerical data from a page on a periodic basis and create visualizations, typically line charts to help me see trends over time. For example, I wanted to extract product prices and monitor them over time. Or, I wanted to query a search engine periodically and extract the number of matches or the position of a specific page for SEO purposes.
Grafana Loki 2.9 release: TSDB volume endpoints, remote rule evaluations, LogQL optimizations
The Loki squad is excited to announce Grafana Loki 2.9 is here! For this release, we’ve developed additional TSDB endpoints to help you better understand your log volume; introduced query language optimizations to make parsing more performant; and restructured our documentation so it is easier to use. This coincides with the release of Grafana Enterprise Logs (GEL) 1.8, so all the features discussed here are available in both Loki 2.9 and GEL 1.8.
Hot Topic: Increasing Cost-Efficient Observability with Cold Tier
Even as the global economy shows signs of a rebound, today’s observability customers are more focused than ever on driving utmost value from their investments. This isn’t simply because economics have forced organizations to closely review overhead and drive out unnecessary costs; the reality is that observability has become one of the leading budget items for every cloud software organization, full stop.
An Introduction to the OWASP API Security Top 10
Top 10 LogicMonitor Alternatives
In today's fast-paced digital world, businesses rely heavily on IT infrastructure monitoring tools to ensure optimal performance and reliability. LogicMonitor has carved a niche in the market as a comprehensive monitoring solution for complex IT environments. However, the recent security mishap has pushed us to look for other alternatives as well. Fairly recently, LogicMonitor was in hot waters for its weak default passwords, ultimately leaving them vulnerable to ransomware attacks.
Troubleshooting Spring Boot Microservices - A Real World Case Study
Today, I’ll cover Shift Left Monitoring: A Pathway to Optimized Cloud Applications and how left-shifted troubleshooting of Spring Boot code issues using observability tooling can avoid production issues, unnecessary costs and improve product quality. Shift-left is an approach to software development and operations that emphasizes testing, monitoring, and automation earlier in the software development lifecycle.
The Complementary Power of RUM & Internet Synthetic Monitoring
User expectations are at an all-time high, and any performance hiccups can lead to frustrated users and lost business opportunities. To get real-time insights into their digital assets and succeed in this competitive landscape, businesses need Internet Performance Monitoring (IPM) that incorporates both synthetic and Real User Monitoring (RUM). RUM and synthetics are two powerful tools that, when used in tandem, offer a comprehensive view of performance and user experience.
Leverage user context to debug mobile performance issues with the Instabug Datadog Marketplace offering
As user expectations for mobile apps increase, effective bug remediation involves not only addressing critical incidents as they occur but also proactively handling smaller performance issues in order to ensure a smooth user experience (UX). Instabug helps you understand how users experience your app with crucial mobile performance metrics—such as launch metrics, loading times, and UI hangs—viewable alongside your bug reports.
A Comprehensive Guide to Network Device Monitoring
How to Configure Multiple Worker Groups in Cribl.Cloud
Multiple Worker Groups are now live in Cribl.Cloud. Meaning, customers can add more Worker Groups to their Organization, gaining additional capabilities specific to Cribl.Cloud deployments! We offer flexibility, scalability, and cost management as part of this feature!
Heroku Monitoring: Getting Started with Metrics
It is important to monitor Heroku applications’ performance to ensure their productive and stable operation. In this article, we will talk about what tools Heroku provides for monitoring applications, which are the most important metrics to monitor, and how MetricFire can help you with this.
Securing Ruby Applications with mTLS
Additionally, We didn’t need to make any changes to our infrastructure, except for adding the certificate and keys to the entities originating the requests from our private subnets. See below for troubleshooting techniques which can be useful when setting up mTLS..
Bi-directional Integration of Cisco AppDynamics and Cisco ThousandEyes
How to use the Grafana Faro Web SDK with Grafana Cloud Frontend Observability to gain additional app insights
Frontend observability (or real user monitoring) is a critical, yet often overlooked, part of systems monitoring. Website and mobile app frontends are just as complex, if not more so, than the backend systems observability teams typically prioritize. They also represent the first interaction users have with our applications — so it’s important to have full visibility into that experience.
Simplify Azure Monitoring with Logz.io's New Azure-Native Integration
If you’re looking to monitor Microsoft Azure infrastructure with Logz.io, we’re now making it easier than ever with our new Azure-native integration Typically, collecting infrastructure metrics from Azure involves installing and configuring data collection components on your system, such as Prometheus, Telegraph, or a number of proprietary agents that are specific to different vendors.
12 DevOps Best Practices Teams Should Follow
DevOps is a software development philosophy that helps organizations achieve faster delivery, better quality, and more reliable software, making it easier to adapt to changing business needs and customer demands. However, implementing DevOps can be challenging on many levels. It requires changes in culture, processes, skills, knowledge, and tools, which can encounter resistance from traditional silos within organizations. So, how can you successfully implement DevOps within an organization?
Unlocking AIOps, Part 2: The build-vs.-buy decision
Hello again! Continuing from our previous blog, in today’s blog we will delve into a crucial decision that organizations often face when considering AIOps implementation—the build vs. buy dilemma. During our LinkedIn Live event on Mapping the impact of AIOps for CIOs, CTOs, and IT managers, we explored the factors to consider when making the build-versus-buy decision and how it impacts an organization’s journey toward efficient IT operations.
How To Set Up a Professional Weather Station?
Failure Metrics & KPIs for IT Systems
Your Self-Managed Journey to Digital Resilience
Mastering Network Monitoring: Your Guide to Uninterrupted Excellence
In the age of digital dominance, where every click and connection propels businesses forward, the lifeline of success lies in the seamless operation of computer networks. Imagine this: your website’s pulse is in perfect sync, applications running smoothly, and customers navigating without a second’s delay. This is where the art of network monitoring steps in, weaving the invisible threads that ensure unparalleled performance and uninterrupted excellence.
The 12 Cats of Observability
On the surface, business-critical IT infrastructure and cats may not seem like they have a lot in common. But they’re way more alike than you might think. Our feline friends contain multitudes, as any cat parent will tell you. They’re complex and can sometimes drive you up a wall. But once they warm up to you—and you warm up to them—the joys and benefits of having them in your life outweigh just about everything. Sounds a lot like technology, right?
14,000+ GitHub stars, 4 Million Docker Downloads, in-context Logs and a Team Workation - SigNal 28
Sending and Filtering Python Logs with OpenTelemetry
What to Do When You Have 1000+ Fields?
Sentry's Open Source Values
This is the 25th year of the Open Source movement, and as with any social enterprise there is a constant effort to maintain and at times renegotiate the meaning of terms and the values behind them. Open Source is a child of the Free Software movement. It uncritically inherited its values and philosophy from its parent, but are those still sufficient today?
Announcing InfluxDB Clustered: InfluxDB 3.0 for Self-Managed Environments
Today, we’re excited to announce InfluxDB Clustered, our latest product developed on the InfluxDB 3.0 product suite. InfluxDB Clustered is the evolution of InfluxDB Enterprise, our popular self-managed product for large-scale time series workloads. For enterprises, the performance leap from InfluxDB Enterprise to InfluxDB Clustered is orders of magnitude higher with significant improvements across analytics, storage, and costs.
InfluxData Announces InfluxDB Clustered to Deliver Time Series Analytics for On-Premises and Private Cloud Deployments
SAN FRANCISCO – September 6, 2023 – InfluxData, creator of the leading time series platform InfluxDB, today announced InfluxDB Clustered, its self-managed time series database for on-premises or private cloud deployments. With the release of InfluxDB Clustered, InfluxData completes its commercial product line developed on InfluxDB 3.0, its rebuilt database engine optimized for real-time analytics with higher performance, unlimited cardinality, and SQL support.
How to Manually Instrument Java with OpenTelemetry (Part 1)
How to Manually Instrument Java with OpenTelemetry (Part 2)
INP - New Metric in Core Web Vitals
In 2020, Google introduced Core Web Vitals (LCP, FID, CLS), officially making them ranking metrics affecting search engine rankings in February 2022. As a next step, in April 2023, Google announced the retirement of several ranking systems (Page experience, Mobile-friendly, Page speed, Secure sites), increasing the impact of Core Web Vitals on rankings.
Understand Your Kubernetes Telemetry Data in Less Than 5 Minutes: Try Mezmo's New Welcome Pipeline
Most vendor trials take quite a bit of effort and time. Now, with Mezmo’s new Welcome Pipeline, you can get results with your Kubernetes telemetry data in just a couple of minutes. But first, let’s discuss why Kubernetes data is such a challenge, and then we’ll overview the steps.
Cloud repatriation: What's behind the return to on-premises?
Find out why cloud repatriation is on the rise — and what makes on-premises the ideal approach for some businesses. Over the last ten years, the cloud has been touted as a game-changer. But, like magpies, have we all jumped on the “shiny object syndrome” bandwagon? Spending on public cloud services continues to show strong growth, with Gartner forecasting that by the end of 2023, worldwide end user spending on public cloud services will total nearly $600 billion.
Building a Scripted Event Collector With Cribl Stream
Cribl Stream provides a robust HTTP REST collector, with many features and options. Still, there are endless combinations that vendors can provide in their API endpoints. Sometimes you may need to take more extreme measures to unlock data stashed begin the API entry point. No worries! Cribl also allows you to run a script to collect that data, and can even help you scale it. In this blog post, we’ll cover how I completed this task for a recent interaction using Qualys.
Google Cloud Platform plugin spotlight
Streamlining Incident Investigation
SLA vs. SLI vs. SLO: Understanding Service Levels
Prometheus vs. Datadog
Before we do a detailed dive into what Prometheus and Datadog are, let's look at the key comparison points. Both Prometheus and Datadog are monitoring tools, but Prometheus is open source and Datadog is proprietary. Prometheus is the de facto tool for monitoring time-series for Kubernetes, and Datadog is an all-around APM, logs, time-series, and tracing tool.
How To Monitor AWS EC2 With MetricFire
AWS EC2 (Elastic Compute Cloud) has revolutionized the way businesses operate in the cloud. With its scalable and flexible infrastructure, EC2 allows organizations to easily deploy virtual servers and manage their computing resources efficiently. However, as your EC2 environment grows, monitoring becomes crucial to ensure optimal performance, security, and cost optimization. One powerful solution for monitoring AWS EC2 is Hosted Graphite by MetricFire, a comprehensive graphing and monitoring service.
Microsoft Dynamics Monitoring: CRM Performance Optimization
Effective Logging in Node.js Microservices
Easy Alert and Metric Creation in Coralogix Custom Dashboards
End-user experience monitoring: Its meaning, importance, and best practices
Approximately 70% of users abandon their shopping carts solely due to a poor end-user experience. Creating a seamless experience for end users is crucial for enhancing customer loyalty and establishing a positive brand reputation. The user-friendliness of a product plays a pivotal role in its success and recognition within the mass market. If a product’s usability is lacking, customers may choose to opt for the services of a competitor instead.
Azure Event Hub logging, monitoring and alerting
Predictive Analytics Using a Time Series Database
Predictive analytics harnesses the power of big data, statistical algorithms and machine learning techniques to anticipate future outcomes based on historical data. Various industries use predictive analytics, from finance and healthcare to retail and marketing. Among its many uses, predictive maintenance and anomaly detection are two significant applications.
You've Goat-to Be Kidding Me: Cracking the Code of Installing the Microsoft Sentinel AMA and CEF Collector without Cribl
As a wise man once said, never ask a goat to install software, they’ll just end up eating the instructions. It may appear that the pesky goats have eaten some of those instructions or eaten too many sticker bushes to keep up with recent Microsoft Sentinel changes if you’ve tried configuring the CEF and Azure Connected Machine Agents. This guide is for you whether you have spent considerable time trying to get these agents to work or just dabbling in the Sentinel waters!
This arctic winter - time to repay your tech debt
We're in a peak tech winter. What should engineering teams focus on when product velocity dwindles?
Simplify observability with the Grafana OpenTelemetry Starter and Spring Boot 3
To help simplify instrumenting Spring Boot applications with Grafana Cloud, we are excited to introduce the Grafana OpenTelemetry Starter, a project that connects the latest Micrometer enhancements from Spring Boot 3 with Grafana Cloud using OpenTelemetry. By using these tools, you will have logs, metrics, and traces in a single service — in the same easy way that you can use Prometheus with Spring Boot.
Logz.io Shines Again! Named on Constellation Observability Shortlist
Logz.io continues to be recognized as a standout observability platform, this time being named by the Constellation Shortlist for Observability. Logz.io—provider of the Open 360™ platform for essential observability—was among 14 vendors selected after a review of more than 50 solutions based on client inquiries, partner conversations, customer references, vendor selection projects, market share and other internal research.
What is Catalyst SD-WAN (formerly Viptela) and how does it work?
Should I Trust a SaaS Vendor or Product?
Before adopting any new SaaS (Software-as-a-Service) business tools, the IT department of an organization should evaluate whether it is wise to trust the SaaS product and indeed vendor.
Manual instrumentation of Java applications with OpenTelemetry
In the fast-paced universe of software development, especially in the cloud-native realm, DevOps and SRE teams are increasingly emerging as essential partners in application stability and growth. DevOps engineers continuously optimize software delivery, while SRE teams act as the stewards of application reliability, scalability, and top-tier performance. The challenge?
Deploying the OpenTelemetry Collector to Kubernetes with Helm
The OpenTelemetry Collector is a useful application to have in your stack. However, deploying it has always felt a little time consuming: working out how to host the config, building the deployments, etc. The good news is the OpenTelemetry team also produces Helm charts for the Collector, and I’ve started leveraging them. There are a few things to think about when using them though, so I thought I’d go through them here.
The Best and Worst Reasons to Adopt OpenTelemetry
It was a rainy day in Seattle at KubeCon + CloudNativeCon North America in December 2018 when I first encountered the term ‘OpenTelemetry.’ At that time, I was an active member of a working group focused on developing W3C Trace Context, a standard now extensively employed for context propagation in distributed systems.
Top 8 things you should know about deploying RabbitMQ
RabbitMQ is a household name in the world of application development and system architecture. Acting as a middleman for communication, it seamlessly bridges the gap between various application components. If you’ve been contemplating the integration of RabbitMQ into your infrastructure or simply want to better understand its functionalities, this blog post is for you. Here are the top 8 things to know.
Azure: The Ultimate Guide to Microsoft's Cloud Computing Platform
Cloud computing has revolutionized the way businesses operate and manage their data. With the vast amounts of information being generated daily, traditional on-premises infrastructure struggles to keep up with the demands of scalability, security, and cost-effectiveness. This is where Azure, Microsoft's cloud computing platform, comes into play. Azure provides a comprehensive set of tools and services that enable organizations to build, deploy, and manage applications and services on a global scale.
How to Monitor Multi-layer Huawei Switch with MetricFire
Monitoring your network infrastructure plays a pivotal role in identifying potential bottlenecks, optimizing performance, and ensuring seamless operations. By implementing a comprehensive monitoring solution like MetricFire, you gain access to a wide range of features and functionalities designed to simplify the process of monitoring and managing your Huawei switches.
Auto-instrumentation of .NET applications with OpenTelemetry
In the fast-paced universe of software development, especially in the cloud-native realm, DevOps and SRE teams are increasingly emerging as essential partners in application stability and growth. DevOps engineers continuously optimize software delivery, while SRE teams act as the stewards of application reliability, scalability, and top-tier performance. The challenge?
Tutorial: Azure Block Blob Storage Collection (How-to)
Tutorial: Collecting Logs From Azure Block Blob Storage Account
Save View in Explorer Pages
Powerful Queries with DataPrime and Coralogix
How to Query Coralogix Log Archive Efficiently
Strong Security Should Not Mean Slow Performance
The security threat vector has become wider and deeper as technology has advanced. Enterprises put a series of tools in place that attempt to close up the many possible holes. But it's not all smooth sailing for everyone. Slow performance due to security measures and high overhead can impact employee productivity.
Part one: 7 must-know object-oriented software patterns (and their pitfalls)
Object-oriented (not orientated!) design is a fundamental principle of modern software engineering, a crucial concept that every developer needs to understand and employ effectively. Software design patterns like object-oriented design serve as universal solutions to common problems, across a range of instances and domains. As software engineers advance in their careers, they actually often start using these patterns instinctively, even without knowing it.
Top 6 AIOps Use Cases
In the realm of modern IT, where the infrastructure complexity grows by the day and downtime equates to high-stakes losses, a transformative solution is not just desirable – it’s the need of the hour. Enter Artificial Intelligence for IT Operations (AIOps) — a powerful combo of AI and IT operations that is reshaping the landscape of IT management. And these are not just empty claims.
Observability vs Monitoring: What's the Difference?
Observability and monitoring: These terms are often used interchangeably, but they represent different approaches to understanding and managing IT infrastructure. If you are new to these terms or are often confused between the two, this blog is for you! In this blog, we'll explore the key concepts of observability and monitoring, their evolution in IT operations, their differences and similarities, and their importance in modern infrastructure.
Maximizing Java Application Performance - Configuration and Tuning Tips
In the past, there was a persistent misconception that Java was slow compared to other programming languages. But this idea comes from a time when Java was just starting out. Back then, Java did have some problems that made it seem slow. For example, it took a long time for Java programs to start running, and the way Java made user interfaces for applications was not very fast. But things have changed a lot since then. Hence, the outdated belief that Java is slow is exactly that – outdated.
Learn about LogicMonitor's new launch approach
AIOps in Banking: Revolutionizing Financial Services
What if banks had an intelligent assistant that not only detects anomalies in real-time but also predicts potential issues before they even occur. Well, AIOps has made that reality today. AIOps in banking is a perfect example of technology blending with financial services to redefine operational excellence and customer experiences. From bolstering security measures to reducing banking costs, AIOps offers several game changing benefits that address challenges faced by the BFSI sector for a long time.
Coralogix Logging vs GCP Logging: Features, Pricing and Support
Google Cloud Platform (GCP) offers a wide range of features to support their core deliverable, highly available and scalable infrastructure-as-a-service. One of the features—GCP’s log management and available via GCP Log Explorer— is offered to support customers’ basic logging requirements.
When to scale tasks on AWS Elastic Container Service (ECS)
Since its inception, Amazon Elastic Container Service (ECS) has emerged as a strong choice for developers aiming to efficiently deploy, manage, and scale containerized applications on AWS cloud. By abstracting the complexities associated with container orchestration, ECS allows teams to focus on application development, while handling the underlying infrastructure, load balancing, and service discovery requirements.
CostGPT: Anodot's AI Tool Revolutionizing Cloud Cost Insights
It’s pretty clear that AI is changing how people consume, create, and extract data and information. When it comes to cloud costs, having everything automated can give our users personalized analysis without spending much time on it. Imagine resolving these frequent cloud cost challenges with a simple search: Get ready because this dream is about to turn into reality! Our new AI tool, CostGPT provides instant insights into cloud cost structure.
From Alarms to Action: Enhancing Business Security Response Protocols
LogicMonitor Selenium Synthetics Demo
Install BindPlane OP Server
Unlocking AIOps, Part 1: The key use case
For IT operations, staying ahead demands innovative solutions that can efficiently manage the complexities of modern IT environments. With AI trending, the adoption of AI in IT operations (AIOps) is gaining traction within the IT community. What exactly is AIOps? AIOps is the convergence of artificial intelligence, machine learning, and big data analytics, aimed at redefining the management of IT operations. It enables unprecedented efficiency, effectiveness, and proactivity.
OpManager Plus Enterprise edition
OpManager Plus is an all-in-one IT infrastructure management tool that helps enterprises monitor, troubleshoot, and optimize their network infrastructure, servers, applications, firewalls, and virtual environments from a single console. Enhanced by artificial intelligence and full stack observability, OpManager Plus enables IT teams to proactively identify and resolve issues before they affect end users, thus ensuring uptime and performance of critical business applications.
Avoiding packet loss: 5 steps to a streamlined network
Introducing NetFlow Analyzer's standard edition
Alethe Consulting Case Study
Government Administration case study
Using Solr Operator to Autoscale Solr on Kubernetes
In this tutorial, you’ll see how to deploy Solr on Kubernetes. You’ll also see how to use the Solr Operator to autoscale a SolrCloud cluster based on CPU with the help of the Horizontal Pod Autoscaler. Let’s get going! 🙂
August Product Updates for Sentry
During the month of August we dropped heaps of new features across the entire Sentry platform. From identifying user frustration through rage and dead clicks to expanding front end Profiling support, your Sentry Dev Team has skipped their summer vacations (well, kinda…) and been hard at work delivering more capabilities to help you better deal with application errors and performance issues.
Real Azure DevOps use case: A SaaS company's CI/CD pipelines
How do companies actually use Azure DevOps? What are the use cases? We took a look at how the team at SquaredUp uses Azure DevOps to build their CI/CD pipelines and deploy new features to their SaaS product.
Can Companies Really Self-Host at Scale?
Self-hosting is effective for many companies. But when is it time to let go and try the easier way? There’s no such thing as free lunch, or in this case, free software. It’s a myth. Paul Vixie, vice president of security at Amazon Web Services, creator of the original Domain Name System (DNS), gave a compelling presentation at Open Source Summit Europe 2022 about this topic.
Incident Review: What Comes Up Must First Go Down
On July 25th, 2023, we experienced a total Honeycomb outage. It impacted all user-facing components from 1:40 p.m. UTC to 2:48 p.m. UTC, during which no data could be processed or accessed. This outage is the most severe we’ve had since we had paying customers. In this review, we will cover the incident itself, and then we’ll zoom back out for an analysis of multiple contributing elements, our response, and the aftermath.
What makes a good open source community?
Whenever you use open source software, you benefit from the community that surrounds it — whether it’s a bug fix, better documentation, a helpful tutorial or something else. We at Grafana Labs benefit from the open source community, too: from your participation, and the many OSS components we use in the development of Grafana itself. But what makes an open source community successful, exactly? And how do you build and nurture one?
Item Detail Page Updates
We’ve been listening to all the great feedback we’ve received on the new item detail page, and we’re pushing changes to help make investigating and understanding Rollbar items easier, quicker, and more efficient. The most visible change is that the context graphs have been moved to a single full-width view on the desktop so that you can immediately see the patterns of when occurrences happened, helping to spot patterns in behavior that can give insights into causes.
Grafana Incident auto-summary: AI in Grafana Cloud
Heroku Monitoring: How To Build A Heroku App
In our world that's always changing, making and launching apps quickly is important. Whether your business is big or small, turning new ideas into working apps is key to success. That's where Heroku comes in.
Heroku Monitoring: Best Practices
When you immerse yourself in the world of application development, you'll find that deploying applications on Heroku comes with a certain level of ease. However, monitoring becomes a non-negotiable element to keep these applications running at their best. It's like having a clear aerial view of your application's performance - it helps you spot potential performance hurdles and handle issues proactively.
Deleting Fields from Logs: Why Less is Often More
The Fatal Unconnectedness of Incumbents from Customers: The Tale of a Race Against the Clock
This tale is based on an actual event that happened to one of our Cribl Search customers. It highlights a massive gap between the urgent needs of modern businesses and the outdated, draconian terms dictated by traditional SIEM vendors. While the events are real, a touch of dramatization was added for the fun of it. Why not?


