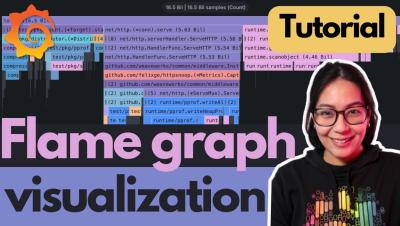
Dashboards

Setting up your Grafana k6 performance testing suite: JavaScript tools, shared libraries, and more

Editor’s note: This blog post is the second in a series of posts about organizing your performance testing suite with Grafana k6. If you haven’t already, be sure to check out the first post in the series, which explores how to implement reusable test patterns and other best practices within your testing suite.

The Best 15 Interactive Dashboard Examples

Your organization, irrespective of its size, is likely creating a substantial amount of data, and deriving value and insights from this data is vital. This is where dashboards can assist you. With reporting dashboards, you can cut through the noise, and select the metrics that are pivotal to your team to begin visualizing them and the trend of these metrics through continuous monitoring, enabling your team to acquire actionable insights.

Grafana Cloud Synthetic Monitoring: How to simulate user journeys to ensure the best possible end-user experience

Here at Grafana Labs, we have a long-standing commitment to helping our users understand how their applications and services behave from an external point of view. This critical practice — known as synthetic monitoring — has been a key focus of ours for nearly a decade. Back in 2015, we released worldPing, our first product to help measure the user experience and improve website performance.

Proactively monitor user journeys with Grafana Cloud Synthetic Monitoring

Grafana Cloud Synthetic Monitoring proactively monitors the performance of your APIs and web applications from the user's perspective. Powered by Grafana k6, Synthetic Monitoring combines GUI-based and as-code monitoring to improve efficiency, collaboration, and application reliability. Watch this demo of how to use Synthetic Monitoring in Grafana Cloud.

Organizing your Grafana k6 performance testing suite: Best practices to get started

In 2017, we open sourced Grafana k6 and made its first beta available to everyone. This wasn’t our first rodeo — k6 marked the third load testing tool our team had developed over a decade. We had recognized the gaps in existing solutions, as well as the barriers that were hindering adoption in the developer community. The plan was simple yet ambitious: let’s build a tool developers actually enjoy using and that helps engineering teams build more reliable software.

How Dell ISG Consolidated Observability Tooling Without Losing Functionality | Grafana Customer

In this recorded session, Brian Murphy, Technical StafF SRE at Dell Technologies shares how his team, Dell ISG consolidated Observability tooling without losing functionality using Grafana Cloud. The ISG team own “Northstar Tooling” which consists of Artifactory, Github Enterprise, Jenkins, and more. They also They also manage the Internal Cloud and k8s clusters, as well as all the hardware and networking that goes with it.

OpenTelemetry Looks Good To Me: Loki, Grafana, Tempo, Mimir | GrafanaCON 2024 | Grafana

In this talk, D-EDGE Principal Engineer Clément Boudereau introduces you to Loki for logs, Tempo for traces, and Mimir for metrics by using two simple Java applications, OpenTelemetry, and Grafana dashboards. Helpful links:☁️ Grafana Cloud is the easiest way to get started with Grafana dashboards, metrics, logs, and traces. Our forever-free tier includes access to 10k metrics, 50GB logs, 50GB traces and more. We also have plans for every use case.