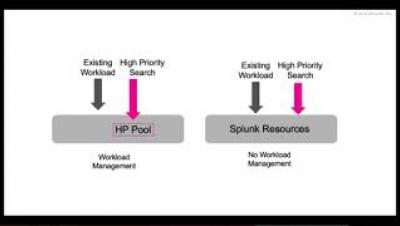
High Priority Search Execution with Splunk Workload Management
This short video talks about different use cases where workload management may be used. It also demonstrates high priority search execution use case.


Customers today are faced with a wide variety of industry terminology: APM, IOTA, BPM, OI, BAM and AIOps, just to name a few. Using different terminology like this might help large vendors expand their market size with different positioning offerings, but it certainly doesn’t help their customers understand what they’re getting. Companies spend tens of millions of dollars to solve their problems with the wrong solutions and struggle to get value from it.
It may be back-to-school month, but the glitches never went on summer vacation! Check out the glitches that occurred since our last report…
Demand forecasting is the process of predicting future demand for a company’s products or services. Understanding how many customers will want to purchase or use something is critical for acquiring inventory, planning capacity, scheduling resources, producing products and managing the supply chain. How many people should you schedule for a work shift? How many widgets should you produce this quarter? When should you build additional capacity into your systems?
What a pleasure it was to see many of our customers at our Illuminate user conference, September 11-12. We had record attendance from customers, influencers, and partners. Our time was packed with keynotes, customer presentations (35 customer breakout sessions), certifications, sharing best practices, and time networking and having fun together.
Jim Barksdale, former CEO of Netscape, once said “If we have data, let’s look at data. If all we have are opinions, let’s go with mine.” While Jim may have said this in jest, the exponential boom in data collection indicates that we increasingly prefer to rely on facts rather than conjecture when making business decisions. More data yields greater insights about customer preferences and experiences, internal processes, and security vulnerabilities — just to name a few.
Everything old is new again–that’s a universal law! In our industry, we have talked about Service Level Agreements (SLAs) for a long time. At Sumo, we are proud to continue to be the only Machine Data Analytics Platform as a Service that commits to a query performance SLA.
Log file parsing is the process of analyzing log file data and breaking it down into logical syntactic components. In simple words - you’re extracting meaningful data from logs that can be measured in thousands of lines. There are multiple ways to perform log file parsing: you can write a custom parser or use parsing tools and/or software.