Operations | Monitoring | ITSM | DevOps | Cloud

Unlock the Real Value of Logs With Honeycomb Telemetry Pipeline and Honeycomb for Log Analytics

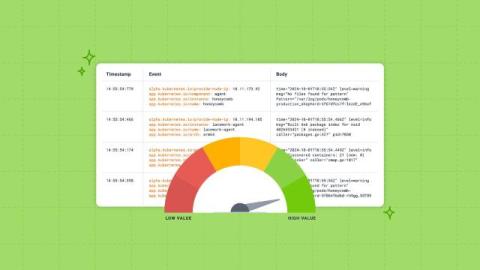
At Honeycomb, we know how important it is for organizations to have a unified observability platform. This is why we’re launching Honeycomb Telemetry Pipeline and Honeycomb for Log Analytics: to enable engineering teams to send and analyze data—including logs—into a single, unified platform. For too long, teams have had to wrangle large volumes of logs, their context scattered across multiple teams and tools, leading to knowledge silos.

Frontend Observability: A Candid Conversation With Emily Nakashima and Charity Majors

Frontend development has evolved rapidly over the past decade, but one challenge remains constant: understanding what’s happening in real-time across diverse browsers, environments, and user interactions. This is where observability steps in—but how does it apply to the frontend world where user experience can break in countless, unexpected ways?

Redefining RUM: A Comparative Gap Analysis of Existing Tools

Real user monitoring (RUM) began as a straightforward approach to tracking basic web performance metrics. Focused on things like page load times and response rates, RUM relied on server-side logging and simple browser timings. While these tools captured Core Web Vitals (CWVs), they offered limited insights into how users actually interacted with pages, focused mainly on server-side performance.

Using Honeycomb for Frontend Observability to Improve Honeycomb

Recently, we announced the launch of Honeycomb for Frontend Observability, our new solution that helps frontend developers move from traditional monitoring to observability. What this means in practice is that frontend developers are no longer limited to a metrics view of their app that can only be disaggregated in a few dimensions. Now, they can enjoy the full power of observability, where their app collects a broad set of data as traces to enable much richer analysis of the state of a web service.

Refinery and EMA Sampling

Refinery is Honeycomb’s sampling proxy, which our largest customers use to improve the value they get from their telemetry. It has a variety of interesting samplers to choose from. One category of these is called dynamic sampling. It’s basically a technique for adjusting sample rates to account for the volume of incoming data—but doing so in a way that rare events get more priority than common events. Honeycomb’s query engine can compensate for sampling rates on a per-event basis.

Syncing PagerDuty Schedules to Slack Groups

We’ve posted before about how engineers on call at Honeycomb aren’t expected to do project work, and that whenever they’re not dealing with interruptions, they’re free to work on whatever will make the on-call experience better. However, all of our engineering rotations rely on hand-off meetings where they update the Slack groups with everyone who’s on call. During my last shift, a small problem kept causing friction for some of our incident management automation.

Investigate Performance issues with SLOs

When an alert goes off because a Service Level Objective (SLO) is in danger of violation, it comes with a lot of context about what has been going wrong and for how long. Then Honeycomb gives you tools to explore the where & why. Here, Martin Thwaites walks through an example of diagnosing slower performance. What service is the problem, and under what circumstances?