Plugins make it easier for Grafana users to get faster time to value. With a few clicks, you can start tapping into the different data stores you and your business already leverage — and see them all in one place in your Grafana dashboard. I’m a huge fan of partner-developed plugins for a few reasons, with my favorite being subject matter expertise. Who better to develop your plugin than the team that knows the product inside out?
As an open source company, we understand the value of open standards and interoperability. This holds true for Grafana Cloud and our managed Tempo service for traces, which is currently in beta. The Grafana Agent makes it easy to send traces to Grafana Cloud, but it is not required. In fact, Grafana Cloud’s Tempo service is exposed as a standards-compliant gRPC endpoint that conforms to the Open Telemetry TraceService with HTTP Basic authorization.
Prometheus’s remote write system has a lot of tunable knobs, and in the event of an issue, it can be unclear which ones to adjust. In this post, we’ll discuss some metrics that can help you diagnose remote write issues and decide which configuration parameters you may want to try changing. First, let’s discuss how remote write is implemented. In the past, remote write would duplicate samples coming into Prometheus via scrape.
One of the big questions in monitoring can be summed up as: Who watches the watchers? If you rely on Prometheus for your monitoring, and your monitoring fails, how will you know? The answer is a concept known as metamonitoring. At Grafana Labs, a handful of geographically distributed metamonitoring Prometheus servers monitor all other Prometheus servers and each other cross-cluster, while their alerting chain is secured by a dead-man’s-switch-like mechanism.
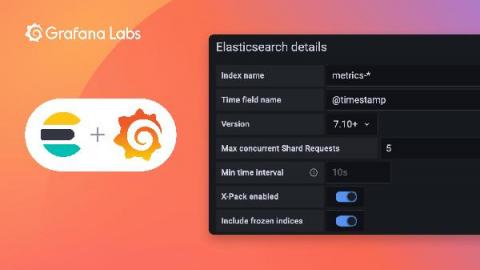
One of the biggest challenges with data visualization for complicated software systems is getting quick access to the underlying data and connecting it to some form of cloud-hosted solution. Traditionally it has required quite a bit of middleware and upfront setup with additional tooling.
Setting up Prometheus to scrape your targets for metrics is usually just one part of your larger observability strategy. The other piece in the equation is figuring out what you want your metrics to tell you and when and how often you should know about it. Thankfully, Prometheus makes it really easy for you to define alerting rules using PromQL, so you know when things are going north, south, or in no direction at all.
Exemplars are a hot topic in observability recently, and for good reason. Similarly to how Prometheus disrupted the cost structure of storing metrics at scale beginning in 2012 and for real in 2015, and how Grafana Loki disrupted the cost structure of storing logs at scale in 2018, exemplars are doing the same to traces. To understand why, let’s look at both the history of observability in the cloud native ecosystem, and what optimizations exemplars enable.
A very fun part of my job as a Solutions Engineer at Grafana Labs is getting to learn the ins and outs of a new feature or play with a plugin while it is still in development. So, when I heard murmurs that our latest Enterprise plugin would be an integration with Jira, I felt the forsaken call of the agile sirens luring me back to my days when I worked as a technical writer on a product team.
We’ve been experimenting with new ways to use and operate Prometheus over the past year. Every successful Grafana Agent experiment turns into an upstream contribution for the whole Prometheus community to benefit from. In this blog post, I go over the history of the Agent’s successful — and not so successful — experiments.